Stochastic Regulation of her1/7 Gene
Expression Is the Source of Noise in the
Zebrafish Somite Clock Counteracted by
Notch Signalling
Robert P. Jenkins1,2*, Anja Hanisch2, Cristian Soza-Ried2, Erik Sahai1*, Julian Lewis2†
1Tumour Cell Biology Laboratory, The Francis Crick Institute Lincoln’s Inn Fields Laboratory, London, United Kingdom,2Vertebrate Development Laboratory, The Francis Crick Institute Lincoln’s Inn Fields Laboratory, London, United Kingdom
†Deceased.
*[email protected](RPJ);[email protected](ES)
Abstract
The somite segmentation clock is a robust oscillator used to generate regularly-sized seg-ments during early vertebrate embryogenesis. It has been proposed that the clocks of neighbouring cells are synchronised via inter-cellular Notch signalling, in order to overcome the effects of noisy gene expression. When Notch-dependent communication between cells fails, the clocks of individual cells operate erratically and lose synchrony over a period of about 5 to 8 segmentation clock cycles (2–3 hours in the zebrafish). Here, we quantita-tively investigate the effects of stochasticity on cell synchrony, using mathematical model-ling, to investigate the likely source of such noise. We find that variations in the
transcription, translation and degradation rate of key Notch signalling regulators do not explain thein vivokinetics of desynchronisation. Rather, the analysis predicts that clock desynchronisation, in the absence of Notch signalling, is due to the stochastic dissociation of Her1/7 repressor proteins from the oscillatingher1/7autorepressed target genes. Using in situ hybridisation to visualise sites of activeher1transcription, we measure an average delay of approximately three minutes between the times of activation of the twoher1alleles in a cell. Our model shows that such a delay is sufficient to explain thein vivorate of clock desynchronisation in Notch pathway mutant embryos and also that Notch-mediated syn-chronisation is sufficient to overcome this stochastic variation. This suggests that the sto-chastic nature of repressor/DNA dissociation is the major source of noise in the
segmentation clock.
Author Summary
The anatomy of complex organisms depends on the reliable formation of spatial patterns of gene expression during development. Many factors have to be coordinated to regulate
OPEN ACCESS
Citation:Jenkins RP, Hanisch A, Soza-Ried C, Sahai E, Lewis J (2015) Stochastic Regulation of her1/7 Gene Expression Is the Source of Noise in the Zebrafish Somite Clock Counteracted by Notch Signalling. PLoS Comput Biol 11(11): e1004459. doi:10.1371/journal.pcbi.1004459
Editor:Arthur D Lander, University of California Irvine, UNITED STATES
Received:September 29, 2014
Accepted:July 9, 2015
Published:November 20, 2015
Copyright:© 2015 Jenkins et al. This is an open access article distributed under the terms of the
Creative Commons Attribution License, which permits unrestricted use, distribution, and reproduction in any medium, provided the original author and source are credited.
Data Availability Statement:A subset of our data can be found in:https://github.com/RobertPJenkins/ PLoSCompSomiteClockNoise.git
gene expression and stochasticity in these events could undermine pattern formation. One well-studied example of pattern formation is the sequential formation of somites, embry-onic segments of the vertebrate body. In this system, a spatial pattern is generated by the movement of a gene expression oscillator along the body. Effective pattern formation requires that neighbouring cells oscillate in synchrony with one another. Genetic experi-ments have determined that Notch signalling is required for synchrony, leading to the pro-posal that Notch signalling counteracts noise in this system. However, the source of noise has never been demonstrated. Via mathematical modelling, we explore different sources of noise. We show that the likely source of this noise is the randomness of switching on of key oscillator genes,her1/7. Experimental measurements enable us to measure the delay in the timing of activation of the twoher1gene copies in each cell. This delay allows us to estimate the stochasticity inher1/7gene regulation. This delay explains the rate of neigh-bouring cell desynchronisation in the absence of Notch signalling.
Introduction
Robust and reproducible generation of patterned tissues is a key feature of metazoan develop-ment. Noise in regulatory mechanisms has the potential to disrupt this process. As a result, many regulatory networks have evolved to be robust to noise. One such example is the segmen-tation of the vertebrate body axis, a remarkably precise process. Segments originate from bilat-eral blocks of cohesive groups of mesoderm cells, called somites, along the antero-posterior body axis on either side of the neural tube, in a process known as somitogenesis. Ultimately, somites differentiate and give rise to ribs, vertebrae and skeletal muscles of the body. The pre-somitic mesoderm (PSM), a region of undifferentiated tissue at the posterior of the embryo is the source of newly formed somites. FGF and Wnt are produced in the tailbud and are thought to define the extent of the PSM by maintaining cells in an active, plastic state within range of their signalling. As the embryo grows caudally, cells at the anterior of the PSM continuously emerge and move out of range of these posterior signals. In doing so, they begin differentiation and break up into somites separated by clefts or somite boundaries via a process known as the wavefront of maturation [1–8]. A molecular oscillator, known as the segmentation clock, defines the periodic spacing of the boundaries between successive somites [9]. This segmenta-tion clock involves the regular coordinated cycles of producsegmenta-tion and degradasegmenta-tion of transcripts of certain genes in the tail end of the embryo. During each such cycle, one additional somite is formed as another set of cells emerge from the PSM. It is the cyclic behaviour of the tion clock that goes on to establish the segmental pattern of the vertebrae body. This segmenta-tion clock runs at fastest speed in the posterior secsegmenta-tion of the PSM and it is here that the periodicity of somite formation is determined [9–16]. As cells overflow out of the PSM, they stop oscillating [17], switch on expression of further genes and become arrested in their current state before beginning differentiation [18]. Hence, we observe that the spatially periodic pattern of gene expression is a consequence of the temporal oscillation of gene expression in the PSM.
Oscillating genes in zebrafish that are regulated by Notch includeher1andher7, which encode transcriptional repressors; these genes are thought to be the pacemakers of the entire somite clock. Whenher1andher7genes are transcribed, there is a delay in the synthesis and export of their mRNAs and, thereby, until the repressor Her1 and Her7 proteins are synthe-sised. These proteins then accumulate until they autoinhibither1andher7transcription [18– 24]. Transcription of these genes resumes only when the mRNAs and repressor proteins have degraded. These time delays result in oscillatoryher1andher7mRNA expression within each Noise in the Somite Segmentation Clock: Theory and Measurement
cell (Fig 1A) [18,19], and determine the period of oscillation and, ultimately, the size of a somite [18–20,25,26].
The cyclic nature of the segmentation clock relies on the internal regulatory dynamics within each cell, which varies from cell to cell and is subject to stochastic effects. Noise is a fun-damental part of cell regulation [27–33] and leads to heterogeneity in cellular populations [34]. Hence, it is heavily associated with poor prognosis in disease [35] and allows cells greater flexi-bility to deal with their environment [36]. For the development of ordered structures such as somites, the system requires the cells to behave as homogeneously as possible. Noise in cell reg-ulation is consequently, an area of research that is increasingly being explored.
All known zebrafish mutations that disrupt PSM oscillations affect components in the Notch signalling pathway [19,25,26,37–47]. When Notch signalling fails, only 5–8 somites form normally, after which somite boundaries become absent or irregular, leading to a failure of segmentation. Jiang et al. (2000) proposed a simple explanation for this phenomenon: all cells in the PSM start out their oscillation synchronously, but the lack of Delta-Notch cell-cell communication leads to a progressive loss of clock synchrony and salt and pepper expression patterns of cycling genes that are required to position the inter-segmental boundaries [17,47– 49]. When blocking Notch with the inhibitor DAPT, for example, approximately 12
somites will form, representing five anterior somites whose boundaries were already deter-mined, and about another seven posterior somites that form before clock desynchronisation is sufficiently severe to prevent boundary formation [48]. Both Notch mutants and chemical disruption of Notch signalling suggest that cells drift out of synchrony in around 5 to 8 oscillations.
To investigate the source of the noise that leads to desynchronisation, we turned to mathe-matical modelling. We have continued the development of the mathemathe-matical model, incorpo-ratingher1/7and Delta-Notch, begun by Lewis 2003 [20] and most recently expanded by Hanisch et al. 2013 [50]. We introduced probabilistic rate and delay variables for transcription, translation and mRNA and protein degradation before considering the kinetics of transcrip-tional de-repression and we show that only the latter predicts that cells drift out of synchrony at a rate comparable to Notch mutants. Finally we considered the mathematical modelling of the wildtype situation, such that cells are able to signal to their immediate neighbours via Notch signalling, demonstrating that Notch signalling overrides the levels of noise that we have quantified and keeps neighbouring cells oscillating in synchrony.
Results
Inter-cellular variability in the rate and delay constants does not drive
rapid drift to asynchrony
to investigate whether desynchronisation of independently oscillating cells is a result of inter-cellular variability in the transcription, translation or degradation rates, the transcription or translation delays or the number of Hes6 molecules. The modelling of stochastic gene regula-tion was altered significantly to make the mechanisms more realistic and therefore the results more accurate, in order to correctly investigate the effects on the system. In depth information about the model, how it has been adapted, and parameter choices can be found inS1andS2
Texts. For such analysis we carried out our simulations without Notch signalling and consid-ered 100 independently oscillating cells. Following on from the observations of [17] whereby when somitogenesis begins, cells begin their oscillations in synchrony, cells were modelled with identical initial populations ofher1andher7mRNA and Her1 and Her7 protein and the same number ofher1andher7genes switched on (when considering the gene regulatory level).
To determine if inter-cellular variability in the transcription, translation or degradation rates or transcription or translation delay could be the source of noise that causes cells to drift out of synchrony, we considered a purely deterministic model forher1/7mRNA and protein regulation. Parameter space exists that does not lead to oscillation (for example, very short delays leads to no oscillation), this area of parameter space was excluded from further consider-ation. We introduced inter-cellular variability by selecting the relevant parameter value from a Gaussian distribution centred at the fitted value for that parameter. We aimed to maximise the standard deviation of these distributions, without affecting the qualitative behaviour of the oscillations such that some cells no longer exhibited oscillation.
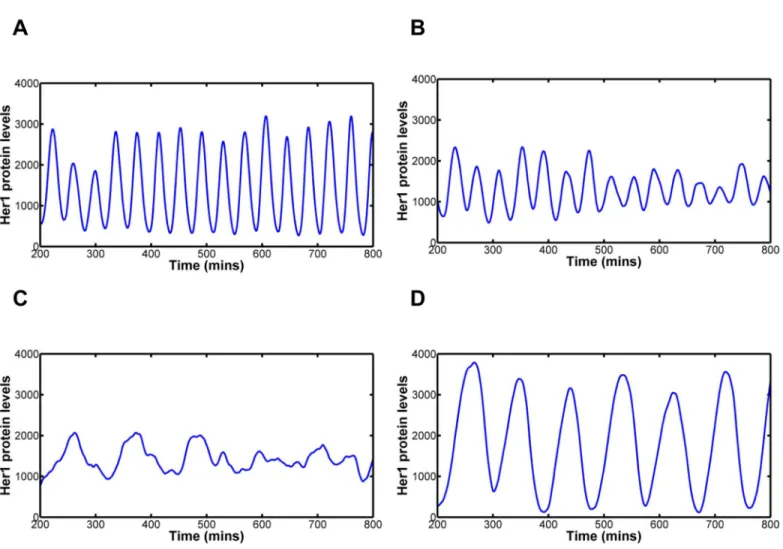
Fig 1B–1Dillustrates that this simple model, incorporating just theher1/7 negative feedback
loop, is capable of generating oscillations within the system and demonstrate the effect of inter-cellular variability in the transcription, translation and degradation rates respectively. The col-oured lines give the Her1 protein levels for five randomly selected cells whilst the black line gives the mean Her1 protein levels for all 100 cells. The amplitude of oscillation of the mean reflects the amplitude in the individual cells in addition to the degree to which neighbouring cells are in synchrony. Altering the transcription, translation or degradation rate of a molecule primarily affects the amplitude of oscillation of that molecule whilst effects on period of oscilla-tion are generally small (S1A–S1C Fig). Each individual cell has a different, randomly gener-ated, rate constant affecting the oscillations in that single cell, as demonstrated by the smooth behaviour of the amplitude and period curves of each cell. Thus, we demonstrate that individ-ual cells still oscillate almost in synchrony, just with amplitudes independent of each other. In Fig 1. Modelling the effects of inter-cellular variability in transcription, translation and degradation rates and delays.1A: Her1/7 feedback loop in which Her1/7 protein inhibits expression ofher1/7genes. There is a delay in transcription oftm
h1=7and a delay in translation oftph1=7:Stimulation is given by!
and inhibition bya. 1B-1H: The oscillating Her1 population levels forfive independent cells in the system (blue, red, green, magenta and cyan) and overlaid
mean population level of all 100 cells in the system (black) versus time for variability in reaction rate, delay and number of Hes6 molecules. The mean population levels reflect how synchronous the oscillations of neighbouring cells are in addition to the amplitude of oscillation of the individual cells. Inter-cellular variability is distributed as a Gaussian distribution with mean,μ, and standard deviation,σ, i.e. asN(μ,σ2). The mean value is given by thefitted values for each parameter (seeS2 Text) with the maximum variation possible before qualitative changes in oscillatory behaviour occur. Quantification
methods for desynchronisation can be found in Methods andS3 Fig. 1B: Variability in transcription rate,αh, distributed asαh*N(33,92). The system is very robust to changes in transcription rate. Cells are still oscillating in synchrony after 30 oscillations. 1C: Variability in translation rate,βh, distributed asβh*N (9.2, 1.52). The system undergoes severe damping when translation rate falls below 4.6 min-1. Cells are still oscillating in synchrony after 30 oscillations. 1D:
Variability in degradation rate,λh, distributed asλh*N(0.23, 0.0252). The system undergoes severe damping when degradation rate falls below 0.15 min-1. Cell clocks desynchronise in 20–21 oscillations. 1E: Variability in transcription delay,tm
h1=7;for bothher1andher7, distributed astmh1=7Nð
7;0:52
Þ. Damping of oscillation on individual cells occurs for values below 5 min. Cell clocks desynchronise in 11–12 oscillations. 1F: Variability in translation delay,tp
h1andtph7
forher1andher7respectively, distributed astp
h1Nð
1:1;0:32
Þandtp
h7Nð
0:7;0:22
Þ. Cell clocks desynchronise in 20–21 oscillations. 1G: Variability in
transcription delay,tm
h1=7;for bothher1andher7, distributed as Generalised Pareto distributions with parameters, location of 5.84, scale of 1.10 and shape of
0.05, resulting in expected values 7 and variances 1.5. In this instance a small number of cells have much increased transcription delay, resulting in the increased variance for the sample. Cell clocks desynchronise in 14–15 oscillations. 1H: Variability in cellular numbers of Hes6 molecules,ph6, distributed as ph6*N(100, 252). Cells are still oscillating in synchrony after 33 oscillations. Inter-cellular variability in the reaction rate and delay constants and number of Hes6 molecules is not of the right magnitude to explain the desynchronisation of oscillation in Notch mutants.
each case, there is a small damping effect on the mean amplitude of all cells. Random degrada-tion results in the greatest damping but, this is a reflecdegrada-tion, primarily, of the amplitude of oscil-lation decaying to a smaller magnitude in cells with a low degradation term (low degradation of the inhibitory proteins results in lower levels of gene expression). Quantitatively, we defined the point at which desynchronisation of neighbouring cells was reached based on how the sam-ple distribution of Her1 protein levels in the 100 cells changed over time (seeMethods). Inter-cellular variability in transcription and translation rates results in the cells still oscillating in synchrony with one another after 30 oscillations, whilst cells desynchronise in 20–21 oscilla-tions in the case of variability in degradation. The system is very robust to the effects of inter-cellular variability in transcription, translation and degradation rates.
Following on from this, we investigated the effects of inter-cellular variability in transcrip-tion and translatranscrip-tion delay. Transcriptranscrip-tional and translatranscrip-tional delays in the model, which incor-porate such things as splicing and export time to the cytosol, determine the period of
oscillations in the system [20] and also affect amplitude of oscillation (S1D and S1E Fig). Cells drift out of synchrony in 11–12 clock cycles due to variability in transcription delay (Fig 1E) and 20–21 oscillations in the presence of variability in translation delay (Fig 1F). The slow drift out of synchrony is due to each individual cell having its own period of oscillation that tends to a constant value that is independent of other cells (S1D and S1E Fig).
We observed that the maximum amount of variation in transcription and translation delay allowable in our model is lower than that quantified experimentally [18]. This suggests that such delays may be asymmetrically distributed such that the effect of increased variance would still result in no cells having such low delays that oscillations cease and a small number of cells having very long delay times. To consider the effect of an increased variance and skew in the distributions of delay we considered the heavily skewed Generalised Pareto distribution. Increasing the variance of transcription delay to be comparable to experimental data [18] resulted in a small effect on desynchronisation rates (Fig 1G) with cells desynchronising in 14–
15 oscillations in this example, as the increase in variation was due, predominantly, to a small number of cells oscillating with much longer periods.
Finally, within our model, Her1 functions as a homodimer and Her7 as a heterodimer with Hes6, with the number of Hes6 molecules assumed constant in each cell as in [50]. We thus considered the effects of inter-cellular variability in the number of Hes6 molecules. Variation in this term affects the amplitude of oscillation with only marginal effects on period of oscilla-tion (S1F Fig) resulting in cells still oscillating in very close synchrony after 33 oscillations (Fig
1H).
Inter-cellular variability in the reaction rate and delay constants and number of Hes6 mole-cules causes a desynchronisation in 11–12 oscillation cycles at the minimum. This would mean that on blockade of Notch signalling with DAPT, a further 16-17 somites would form correctly (5 anterior somites and the 11-12 posterior somites prior to desynchronisation) and is there-fore not consistent with the experimental results in Notch deficient embryos. The speed of desynchronisation is determined by the magnitude of variation between cells. Inter-cellular variability has been considered at the maximum possible, using Gaussian distributions, such that we still maintain oscillation in our model. Reducing the inter-cellular variability from the levels described here decreases the speed of desynchronisation. Only severe changes in parame-ter values resulting in individual cells ceasing oscillation will cause the mean amplitude of all cell oscillations to decay to zero at the correct rate. This decay would therefore not illustrate the desynchronisation of neighbouring cells as is argued to occur in [17,20,56,57], but the fact that some cells exhibit damped oscillation and some go on to stop oscillating entirely. We therefore ruled out inter-cellular variability in rate and delay constants and cellular numbers of
Hes6 molecules as being the main driver of desynchronisation. Hence, we turned to investigate the effects of noise in the stochastic nature of binding between molecules in the system.
Stochastic gene regulation can explain the rate of clock
desynchronisation when Notch signalling fails
A significant source of noise in reaction kinetics arises from the randomness of which mole-cules associate or dissociate from one another and when these reactions occur. Chemical reac-tions are inherently noisy with population levels changing by discrete amounts in a manner that is not wholly predictable. Therefore, deterministic modelling is generally accurate only when population levels are so large that random fluctuations can be ignored [58–61]. In the analysis above, only rate and delay constants were fitted randomly, the chemical reactions themselves were modelled deterministically. For modelling of mRNA and protein behaviours, this is reasonable due to the large numbers of molecules in each cell. However, cells in G1 phase of the cell division cycle will have only two copies of the DNA encoding for Her1 and Her7. Hence, noise in the chemical kinetics will be dominant at the level of gene regulation, i.e. switching genes on or off. Stochastic gene regulation is well studied with a wealth of papers car-rying out experimental [27–29,33,36,62] and mathematical [63–66] analysis of the stochasti-city. Indeed, Horikawa et al. [67] have previously noted that this noisy gene regulation, alongside the stochastic nature of cell division, is responsible for the variation in oscillation phases in neighbouring cells, in wildtype embryos. Therefore, we investigated if desynchronisa-tion could be caused by the stochasticity of the binding and dissociadesynchronisa-tion of gene regulatory pro-teins Her1 and Her7 to and from their sites onher1andher7DNA (Fig 2A).
To analyse the stochastic effects of gene regulation on the system, we combined stochastic modelling of gene regulation with a deterministic modelling of the mRNA and protein levels. We significantly adapted previous hybrid models [20,50] to provide the gene regulatory level with a firmer physical basis in order to model the stochasticity as rigorously as possible. To do so, we developed a hybridised model of deterministic DDEs and The Gillespie Algorithm such that both the next gene regulatory reaction to occur and the time that this reaction takes to occur are random (seeDiscussion,Methods,S1 Text).
InFig 2, we demonstrate that stochastic gene regulation can cause Her1/7 oscillations in
neighbouring cells to drift out of synchrony when the cells are independent [20]. We varied the dissociation parameter,koffHer1=7;between 1 and 1/6 min
-1, values being the same order of
mag-nitude as those selected in [50], and observed its effects on desynchronisation of independent Her1/7 oscillations (Fig 2B–2F). Within each individual cell, the mean amplitude and mean period of oscillation remains fairly constant, closely resembling the deterministic cases (S2A–
S2C Fig). Randomfluctuations around the mean period build up over time (S2D Fig) and
cause cells to drift out of synchrony from one another. Thus, the mean amplitude over all cells decaying to zero (black line,Fig 2) illustrates purely the desynchronisation of neighbouring cells.
We find that cells take at least 14 oscillations to lose synchrony forkoffHer1=7¼
1min-1(Fig
2B), 11–12 oscillations forkoffHer1=7 ¼
1=2min-1(Fig 2C), 6–7 oscillations fork
offHer1=7 ¼ 1=3
min-1(Fig 2D), 5–6 oscillations forkoffHer1=7 ¼
1=4min-1(Fig 2E) and 2–3 oscillations for
koffHer1=7 ¼
1=6min-1(Fig 2F). We observe that by decreasing the value of this parameter,
koffHer1=7;we increase the magnitude of noise in gene regulation and increase the speed at which
with variance proportional to1=k offHer1=7
2
:Hence, askoffHer1=7decreases in magnitude, the
vari-ability in timing of reaction events increases and this increases varivari-ability in Her1/7 popula-tions between cells. Greater inter-cellular variability in protein populapopula-tions between cells goes on to further increase the variability in timing of reaction events.
Despite the mean Her1 levels over all cells gradually decreasing to zero, the peaks and troughs of this inter-cellular mean still occur at the correct points in time, corresponding to a cellular period of oscillation of approximately 30 minutes. When cells oscillate independently from one another, individual cell oscillations continue to exhibit the correct amplitude for their location but, since cells are out of synchrony, a random mixture of cells in different phases of oscillation cycles is produced [17] as seen by the coloured lines of individual cells drifting out of phase with one another as time progresses inFig 2and in agreement with the dynamicin vivoanalysis of [56,57]. The result of this asynchrony is a salt and pepper expression ofher1
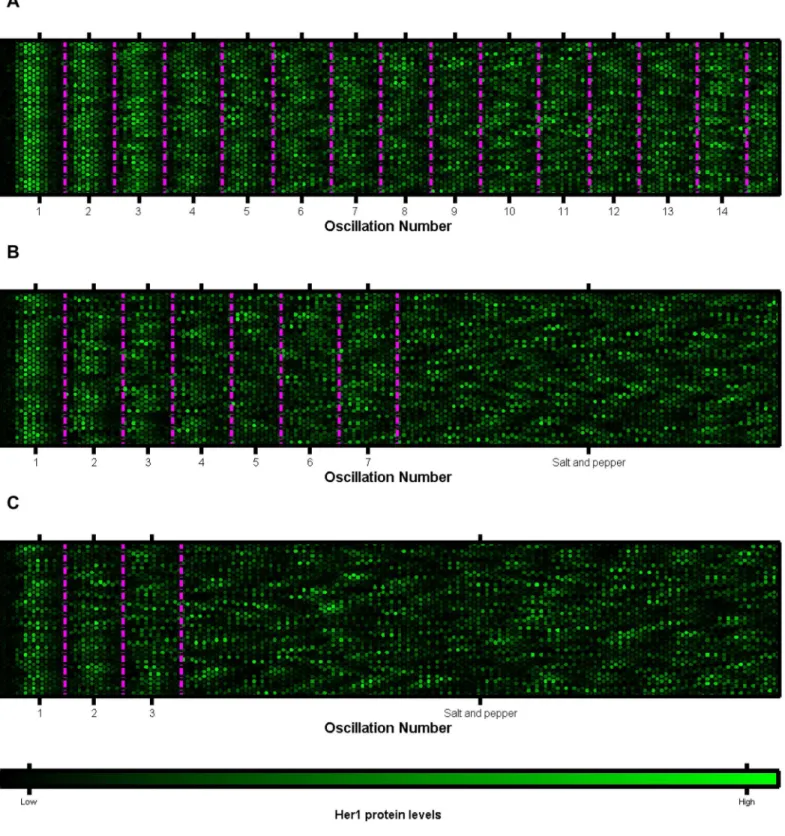
andher7in the PSM [20]. InS4 FigandS1–S3Movies we present the cells as a lattice, with each cell represented by a hexagon with the brightness reflecting the Her1 protein levels. The salt and pepper pattern is reached more quickly, the greater the level of stochasticity in gene regulation. By considering Her1 protein levels in 64 cells at five minute intervals (given by each double column of 32 hexagons) inFig 3, we illustrate how the desynchronisation of cell clocks can go on to determine the structure of future somites. As the cell clocks approach desynchro-nisation, the ordered structure of cells (highlighted by the magenta boundaries) becomes more disjointed, ultimately leading to somite boundaries becoming absent or irregular and the failure of somitogenesis.
Expression onset of the two
her1
gene copies differs by approximately
three minutes in a PSM cell
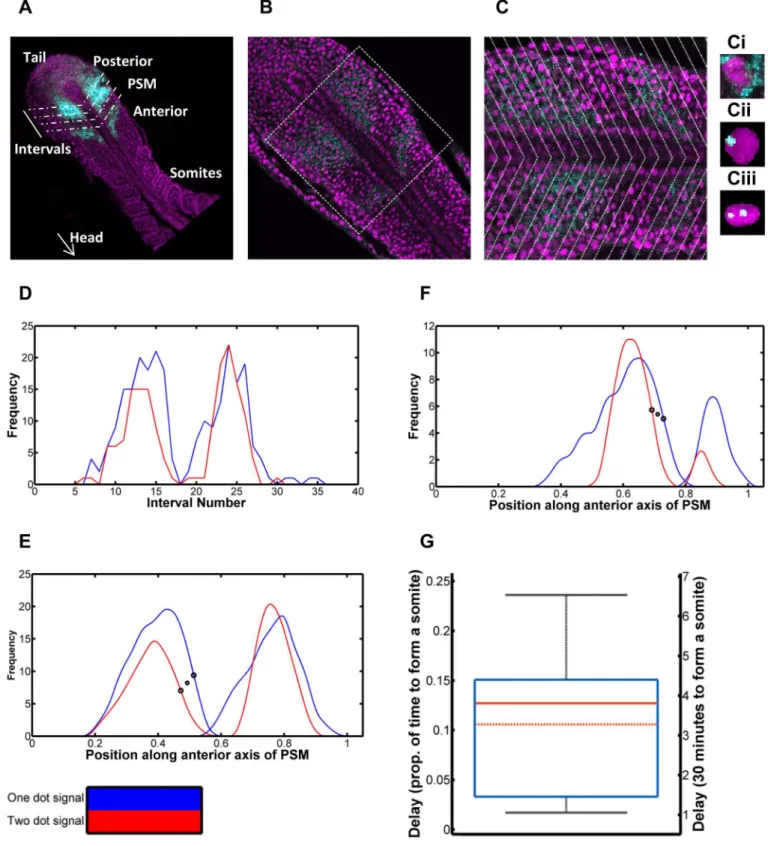
The analyses above imply that noisy gene regulation might drive the desynchronisation of oscillations in PSM cells in the zebrafish, in the absence of Notch. To support this view, we have performed in situ hybridisation to quantify the magnitude of this noise parameter.
During somitogenesis, oscillations of gene expression gradually reduce in frequency as cells move through the PSM, until they are halted completely in the anterior; the further anterior cells lie in the PSM, the more their phase is retarded (seeFig 4Afor a schematic of where this occurs in the embryo). As a consequence, phase differences of the clock are manifest as spatial offsets in the PSM, which can be used to calculate the timing of delay (see [18] for a more detailed description of the methodology). Thus, Giudicelli et al. [18] previously measured a 4 minute delay between the onset ofher1transcription and the appearance ofher1cytoplasmic mRNA.
The stochastic nature of gene regulation causes a temporal delay between the expression of the firsther1gene in a cell and the second. Stripes of cells expressing a single copy of the gene lie slightly anterior to cells expressing two copies of the gene [18].We carried out fluorescent in Fig 2. Modelling the effects of stochastic dissociation.2A: Reaction kinetics of Her1/7 proteins binding to the inhibitory sites onher1/7DNA to switch off
expression ofher1/7. 2B-F: The oscillating Her1 population levels for five independent cells in the system (blue, red, green, magenta and cyan) and overlaid mean population level of all 100 cells in the system (black) versus time for differingkoff
Her1=7values relating to the her1/7 inhibitory reaction described in 2A.
The mean population levels of all 100 cells primarily reflect how synchronous the oscillations of neighbouring cells are. Quantification methods for desynchronisation can be found in Methods andS3 Fig. 2B:koffHer1=7¼
1min-1. Cell clocks are still in synchrony after 14 oscillations. 2C:koffHer1=7¼
1=2min-1. Cell clocks desynchronise in 11–12 oscillations. 2D:koffHer1=7¼
1=3min-1. Cell clocks desynchronise in 6–7 oscillations. 2E:k offHer1=7¼
1=4min-1. Cell clocks desynchronise in 5–6 oscillations. 2F:koff
Her1=7¼
1=6min-1. Cell clocks desynchronise in 2–3 oscillations. 2G: Mean population levels of 100 cells for seven different simulations, forkoff
Her1=7¼
1=3min-1. There is variability in the embryos and cell clocks desynchronise in 6–8 oscillations. Thefigure demonstrates that noisy gene regulation can drive desynchronisation in Notch mutants.
Fig 3. Plots of multiple cells oscillatory clocks versus time.Each lattice is a single cell. Each five minute interval is marked by two columns of 32 cells. The mean phases of oscillation over all cells are marked by the magenta lines. The data is that ofFig 2. A:koff
Her1=7¼
1min-1. The cells remain in synchrony and no salt and pepper pattern is generated. B:koff
Her1=7¼
1=3min-1. The cells gradually drift out of synchrony to a salt and pepper pattern over 6–7 oscillation cycles. C:koffHer1=7¼
1=6min-1. Cell oscillations quickly desynchronise and tend to a salt and pepper pattern in 2–3 oscillation cycles. Thefigures demonstrate that, gradually, the number of cells oscillating in phase, within the magenta periods, decreases as noisy gene regulation causes the cell clocks to gradually
situ hybridisation (FISH) on wildtype embryos to detect sites of active transcription ofher1, as seen inFig 4B and 4C. The periodic stripes ofher1mRNA are visible in cyan, in both figures. Some cells contained only cytoplasmicher1mRNA molecules (Fig 4Ci) whilst others contained
her1transcripts in the course of synthesis; being evident as intense dots within the nucleus. The vast majority of transcripts within each cell numbered zero to two, consistent with the number of gene copies in G1 cells.
We therefore quantified the spatial distance between the stripes of cells expressing oneher1
gene copy (Fig 4Cii) and two gene copies (Fig 4Ciii). For each embryo, we carried out an image analysis in MATLAB (Methods,S3 TextandS5 Fig), dividing each 3D stack into intervals along the anteroposterior axis such that we could count the number of nuclei with one and two dots in each interval (Fig 4A and 4C) and quantify the frequency of cells expressing one gene copy and two gene copies versus spatial position (Fig 4D–4F). The temporal delay can be calcu-lated from this spatial displacement by considering how the clock rate changes with cell posi-tion and the way the tailbud extends caudally due to proliferaposi-tion (Methods and [18]).
Assuming that the time to make one somite is 30 minutes (see [68] for details of tempera-ture dependence of somitogenesis period) the mean delay is estimated to be 3.4 minutes (n = 11, 95% CI 2.5 minsμ4.3 mins). From the sample distribution (Fig 4G,S1andS2
Tables), we estimated the population statistics using non-parametric bootstrapping (see Meth-ods) due to the sample-size being small and the underlying probability distribution being unknown and possibly non-Gaussian. This provides us with a measure of the delay in expres-sion between the two gene copies in a cell, caused by noisy gene expresexpres-sion, of 3 minutes. This delay most likely corresponds to the stochastic de-repression of theher1gene (and in subse-quent initiation of transcription) and provides us an estimate for the magnitude of noise in this gene regulation.
Modelling the measured stochastic delay predicts the loss of clock
synchrony in 6
–
8 clock cycles in the absence of Notch signalling
The measured 3 minute delay corresponds to the dissociation half-life of the inhibitory protein from theher1/7DNAðkoffHer1=7Þof 1/3 min
-1.Fig 2Dshows that, whenk
offHer1=7 ¼
1=3min-1, the
cells drift out of synchrony after approximately 6–8 oscillations. There is, of course, also vari-ability in rate of desynchronisation between different embryos, due to stochastic gene regula-tion (Fig 2G). Although desynchronisation is more rapid in some simulations, the general trend is that it takes 6–8 oscillations before cells are no longer in synchrony with one another. Strikingly, this is in agreement with experimental data [17,48]. Consequently, the measured dissociation rate of Her1/7 from their binding sites onher1/7DNA is sufficient to explain the
in vivorate of clock desynchronisation, suggesting that the stochasticity ofher1/7de-repression
is, most likely, the key noise parameter that drives loss of synchrony in the absence of inter-cel-lular Notch signalling.
Notch signalling can override stochastic effects and force cells into
synchrony
In the posterior of the PSM, the major function of Notch is to keep the oscillations of neigh-bouring cells in synchrony [17,18,20,48,57,69]. Theher1/7negative feedback loop, in which
her1/7products inhibit their own expression, also regulates the expression ofdeltaC, a Notch
drift out of synchrony from one another. The result is a salt and pepper pattern. As this salt and pepper pattern is reached, somites will not form correctly. (Compare to the wildtype case ofFig 5E.)
Fig 4. Quantification of delay in expression betweenher1gene copies in a PSM cell.4A: Schematic of quantification. Oscillatory gene expression in the posterior of the PSM is shown in cyan. The PSM is divided into intervals in order to quantify this gene expression, spatially. 4B: A single slice of a zebrafish embryo with nuclei in magenta andher1mRNA in cyan. 4C: The zoomed in square of 4B to closer demonstrate the cytoplasmicher1mRNA molecules and
ligand, triggering oscillations of this protein and thereby causing periodic Notch activation in neighbouring cells. This, in turn, stimulates expression ofher1andher7. This feedback mecha-nism, first proposed by Lewis [20], explains how cells are able to provide information to their neighbours such that they can adjust their internal clocks (Fig 5Awhere the blue section refers to the intra-cellularher1/7circuit whilst the green section refers to the inter-cellular Notch sig-nalling component).
To investigate whether oscillating gene expression is indeed robust to the effects of stochastic gene regulation, due to the coupling effects that Notch provides, we added Notch signalling to our mathematical model. We modelled the reactions between Notch intra-cellular domain (NICD) andher1/7genes stochastically, however, the inter-cellular signalling was modelled purely deterministically.deltamRNA and protein, and NICD were incorporated into the model with delay again manifesting in transcription and translation ofdeltaand in activation of Notch. It is believed that NICD and Her1/7 compete [48] to bind to the regulatory DNA ofher1/7in order to maintain synchrony between cells (seeFig 5B) and it is here where stochastic behaviour again comes in to play. For instance, if Her1/7 binds to the regulatory site ofher1/7, this would inhibit the expression ofher1/7. However, if NICD is already bound to the regulatory site then this prevents the inhibition from occurring. We considered a lattice of 64 cells with periodic boundary conditions. The dissociation rate of Her1/7 from its site ofher1/7DNA,koffHer1=7;was
selected as 1/3 min-1. At initialisation, the number of gene copies bound to Her1/7 and NICD and number of mRNA and proteins in each cell were determined randomly in order to demon-strate the effects of Notch signalling on desynchronised neighbouring cell oscillations.
Our mathematical model demonstrates that the inclusion of Notch signalling can override stochastic effects that would otherwise cause loss of clock synchrony (see the uniform expres-sion of cells inS4 Movie).Fig 5Cshows the Her1 oscillations for five Notch-competent cells (coloured lines) with the mean Her1 levels (black line). The five cells show similar oscillation periods and phases (although with variable amplitude), showing that Notch signalling imposes synchrony on the population (S6 Fig).Fig 5Dshows the normalised mean levels of each popu-lation versus time to demonstrate how each popupopu-lation oscilpopu-lation is out of phase from the oth-ers. Due to the delays in the system, levels of Notch are almost totally out of phase with levels of Her1/7, meaning that when Her1/7 levels are low, levels of Notch are high andher1/7gene activation is more likely and vice versa.Fig 5Eillustrates that, with the inclusion of Notch sig-nalling, the boundaries of future somites will be well defined. Further model validation at the gene regulatory level can be found inS4 Text.
Discussion
In the absence of Notch signalling, the clocks of neighbouring cells desynchronise in 5–8 clock cycles. We have provided a possible mechanism for the source of this noise: the stochastic
her1mRNA waves, and the frequency of nuclei with oneher1transcript in the course of synthesis and those with two is quantified per interval. 4Ci: A cell containing cytoplasmicher1mRNA molecules. 4Cii: A cell with oneher1gene copy expressed. 4Ciii: A cell with twoher1gene copies expressed. 4D: Plot of frequency of nuclei with one dot (blue) and frequency with two dots (red) per interval. The two dot signal is delayed behind the one dot signal. 4E: The signals smoothed and the interval scale transformed to distance over the anterior axis (scaled from zero to one). The large black circles demonstrate the inflection points used to calculate the delay. This specific delay is selected as the increase in frequency of activeher1genes is a reflection of the repressing Her1/7 protein dissociating from the gene. The smaller symbol, between the two circles, gives the x coordinate used for further calculation in each case. 4F: Further example of smoothed dot count signals for an additional embryo. 4G: Box and whisker plot of delay between one and two dot signals, as a proportion of time to make one somite (left axis) and in minutes assuming the time to make one somite is thirty minutes (right axis). The minimum and maximum are given by the whiskers, the lower quartile and upper quartile by the box. The solid red line gives the median and the dot-dash red line gives the mean. The predicted delay in expression between the twoher1gene copies in a cell is three minutes. The mathematical model predicts cells will desynchronise in 6–8 oscillations
when inserting the dissociation rate,koffHer1=7¼
1=3min-1, corresponding to this delay.
nature of the binding of Her1/7 protein to inhibitory sites onher1/7DNA. The stochastic nature of dissociation of Her1/7 from its target sites leads to a temporal delay between the expression of the firsther1gene copy in a cell and the second. We used in situ hybridisation to quantify this delay and measured a delay of approximately three minutes. The corresponding dissociation rate, 1/3 min-1, inserted into our mathematical model predicts that the oscillations of Her1/7 desynchronise in 6–8 oscillations, in broad agreement with the observed effects of losing Notch-mediated synchronisation. Our results further validate the ideas and predictions made in Lewis. 2003 [20] and later publications that mathematically describe the oscillatory mechanism ofher1/7and Notch signalling’s role in keeping neighbouring cell clocks in syn-chrony. In addition, it was suggested that stochastic gene regulation ofher1/7was a likely driver of desynchronisation in the absence of Notch signalling [20,49,50] and the results herein provide robust quantification of such arguments.
Delay in
her1
gene expression is a consequence of stochasticity in the
repressor/DNA dissociation
In a single cell, the twoher1genes are in an identical nuclear environment, exposed to the same repressor concentrations. Therefore, the difference in timing in expression between the firsther1gene copy and the second, of approximately 3 minutes, is most likely a consequence of the stochastic dissociation of Her1/7 repressor proteins from theher1target genes (and sub-sequent noise in initiation of transcription). Gene expression is repressed in the protein bound state and therefore, the key noise parameter, the half-life for dissociation of the inhibitory pro-tein from the DNA, can be estimated from the delay in expression between the two gene copies. This half-life for dissociation reflects the mean time taken for the protein to become dissociated from the gene and the inhibited gene to begin expression again. InFig 4, the number ofher1
transcripts in the course of synthesis per cell is a reflection of the number of genes without repressors bound. Further stochasticity in gene regulation will also be present in, for example, the recruitment of the core transcriptional machinery and this is currently not explicitly included in our mathematical model (its contribution to delay in expression between gene cop-ies is effectively incorporated into the magnitude of our dissociation rate,koffHer1=7Þ:InS7 Figwe
compare the delay inher1gene expression between our experimental and simulated data. We note that although the mathematical model has captured the average delay very well, it intro-duces far less variability in delay than in our experimental data. Although the increased varia-tion in the experimental data will in part be caused by experimental measurement, we note that this could also be a consequence of further stochasticity in transcription initiation. The intro-duction of inter-cellular variability does not significantly alter the distributions of delay, giving Fig 5. Modelling the effects of Notch signalling on the synchrony of neighbouring cell oscillations.5A: Notch signalling network between
neighbouring cells. The light blue section corresponds to the intra-cellularher1/7feedback loop ofFig 1A. The green section corresponds to Notch inter-cellular signalling. Her1/7 protein inhibits expression ofdeltain addition toher1/7. Transcription and translation ofdeltaoccurs with respective delayst
mdand t
pd:Delta activates Notch in the neighbouring cell and NICD is produced with delay,tpN:When Notch binds to theher1/7genes this leaves them in an active
state, influencing theher1/7intra-cellular feedback loop. 5B: Competitive binding reaction kinetics of Her1/7 and Notch proteins to the sites onher1/7DNA. When theher1/7gene is free or bound to NICD then the gene is active. When Her1/7 binds to theher1/7gene then expression of the gene is inhibited. It is these reaction kinetics that we model with a modified Gillespie Algorithm. 5C: Plot of oscillating Her1 levels versus time when Notch signalling has been incorporated into the model. The coloured lines correspond tofive randomly selected individual cells; the black line corresponds to the mean of all 64 cells. The cells oscillate in synchrony. 5D: The normalised mean population levels ofher1mRNA,her7mRNA, Her1 protein, Her7 protein,deltamRNA, Delta protein and Notch protein demonstrating the phase of each population. Notch is almost totally out of phase with Her1/7 so will be high when Her1/7 is low and vice versa. 5E:Plots of multiple cells oscillatory clocks versus time (compare toFig 3). Each lattice is a single cell. Eachfive minute interval is marked by two columns of 32 cells. The mean phases of oscillation over all cells are marked by the magenta lines. The cells remain in synchrony throughout and generate well defined somites. The modelling demonstrates that Notch signalling is able to override the effects of stochastic gene regulation and keep neighbouring cell clocks oscillating in synchrony.
further weight to the argument that delay in gene expression is likely to be a consequence of stochasticity in repressor/DNA dissociation.
Stochasticity in gene regulation dominates over stochasticity in mRNA
and protein reactions, due to the low numbers of molecules involved
Stochastic modelling of chemical reaction kinetics is generally carried out either using the chemical master equation [70–72] the solution of which provides the time-evolving probability distribution of molecular populations or The Gillespie Algorithm, which makes‘exact’ numeri-cal numeri-calculations, within the framework of stochastic formulation using a Monte Carlo proce-dure, to simulate the time evolution of the system [73,74]. For macroscopic processes, by making use of The Central Limit Theorem, the solution to the master equation can be approxi-mated by a multivariate Gaussian distribution [59–61]. With such solutions, for a system of sizeN, the ratio of the standard deviation to the expected value will be of orderN−1/2[61]. Thus, as the size of the system increases, the relative magnitude of variability decreases. Kurtz (1972) demonstrates that if the deterministic equations have a unique stable solution then the deterministic model will be the infinite system-size limit of the stochastic model [58]. There-fore, the smaller the populations, the more dominant noise will become. In a single cell, sto-chasticity in chemical reaction kinetics will be dominant at the gene regulatory level due to there being only two gene copies per cell ofher1/7and large numbers of mRNA and protein.
The Notch signalling pathway must be robust to further stochastic gene
regulatory effects in order to keep neighbouring cells oscillating in
synchrony
We have demonstrated that Notch signalling is able to override stochastic effects in the gene regulatory system and keep the oscillations of neighbouring cells in synchrony with one another. Within the inter-cellular model, we wanted to investigate the effects of noisy gene reg-ulation ofher1/7on desynchronisation of neighbouring cell clocks in the absence of Notch sig-nalling and hence, this is the only gene regulation that we modelled stochastically. Noise will also be present in for example, stochastic gene regulation ofdelta. An analysis of noise else-where in the Notch signalling pathway would further inform us on how noise within the inter-cellular Notch signalling pathway affected its ability to override stochasticity in the transcrip-tion initiatranscrip-tion ofher1/7and keep neighbouring cells in synchrony. Such analysis may provide further avenues for research into the effects of stochastic gene regulation in this system.
The mathematical model incorporated deterministic delay differential
equations with the stochastic Gillespie Algorithm
In order to investigate the effects of various sources of noise on the system, we adapted the mathematical model of [50]. Firstly, we adapted the model such that the rate and delay parame-ters were distributed randomly. This enabled us to rule out inter-cellular variability as being the driver of desynchronisation. Secondly, in order to investigate the effects of stochastic gene regulation on the system, stochastic gene regulation was modelled more realistically by hybri-dising delay differential equations modelling mRNA and protein with The Gillespie Algorithm modelling the stochastic gene regulation ofher1/7.
Previous hybrid models, incorporating stochastic gene regulation and deterministic DDEs, included the stochasticity in a format in which each stochastic reaction will occur over a fixed timestep [20,50]. Thus, the population levels of active genes can change only at each timestep. Such methods have clearly produced valuable results however, in the words of Gillespie, such a
method‘becomes exact in the limit of the timestep tending to zero, but unfortunately the effi-ciency of the procedure becomes nil in that same limit’. Therefore, modelling the gene regulation with a fixed timestep will average out some of the stochastic effects and result in behaviour inter-mediate between deterministic and stochastic models. Since we were carrying out an investiga-tion into the effects of noise within our system, we desired to model it as rigorously as possible and so, in our hybrid model, we turned to incorporating the stochasticity by hybridising DDEs with The Gillespie Algorithm. Incorporating the Gillespie Algorithm, for modelling stochastic gene regulation, results in both the next reaction to occur and the time that this reaction takes to occur being made random making the stochastic element in our hybrid model truly random. Both The Gillespie Algorithm and chemical master equation have been previously adapted to directly incorporate delay [63,65,66,75]. However, hybridisations of The Gillespie Algorithm with DDEs appear rare, with this being possibly the first such example (seeS1 Text).
The system is robust to small evolutionary changes in the magnitude of
stochastic effects
Finally, we investigated how robust the inter-cellular Notch synchronisation mechanism is to alterations in the dissociation rate of Her1/7 from their target promoters. This is of interest becauseher1/7are important for many biological processes in addition to the generation of somites and, therefore, their biochemical properties may be subject to diverse evolutionary pressures. Further, it is known that the somite clock has different periods in different organ-isms. We introduced greater magnitudes of stochastic effects in gene regulation and observed how well the inter-cellular coupling system coped. A modest mutation in the dissociation rates does not make the system fall apart: the system is tolerant to a three or four fold increase in the levels of stochasticity, with neighbouring cells still oscillating in synchrony (Fig 6A and 6B). Increasing the stochastic effects further, causes neighbouring cells to desynchronise as the inter-cellular Notch signalling is not strong enough to override stochastic effects ofher1/7gene regulation (Fig 6C).
In these limits of increasing stochasticity, other changes in the system are required to rescue synchronous oscillation. The system is able to combat a tenfold increase in stochastic effects and remain in synchrony by increasing the transcription, translation and Notch activation delays threefold (Fig 6D). The period of oscillation is roughly three times longer than that seen in wildtype and hence we would expect the formed somites would also be around three times larger for the same axial elongation rate [76]. Thus, we would expect a reduction in somite number from 31 to around 10, resulting in a number more comparable to frogs.
To conclude, here we present an integrated DDE-Gillespie Algorithm model of oscillating gene expression during somitogenesis. This allows us to determine that the dissociation of the
her1/7gene repressors is the most likely source of noise in the somite clock that Notch
signal-ling antagonises.
Methods
Ethics Statement
Animal experiments were approved by the CRUK London Research Institute Ethical Review Committee (ref. JLE-17/06) and the UK Home Office (Project Licence 80/2081 held by J.L.).
Fish stocks, mutant and transgenic fish lines
Fluorescent
in situ
Hybridisation and Laser Scanning Microscopy
Zebrafish embryos were paraformaldyde-fixed at 14 hpf and subjected to fluorescentin situhybridisation using a fluorescein- labelled RNA probe againsther1[77] according to standard protocols. Bound fluorescein-labelled probe was detected using sheep peroxidase-conjugated anti-fluorescein antibody (Perkin Elmer, 1/125) and the TSA Plus Fluorescein system (Perkin Elmer). Specimens were counterstained with DAPI, flat mounted in SlowFade Gold (Invitro-gen), and the relevant dorsal to ventral sections of the PSM were imaged with a Zeiss LSM700 Fig 6. Modelling Notch signalling’s ability to combat increasing levels of stochasticity.In each case we plot the mean Her1 protein levels for 64 cells to illustrate how synchronous the clock oscillations are. Notch signalling is active in each case. 6A: Dissociation parameter,koff
Her1=7¼
1=6min-1. Notch signalling can cope with double the magnitude of stochasticity. 6B: Dissociation parameter,koff
Her1=7¼
1=15min-1. Notch signalling begins to struggle to keep neighbouring cells oscillating in synchrony. 6C: Dissociation parameter,koffHer1=7¼
1=30min-1. Notch signalling is not strong enough to counteract the levels of stochasticity inher1/7gene regulation. Neighbouring cells quickly desynchronise oscillation. 6D: Dissociation parameter,koffHer1=7¼
1=30min-1while delay (transcription and translation delays and delay in activation of Notch) has been increased threefold. Neighbouring cells once again oscillate in synchrony, but with longer period. As the levels of stochasticity inher1/7gene regulation increase, Notch signalling is no longer able to override stochastic effects and keep neighbouring cells oscillating in synchrony. To rescue synchrony, further changes to the system are required, for example, by increasing the magnitude of delay.
doi:10.1371/journal.pcbi.1004459.g006
confocal microscope at 40x magnification with Nyquist sampling. For the quantification of the
her1dots representing active transcription of one or bothher1genes within a cell, stacks of images were generated.
Quantification of Desynchronisation
The plots ofFig 2provide the mean Her1 protein levels over 100 cells in addition to the protein levels for five randomly selected cells. If we consider the sample distribution of Her1 protein levels for all 100 cells we can analyse how the distribution changes over time forkoffHer1=7 ¼
1=2
min-1(S5 Movie). The sample distribution oscillates between differing shapes, depending on
whether the oscillations are in a trough, peak or somewhere in between the two. In a trough the distribution is heavily localised around low protein levels (S3B) whilst at a peak the distribution is spread over a much larger range of protein levels (S3C). When moving from a peak to trough or vice versa, the shape of distribution is somewhere between the two (S3D and S3E). However, as the oscillations desynchronise, peak and trough distributions become almost identical (S3F
and S3G).
To determine when the cells have desynchronised we compare the sample distributions of Her1 protein levels half a period apart (i.e. we compare peak to trough). In the case of our sys-tem, this corresponds to a timeframe of approximately 15–16 minutes. We thus compare the sample distribution at a point to the distribution 16 minutes later (e.g. A1 versus A2, B1 versus
B2,S3A–S3G Fig). To test for differences in distribution we use a two sample
Kolmogorov-Smirnov test. The p-values generated can then be plotted versus time (S3H Fig).
When comparing a peak to a trough (A1 versus A2) the p-value generated is very low, sug-gesting that the two distributions are different. When comparing the region going from trough to peak (B1) to peak to trough (B2) the results are not statistically significant, as shown by the oscillatory peaks of higher p-values (S3H Fig). However, as the cells desynchronise, the distri-butions of peak and trough become almost indistinguishable (C1 versus C2) and therefore, the p-value becomes large over all phases of the oscillatory cycle (410 minutes plus,S3H Fig).
We define the cells as being desynchronised and in a salt and pepper pattern after the first instance in which the p-value for no part of the oscillatory cycle drops below 0.1 (S3H Fig, dot dash magenta line). In this instance, the p-value comparing peak and trough must then be greater than 0.1 and the peak distributions have become indistinguishable to the trough distri-butions. With this methodology, we determine that cells do not desynchronise forkoffHer1=7¼
1
min-1and are desynchronised by 406 minutes (13thoscillation) forkoffHer1=7¼
1=2min-1, 259
minutes (8thoscillation) forkoffHer1=7 ¼
1=3min-1, 254 minutes (7thoscillation) fork offHer1=7¼
1=4min-1and 157 minutes (4thoscillation) fork offHer1=7¼
1=6min-1. The last synchronous
cycles of oscillation are hence defined to be somewhere between the two oscillations before these salt and pepper regions. For rate and delay constants ofFig 1, cells do not desynchronise for transcription and translation rates, and are desynchronised in 635 minutes for degradation rate, 370 minutes for transcription delay, 451 minutes for transcription delays distributed with the Generalized Pareto distribution, 652 minutes for translation delay and do not desynchro-nise for number of Hes6 molecules.
Image Processing of FISH Stacks
boundary were removed, whilst nuclei in which it was deemed that too great a proportion of the nucleus fell outside the stack boundary were also removed, as seen inS5C and S5D Fig. The dots (her1mRNA) were then thresholded within each nucleus such that we could count the total number of dots within each individual nucleus. The nuclei that we analysed alongside the dots signal, expressed in these nuclei, are shown inS5E Fig.
The embryo was divided into 40 intervals, from the posterior of the PSM to the anterior
(S5F Fig). By dividing the embryo image into intervals we can thus map the spatial occurrence
of nuclei with oneher1gene expressed and nuclei with twoher1genes expressed, as a function of distance along the anteroposterior axis. The stripes of gene expression on either side of the notochord occur at an angle to it. The chevrons of the intervals reflect the gradient of these stripes on either side of the notochord. InS5G Figwe have quantified the number of nuclei with one dot (blue signal) and the number of nuclei with two dots (red signal) for each interval in the embryo stack. Smoothing the signals ofS5G Figand transforming the spatial scale from interval number to position along the anterior axis of the PSM results inS5H Fig. The scaling is such that the tail end of the notochord occurs at zero and the anterior end of the PSM occurs at one.
To validate the automatic dot counting, we compared our results to a manual quantification. We manually counted the number of dots for the innermost slice of six of the embryos and compared the results to the number of dots counted in that slice by the automatic three dimen-sional quantification. InS5I Figwe compare the two for this embryo. Automatic results are in blue (one dot) and red (two dots) and manual results are in cyan (one dot) and magenta (two dots). The broad agreement suggests that our automatic quantification is accurate. A much more in depth description of the image processing procedure can be found inS3 Text.
Methodology of Quantification of Delay in Expression Between Gene
Copies
The length of one formed somite, which can be measured in each embryo, differs slightly from embryo to embryo and is given here byS0. The time,T0, to form one somite is determined by
the frequency of oscillation ofher1gene expression in the posterior of the PSM and is approxi-mately 30 minutes for zebrafish at 28°C. Consider a position,x, along the anteroposterior axis. The positionx= 0 corresponds to the tail end of the notochord whilst the positionx=L corre-sponds to the anterior end of the PSM. Letv(x) give the speed of forward movement of cells along the anteroposterior axis relative to the tail end of the notochord. We approximated this by linearly interpolating between the known results ofv(0) = 0 andv(L) = 1 such that
v(x) =x/L. LetS(x) give the local spatial wavelength at position,x, measured along the trajec-tory of cells. Herexis the midpoint between oneher1peak and the next or oneher1trough and the next. For a spatial delay,δx, centred at positionxthe temporal delay,δt, can be
calcu-lated such that
dt¼T0 dx
SðxÞ vðxÞS0
:
Distances from different samples can be combined by scaling distances relative to the length of the PSM. Reading the oscillations from anterior to posterior (right to left inFig 4E and 4F) the increase in frequency of active genes is a reflection of the repressing Her protein dissociat-ing from the gene and hence we quantify the spatial delay,δx, between the wave of cells with
oneher1mRNA molecule and cells with two on this increase. This gives us information specifi-cally regarding the dissociation rate. This delay is best calculated using the inflection point of each wave due to each wave being of different scale and the inflection point being invariant to
scaling. The inflection points have been recorded onFig 4E and 4FandS5H Figwith black cir-cles and the position along the anteroposterior axis,x, used for calculation, given by the black cross at the mid-point between the two inflection points. The decrease in frequency of active genes (again readingFig 4E and 4Ffrom right to left) is a reflection of the repressing Her pro-tein associating to the gene. There is a greater degree of stochasticity here because some genes will be free and just have to associate to Her to become repressed whilst other active genes will be bound to Notch and will first have to dissociate from Notch before associating to Her. All of these events are heavily stochastic.
Bootstrap Analysis of Sample of Experimental Delay Data
Non-parametric bootstrapping was carried out on the sample of thirteen embryos from which we quantified the delay. We drew samples of size 13, from the original sample, ten thousand times. For each of these redrawn samples, we recorded the mean and standard deviation. Esti-mates of the population mean (0.1126T0) and standard deviation (0.0649T0) were found by
calculating the means of these statistics, over all samples. The population mean is larger than the sample mean due to the non-symmetric sample distribution. 95% confidence intervals were found by calculating the 5thand 95thpercentiles of the sample of means (0.0820 T0μ
0.1427 T0). Due to The Central Limit Theorem, the resulting distributions of population mean
and standard deviation are approximately Gaussian.
The Hybrid Stochastic Delay Deterministic Model
The modelling of Notch signalling incorporatesher1/7genes,her1/7anddeltamRNA, Her1/7 and Delta proteins and NICD. A hexagonal lattice with periodic boundary conditions is gener-ated such that each cell has six neighbouring cells. Since the signalling is via lateral inhibition, it is these six neighbours that will influence each single cell.her1/7gene regulation is modelled stochastically whilsther1/7anddeltamRNA, Her1/7, Delta and Notch proteins are modelled deterministically. The modelling of proteins toher1/7is whereby NICD binds as a homodimer toher1/7 and Her1 also binds toher1/7 as a homodimer. Her7 binds toher1/7 as a pair of het-erodimers withhes6 [50]. Delay in the system is incorporated via DDEs. This delay includes
her1/7anddeltatranscription delays, Her1/7 and Delta translation delays and the delay in
acti-vation of Notch.
A detailed description of the system of reactions and DDEs in addition to how the algorithm is implemented in MATLAB can be found inS1 Text.
Briefly, for this simplified system, the algorithm works as follows:
Step 0) Initialisation. The number of cells in the system is defined and theher1/7mRNA, Her1/7 proteins,deltamRNA, Delta protein and Notch protein molecule numbers within each cell are initialised either randomly or deterministically. Each cell has twoher1and two
her7gene copies. The number of genes bound to Her1/7 or NICD or unbound is initialised either randomly or deterministically. At initialisation time,t0= 0. Each cell’s neighbours on
the hexagonal lattice are recorded.
of reaction is given byTiand the time the reaction occurs byti=ti−1+Ti. Only one single reaction, over all cells will occur in this time interval.
Step 2) The numbers of Her1/7 proteins andher1/7mRNA molecules are assumed to be so large, relative to the number of gene copies involved, that many reactions involving solely protein and mRNA will occur between subsequent stochastic gene regulatory reactions. Therefore, we deterministically evolve the system for protein and mRNA levels by solving DDEs for these populations. Theher1/7 gene levels are fixed over this time interval. The production ofher1/7is a function of the number ofher1/7genes switched on. NICD protein levels are determined as a function of neighbouring cells’Delta levels.
The reaction propensities required to determine the time,ti, and type of the next stochastic reaction are functions of the Her1/7 and NICD populations. Since the population levels of these proteins continuously vary between subsequent stochastic reactions, these reaction propensities also continuously vary. Thus, the time that each reaction takes to occur,Ti, and which reaction occurs based on the random numbers generated in Step (1) must be calcu-lated as in the direct method, that incorporates delay, of [75] rather than the standard method of [74]. We thus solve the DDEs over the time period [ti−1,1) until we have
deter-mined the time,ti, of the next reaction and terminate solution to the DDEs at this time.
Step 3) Having deduced the time period of the next reaction, we determine which reaction occurs using the propensities at the relevant time point as in [75] and update the number of
her1/7genes bound to Her1/7 and NICD proteins for all cells. We then return to Step (1).
Supporting Information
S1 Text. The mathematical model(DOCX)
S2 Text. Parameter Values
(DOCX)
S3 Text. Extended Description of Image Processing of 3D stacks from FISH Analysis
(DOCX)
S4 Text. Model Validation: The Gene Regulatory Level
(DOCX)
S1 Fig. Quantifying the effects of inter-cellular variability in rate constants on cells’ oscilla-tion amplitude and period.Scatter plots of Her1 oscillation amplitude and period versus time, with colour denoting three different cells selected fromFig 1, to demonstrate variability. S1A: Variability in transcription rate. S1B: Variability in translation rate. S1C: Variability in degra-dation rate. S1D: Variability in transcription delay. This has the largest effect on period of oscil-lation. S1E: Variability in translation delay. S1F: Variability in cellular numbers of Hes6 molecules. The plots demonstrate that the amplitude and period of each cell’s oscillation smoothly tend to constants, dependent on the magnitude of the rate/delay/Hes6 constant in that single cell. Once the amplitude/period has reached these constants, independent of other cells, the amplitude and period of that cell will remain fixed for all time. Inter-cellular variabil-ity in transcription rate and delay dominate variabilvariabil-ity in amplitude; inter-cellular variabilvariabil-ity in transcription delay dominates variability in period.
(TIF)
S2 Fig. Quantifying the effects of stochasticher1/7gene regulation on cells’oscillation
amplitude and period.Scatter plots of Her1 oscillation amplitude and period versus time, with colour denoting three different cells randomly selected fromFig 2. S2A:koffHer1=7¼
1min-1. S2B:
koffHer1=7¼
1=3min-1. S2C:k
offHer1=7¼
1=6min-1. In all three cases the mean amplitude and
period for each cell remain fairly constant over time. However, there exist randomfluctuations, independent of oscillation stage, around these mean levels. S2D: Plot of standard deviation (20 cells) of phase versus oscillation number forkoffHer1=7 ¼
1min-1(blue),k
offHer1=7 ¼
1=3min-1(red)
andkoff Her1=7 ¼
1=6min-1(green). Variability in phase builds up over time. This is slowest for
koffHer1=7¼
1min-1and fastest fork
offHer1=7¼
1=6min-1. Randomfluctuations in period of
oscilla-tion build up over time, increasing variaoscilla-tion in phase of oscillaoscilla-tion, causing neighbouring cells to desynchronise. This increase in variation is more rapid the greater the level of stochasticity in gene regulation.
(TIF)
S3 Fig. Quantifying the point in time at which neighbouring cells desynchronise.S3A: Mean Her1 protein levels for 100 cells withkoffHer1=7 ¼
1=2min-1(and blocked Notch
signal-ling) as inFig 2C. S3B-S3G: Histograms of Her1 protein levels at time points indicated by A1, A2, B1, B2, C1, C2 respectively. When in synchrony, the distribution at low Her1 protein levels (S3B) is noticeably different from the distribution at peak Her1 protein levels (S3C). The differ-ence in distribution when moving from trough to peak Her1 levels (S3D) is not noticeably dif-ferent to the distribution when moving from peak to trough Her1 protein levels (S3E). As the cells desynchronise, the distributions become indistinguishable (S3F-G). S3H: Plot of p-value versus time for Kolmogorov-Smirnov test comparing distribution of Her1 protein levels to dis-tribution of Her1 protein levels 16 minutes later (approximately half an oscillatory period). For early time, the local minima correspond to p-values comparing trough (e.g. A1) to peak (e.g. A2) and the local maxima to comparing a region between trough and peak (B1) to a region between peak and trough (B2). As the cells desynchronise the p-value becomes large (compare distribution at C1 to at C2). We define the cells to have desynchronised from thefirst point in time when there is not a significant difference (p-value>0.1) between peak distribution and trough distribution (406 minutes in this case).
(TIF)
S4 Fig. Comparison of timeslices of cells’Her1 protein levels for varying levels of stochastic gene regulation.Using data ofFig 2, we compare low levels of stochasticity (A-C) and high levels of stochasticity (D-F) in gene expression (D-F). Initial conditions are identical in all cells. The time points are selected to represent equivalent points in the oscillatory cycle. A (51 mins) and D (53 mins): peaks of the first oscillations. Cells for bothkoffHer1=7values are in synchrony. B
(132 mins)and E (139 mins): troughs of the third oscillations.koffHer1=7¼
1=6min-1is
desyn-chronising faster thankoff Her1=7¼
1min-1. C (212 mins) and F (220 mins): peak of the sixth
oscillations. The cells forkoffHer1=7¼
1min-1are still in synchrony whilst the cells fork
offHer1=7¼ 1=6min-1demonstrate a salt and pepper pattern. The cell clocks drift out of synchrony very
slowly forkoffHer1=7¼
1min-1, the cells do not desynchronise over this time interval and the salt
and pepper pattern ofher1expression is not reached. The cell clocks drift out of synchrony very quickly forkoffHer1=7¼
1=6min-1, the cells have desynchronised well before the sixth
oscil-lation and a salt and pepper pattern is apparent. (Compare to the wildtype case ofS6A–S6C Fig).