Nat. Hazards Earth Syst. Sci., 11, 3307–3318, 2011 www.nat-hazards-earth-syst-sci.net/11/3307/2011/ doi:10.5194/nhess-11-3307-2011
© Author(s) 2011. CC Attribution 3.0 License.
Natural Hazards
and Earth
System Sciences
The December 2008 Crammont rock avalanche, Mont Blanc massif
area, Italy
P. Deline1, W. Alberto2, M. Broccolato3, O. Hungr4, J. Noetzli5, L. Ravanel1, and A. Tamburini2
1EDYTEM Lab, Universit´e de Savoie, CNRS, Le Bourget-du-Lac, France 2Imageo S.r.l., Torino, Italy
3Servizio Geologico della Regione Autonoma Valle d’Aosta, Quart, Italy
4Department of Earth and Ocean Sciences, University of British Columbia, Vancouver, Canada 5Glaciology, Geomorphodynamics & Geochronology, University of Zurich, Zurich, Switzerland
Received: 28 April 2011 – Revised: 30 September 2011 – Accepted: 26 October 2011 – Published: 15 December 2011
Abstract. We describe a 0.5 Mm3 rock avalanche that oc-curred in 2008 in the western Alps and discuss possible roles of controlling factors in the context of current cli-mate change. The source is located between 2410 m and 2653 m a.s.l. on Mont Crammont and is controlled by a densely fractured rock structure. The main part of the col-lapsed rock mass deposited at the foot of the rock wall. A smaller part travelled much farther, reaching horizontal and vertical travel distances of 3050 m and 1560 m, respectively. The mobility of the rock mass was enhanced by channeliza-tion and snow. The rock-avalanche volume was calculated by comparison of pre- and post-event DTMs, and geomechan-ical characterization of the detachment zone was extracted from LiDAR point cloud processing. Back analysis of the rock-avalanche runout suggests a two stage event.
There was no previous rock avalanche activity from the Mont Crammont ridge during the Holocene. The 2008 rock avalanche may have resulted from permafrost degradation in the steep rock wall, as suggested by seepage water in the scar after the collapse in spite of negative air temperatures, and modelling of rock temperatures that indicate warm per-mafrost (T >−2◦C).
1 Introduction
Rockfall is a typical hazard in high mountain areas due to steep slopes, high relief, intense rock fracturing, seismic-ity, paraglacial control, periglacial processes, and the pres-ence and interaction of snow, glaciers, and permafrost. Ice and/or snow on the ground surface enhances the mobility of rockfall because of a lower coefficient of friction, increased
Correspondence to:P. Deline (pdeli@univ-savoie.fr)
ground saturation, and the incorporation of ice and snow into the moving rock mass (Evans and Clague, 1988; Deline, 2009; Schneider, 2011). In inhabited mountain valleys, rock avalanching (the extremely rapid flow movement of frag-menting rock particles) represents a potential high risk for increasing infrastructure and population, as recently shown at Kolka-Karmadon, Caucasus (Huggel et al., 2005). Present glacier shrinkage (Zemp et al., 2007) and permafrost degra-dation in steep rock walls in the context of current global climate change may change hazard zones, modify control-ling processes and increase the frequency and magnitude of rockfalls and rock avalanches (Ballantyne, 2002; Fischer et al., 2006; Gruber and Haeberli, 2007; Ravanel and Deline, 2010).
Recent examples of rockfalls and rock avalanches in the Mont Blanc massif (western European Alps), range from 10 000 m3 to 2×10⁶m3 in volume (Deline, 2009) and
in-clude the small rockfalls at the Tour des Grandes Jorasses in May 2002 and September 2007, the larger Tr´e-la-Tˆete rock-fall in September 2008 (Deline et al., 2008), the small Drus rock avalanche in June 2005 (Ravanel and Deline, 2008), and the large Brenva rock avalanche in January 1997 (De-line, 2001).
The purpose of this paper is to document the rock avalanche that detached from Mont Crammont (2749 m a.s.l.) in the Mont Blanc massif area in December 2008 (Fig. 1), and to investigate and discuss its possible controlling factors.
2 Geological setting of Mont Crammont
Fig. 1.Location of the study area. Glaciers from Corine Land Cover 2000 (Swiss glaciers only represented in the Mont Blanc massif).
Valais geological zone (Antoine, 1972). The FTS is bounded to the north by the Frontal Pennic Thrust, the contact be-tween Internal and External Alpine Zones; it is up to 1000-m thick and has two 1000-main for1000-mations: (1) the Basal For-mation (BF), composed of massive beds of conglomerate (abundant dolomitic and calcareous elements, calcareous ce-ment) without schistose interbedding; and (2) the “Flysch de Tarentaise” Formation, the upper level up to 800-m-thick, composed of alternate beds of limestones (sandy and not), calcareous and phyllitic schists (calcschists), and molassic sandstones. Dip and dip direction of the FTS beds (i.e. schis-tosity) are ca. 50◦and N150◦E, respectively.
The rock avalanche fell from the north face of the rock ridge that joins the Tˆete de l’ ˆAne and Mont Crammont (Fig. 3). This anaclinal north slope is a normal escarpment roughly perpendicular to the dip of the bedding plane. It cul-minates at 2653 m a.s.l. in the detachment area, with a mean slope angle of 50◦, and rises 400–550 m above a 100–150-m-high scree slope.
3 Characteristics of the 2008 rock avalanche
3.1 Chronology of the event
On 24 December 2008, at ca. 17:21 local time (LT), a small rock avalanche detached from the north face of the Cram-mont ridge (Fig. 4). The collapse was preceded by sev-eral mixed rock-snow avalanches during the early afternoon (M. Pellin, personal communication, 2009), and small rock-falls detached from several points around a rock spur (e.g.
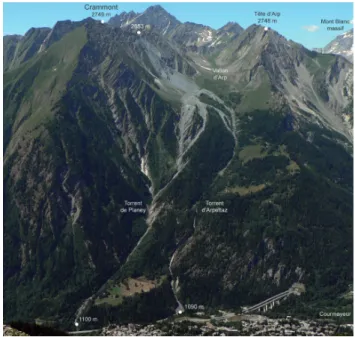
Fig. 2. General view of the Berrio Blanc massif from NE (July 2009), with used toponymy. Source zone scar and main de-posit (light grey) of the Crammont rock avalanche are in the top center; secondary deposit in the two narrow torrent streams down to the Doire River. Note highway and village at the foot of the opposite side of the Doire valley.
Fig. 3.View of the Crammont north side (August 2008). Area that eventually collapsed is delimited in yellow.
P. Deline et al.: The December 2008 Crammont rock avalanche, Mont Blanc massif area, Italy 3309
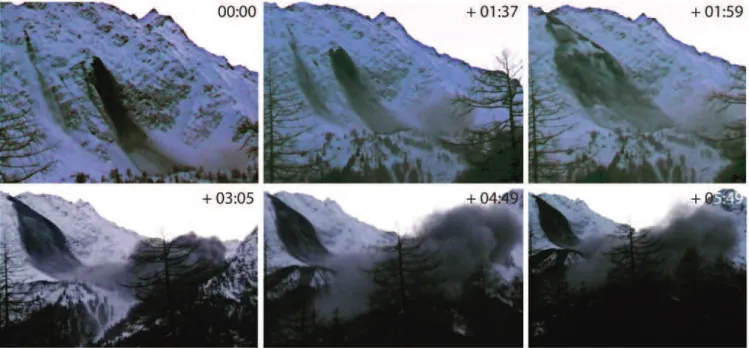
Fig. 4.Photographic sequence of the rock avalanche on the 24 December 2008 (E. Zerga). Time in mm:ss; 00:00 corresponds to ca. 17:21 (lo-cal time).
avalanche divided into two west and east arms and crossed the snow-covered plateau between 2050 and 2150 m a.s.l., where it deposited the bulk of the rock mass (Fig. 5a and b). A small part of the mass continued downstream, again form-ing two north and south branches channelled by the gullies of the Torrents d’Arpettaz and de Planey. The north Arpet-taz branch, which mainly contained snow (Fig. 5c and d), reached the Doire river at 1090 m a.s.l. without damming it; rock debris material was more abundant in the south Planey branch, which does not reach the river.
Vertical and horizontal travel distances were 1560 and 3050 m (Fig. 6). This corresponds to an apparent coefficient of internal frictionH /L=0.51, and a runout travel angle of 27.1◦. Using the photographic sequence (Fig. 4), the
esti-mated mean velocity of the rock-avalanche front during the first minute, i.e. from the base of the detachment zone to the head of the Torrent de Planey, was 14.5 m s−1. The mean ve-locity of the dust cloud was 16.5 m s−1during this first phase and decreased to 7.7 m s−1during the next 100 s.
Water seepage was observed in the Crammont scar in the days after the collapse. Rockfalls were observed continu-ously during the following months, caused by sliding and toppling of a large amount of rock debris and snow accu-mulated on the gentler bottom slope of the scar (Fig. 7), en-hanced in spring by snowmelt and rain runoff.
3.2 The failure and deposition zones
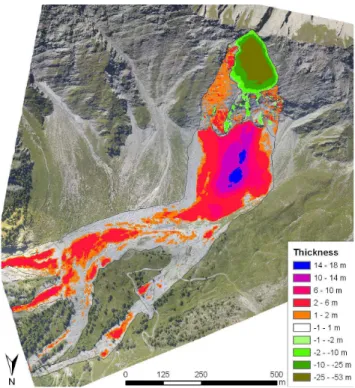
The scar ranges from 2400 to 2653 m a.s.l., with maximum widths and depths of 160 m and 53 m, respectively (Fig. 8), and the collapsed volume is 535 000 m3±30 000 m3. This data was obtained by comparing the 2 m resolution DEM of the Valley of Aosta Region generated from airborne Li-DAR before December 2008 and a high resolution (20 cm) DEM of the Crammont area generated in June 2009 from helicopter-borne LiDAR – both DEMs were obtained by re-sampling the respective point clouds on a common grid of 2 m×2 m. The landslide volume was calculated both in the detachment and accumulation zones (Fig. 8). Two different methods were used in both estimations: the first in a 2.5-D GIS environment by subtracting the two 2.5-DEMs with ESRI ArcGIS Spatial Analyst (Giardino et al., 2005); the second in a 3-D environment with InnovMetric Polyworks after creat-ing a triangulated mesh for each point cloud and computcreat-ing the volume included between the two surfaces (Broccolato et al., 2006). Due to the absence of hanging or very steep slopes, both methods could be successfully applied; the re-sults show a slight difference of a few thousand cubic meters. The ratio between the computed volumes in the detachment and accumulation areas is about 1.3 – a minimal ratio, as the deposits in the two gullies are not taken into account.
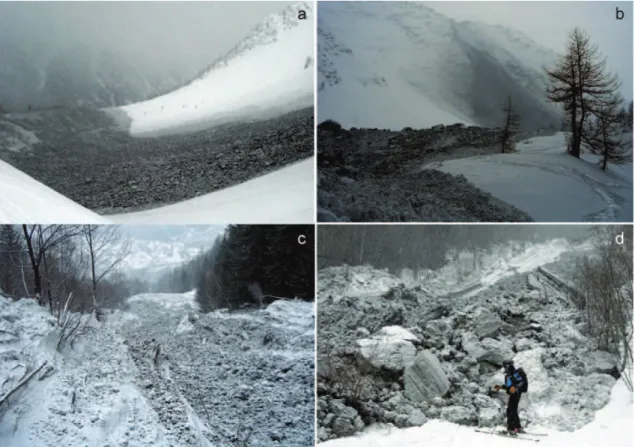
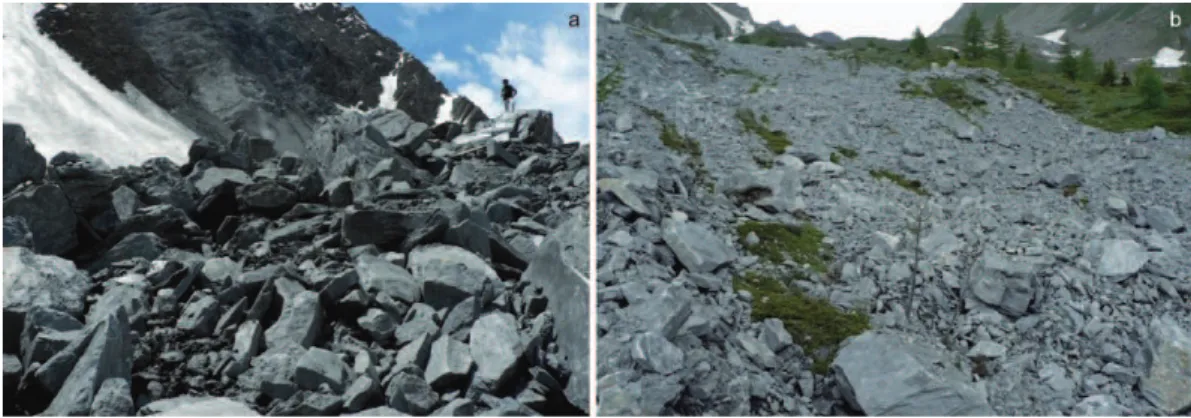
Fig. 5. Snow and rock deposit of the rock avalanche at different elevations (25 December 2008, G. Grange). (a)2050–2250 m a.s.l.;
(b)2050 m;(c)1500 m;(d)1150 m.
pre-event snow cover – a part of which was still preserved below the deposit in some areas. The bulk of the collapsed rock mass was found on the scree slope (2150–2250 m a.s.l.) and on the plateau (2050–2150 m a.s.l.). It is possible that a large part of the deposit on the scree slope was created by the secondary falls. The rock deposits generally show sharp lim-its, have longitudinal ridges, contain mainly coarse debris, and are inversely graded, openwork and clast-supported with an abundant matrix. Their thickness is variable:
– The main rock deposit (4a in Fig. 6) is generally>0.60 to 1 m thick, reaching some meters in the largest boulder (a-axis>2 m) areas (Fig. 9a); the thickness of the de-posit is very non-uniform, due to both pre-event topog-raphy and depressions resulting from snow melt (>1 m deep in thicker deposit).
– Meter-wide splash areas (4b in Fig. 6) formed adjacent to the margins of the deposit in several places, 2–5 cm up to 10 cm thick. Generally, silts and sands are dom-inant, with a variable proportion of decimetric debris. However, some splash areas are composed of coarser debris (gravels to cobbles) without fine material. On the scree slope, three boulders a few metres in size were thrown out of the deposit.
– The vegetation and the soil surface of some areas within the landslide area are scoured without any rock de-posit (Fig. 9b), especially on steeper slopes with alpine meadow and shrubs (4c in Fig. 6).
– Finally, an extended thin (<1 mm) silt deposit on top of the snow cover resulted from the dust cloud covering the Vallon d’Arp, which was redistributed by the snow melt runoff in spring 2009.
In the torrent gullies, the average final rock deposit is thin-ner than on the plateau. It ranges from several decimetres to a few metres in many areas, with a mean minimum thickness of ca. 20 cm (e.g. in the distal part of the Arpettaz branch). Unsorted large clasts are matrix-supported. The gradation suggests an increase of the matrix production by dynamic fragmentation from proximal (clast-supported fabric) to dis-tal (matrix-supported fabric) deposition areas.
4 Factors controlling slope stability
4.1 Low frequency of rockfalls during the Holocene
P. Deline et al.: The December 2008 Crammont rock avalanche, Mont Blanc massif area, Italy 3311
Fig. 6.Map of the Crammont area, with main geomophological elements. 1: Lateglacial moraines; 2: old rock-avalanche deposit; 3: 2008 rock-avalanche source zone; 4: 2008 rock-avalanche deposit (4a: rock deposit; 4b: scoured area; 4c: splash area). Elevations are in m a.s.l.; 2008 orthophoto.
Fig. 7.North side of the Crammont (left) and detailed view (right) of the thick rock debris accumulation in the gentler bottom area of the rock-avalanche scar (13 January 2009).
line on the north side of Crammont was located between ca. 2600 m a.s.l. (Coutterand and Buoncristiani, 2006) and slightly above 2700 m a.s.l. (Porter and Orombelli, 1982). Thus, rock slope failures due to glacial downwasting and consequent debuttressing have affected the Crammont side during the paraglacial time (Ballantyne, 2002) which ended before the Lateglacial termination, as shown by the preserva-tion of the Lateglacial morainic complex of the Vallon d’Arp
(1 in Fig. 6). The shape of the north side suggests indeed that large collapses occurred before this termination, which prob-ably deposited onto the surface of the downwasting glacier.
During the Holocene, the main active processes were frost-shattering due to freeze-thaw cycles, and debris and boulder falls, as shown by the large scree slope at the foot of the north side of the Crammont. Partly vegetated, it is reshaped by small debris flows in summer and wet snow avalanches in spring.
No large Holocene rockfall deposits dating from before 2008 could be observed in the Vallon de l’Arp, except one composed of BF rocks (2 in Fig. 6) detached from the south face of the Tˆete d’Arp (Fig. 2); soil and forest covering the deposit and weathering of its boulders suggest that this Holocene rockfall is at least several centuries old.
Fig. 8. Thickness map of the detachment and accumulation zones obtained after subtraction of 2009 from 2008 LiDAR DEM; thick-ness values are in meters.
According to SisFrance (national database of historical seismicity of France), four earthquakes of weak to moderate intensity have affected the Mont Blanc area of in the decade that preceded the 2008 collapse, with epicenters at Magland (France, 19 August 2000), Martigny (Switzerland, 23 Febru-ary 2001), Petit-Saint-Bernard (Italy, 12 June 2004) and Val-lorcine (France, 8 September 2005). Archives of the INGV (Istituto Nazionale di Geofisica e Vulcanologia, Italy) men-tion three earthquakes with a local magnitude (Ml)≥2 in the
Aosta Valley in 2008, with epicenters at Nus (14 Septem-ber, Ml: 2.0; 23 October, Ml: 2.9) and Pr´e-Saint-Didier
(11 November,Ml: 2.7),∼60 and∼8 km far from the
Cram-mont, respectively. This last earthquake could have con-tributed to prepare the 24 December collapse, but no trig-gering seismic event was recorded during the failure itself. 4.2 Geological discontinuities in the Crammont
detachement area
Both the rock face and boulders in the deposit show a high fracture density. The ridge summit, which seems to be double-crested in some sections, presents open, vertical cracks. Many fractures are filled with quartz and calcite, while reddish rock coating indicates past hydrothermal cir-culation or near-surface weathering due to redox processes (limonite).
A geomechanical characterization of the rock slope was carried out starting from the helicopter-borne LiDAR point
cloud. A semi-automatic tool based on the macro language ofInnovMetricPolyworks enabled the calculation of dip and dip-direction for over 300 discontinuity surfaces (Broccolato et al., 2006). Seven major discontinuity sets have been recog-nized within an area of about 1 km2, of which four sets likely determined the failure (Fig. 10). A rotational slide proba-bly occurred along a slightly curved surface formed by the combination of two surfaces belonging to Set 4 and Set 5, while steeper discontinuity sets acted as upper and lateral re-lease surfaces. A kinematic analysis (Hoek and Bray, 1981) carried out in order to better understand the potential sliding mechanisms showed that planar sliding is feasible both for Set 4 and Set 5 with an average slope orientation of 48/14 (dip/dip direction) measured in the detachment area on the pre-failure LiDAR point cloud.
4.3 Meteorological conditions prior to the event
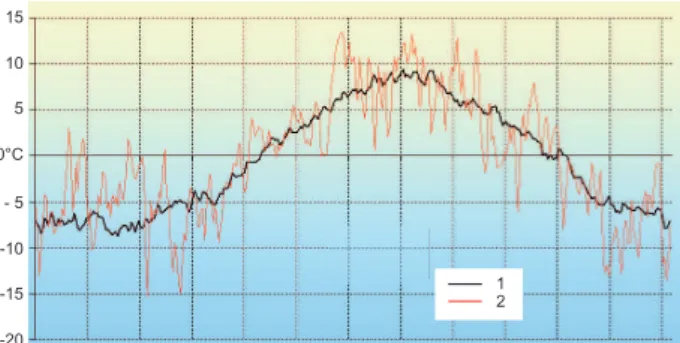
Precipitation amounted to 99.2 and 0 mm at Morgex (938 m a.s.l.; 7.5 km east of Crammont) during the periods 1–17 December and 18–24 December 2008, respectively. At Grand-Saint Bernard Pass (2472 m a.s.l.; 22 km north-east of Crammont), mean daily air temperature (MDAT) in-creased regularly from −13.1◦C to −1◦C during the pe-riod 25 November–24 December 2008, before dropping to −13.6◦C on 28 December 2008 (Fig. 11). MDAT became higher than 1960–2007 average after 14 December, but it re-mained below 0◦C (Fig. 11); maximum daily air tempera-ture was>0◦C during four days of the period: 18 (1.4◦C), 22 (1.1◦C), 23 (1.0◦C), and 24 December (2.1◦C).
4.4 Permafrost conditions
P. Deline et al.: The December 2008 Crammont rock avalanche, Mont Blanc massif area, Italy 3313
Fig. 9.Final rock deposit of the rock avalanche on the plateau, after the melting of the snow (June 2009).(a)several-m-thick deposit in the lower centre of the east arm;(b)scoured areas in the west arm.
01/01 31/01 01/03 31/03 30/04 30/05 29/06 29/07 28/08 27/09 27/10 26/11 26/12 2
1 -15
-20 - 5
-10 5
0°C 15
10
Fig. 11. Air temperature at Grand St Bernard pass (2472 m a.s.l.; data from MeteoSwiss). 1: 1960–2007 average of the mean daily air temperature; 2: 2008 mean daily air temperature.
not included. For details on the modelling procedure, sensi-tivity studies, and validation we refer to Noetzli (2008).
The basis for the estimation of rock surface temperatures are simulations using the climate time series from the Swiss station Corvatsch (3330 m a.s.l.; 235 km east-north-east of Crammont; data source: MeteoSwiss), where continuous data of all required parameters are available. The climatic conditions at high elevations in the Crammont area are as-sumed to be similar to those for the inner alpine conditions in the Engadine, because of the mountain effect of the Mont Blanc massif in the west (see also leading climatologic re-gions of the greater alpine region by Auer et al., 2007). Further, the horizontal extrapolation of climate variables be-tween climate stations at high elevation has been shown to lead to significantly smaller differences even for large dis-tances compared to vertical extrapolation of stations nearby (e.g. Auer et al., 2007; Suter, 2002).
For the 3-dimensional subsurface heat conduction, we cre-ated a mesh describing the cross section, with increasing mesh size towards the surface and a lower boundary heat flux of 0.08 Wm−2at sea level. Subsurface properties were assumed to be homogeneous for the entire cross section and set to values taken from literature (i.e. heat capacity 2 106J m−3K−1and thermal conductivity 2.5 W K−1m−1, cf. Noetzli, 2008). Because the current subsurface thermal field is in a transient state mainly due to the recent 20th century warming, we assumed a temperature increase of +2◦C since the end of the LIA (cf. Noetzli et al., 2008) and initialized the temperature field for 150 yr. Effects from earlier climate variations are assumed to be negligible for the depth scales considered here (Noetzli and Gruber, 2009). The idealized and simplified assumptions in the model (e.g. no snow cover, heat transport by conduction only, a homogeneous subsur-face, no effects of latent heat) allow us to draw a schematic picture of the temperature range and conditions in the Cram-mont ridge. Sensitivity studies (Noetzli and Gruber, 2009) have shown that the general pattern is not strongly affected by these assumptions. New studies on bedrock permafrost
Fig. 12. Simulated subsurface temperature field in the Crammont rock ridge (topography prior to the 2008 rock failure). Black dashed line: 0◦C isotherm; white line: detachment zone (i.e. post-failure topography, based on 2009 DTM).
temperatures point to colder conditions at depth than at the surface in rock where a thin snow cover is accumulated or cold air convection takes place in clefts (Hasler et al., 2011; Pogliotti, 2011). The simulations do not intend to represent accurate ground temperatures, but to illustrate the general pattern and range of the subsurface thermal field in the de-tachment area. Currently, no field temperature data for model validation is available.
The resulting schematic subsurface temperature field is displayed in Fig. 12, where also the schematic permafrost boundary is illustrated by the 0◦C isotherm. The general temperature pattern is typical for a west-east trending ridge situation with near-vertical isotherms in the uppermost part and temperatures changing mainly with their position be-tween the different warm mountain sides. In the summit ridge of Mont Crammont, the modeled schema suggests that permafrost may be present on the north slope with lowest temperatures of around−3◦C in the highest parts, but mainly in the range above−2◦C. The south side is potentially free
of permafrost and the permafrost boundary would then be nearly vertical within the summit ridge of Mont Crammont. The recent 20th century warming has likely affected the up-permost ca. 50 m below the surface as can be seen from the isotherms which are strongly bent towards the surface.
P. Deline et al.: The December 2008 Crammont rock avalanche, Mont Blanc massif area, Italy 3315 temperatures may have progressively degraded permafrost
in the mountain areas. The role of permafrost degradation for rock stability has often been discussed in recent litera-ture. The processes and mechanisms involved are not yet fully clear, but theoretical (e.g. Gruber and Haeberli, 2007; Hasler, 2011), experimental (Hasler et al., 2011), and statis-tical (Ravanel et al., 2010; Fischer et al., 2011) studies sug-gest its likely contribution, and point to an increase in rock-fall events – especially in the past one-two decades – and an increased sensitivity of warm permafrost areas. Permafrost degradation is only one of the factors reducing the stability of a rockwall and is never the only cause. However, of the potential contributing factors, permafrost can be seen as the one undergoing the largest and fastest changes today and in the recent decades, while other factors such as geology and topography are constant over longer time periods. Further, Hasler (2011) states that conduction-driven failures can oc-cur throughout the year because they are related to warming permafrost at depth. In contrast, shallower events resulting from freeze-thaw processes and increased active layer thick-ness are expected only during the warm season. With its oc-currence at a likely warm permafrost area and the timing in December, the Crammont detachment fits into this broader picture. The heavy fracturing of the rock face (dense, large clefts) enhances water circulation, which may additionally have contributed to heat transport to deeper areas by advec-tion. Observation of water seeping in the Crammont scar during the days following the collapse supports this.
5 Re-analysis of the rock-avalanche runout
In spite of its volume well below the threshold of 1×10⁶m3, which is commonly considered as minimum for being clas-sified as a Sturzstrom (Hs¨u, 1975), the Crammont rock avalanche experienced high mobility. In addition to the steep relief and the dynamic rock mass disintegration, the enhanced mobility results from: (i) the lower friction at the interface between rock debris and snow; (ii) the incorpora-tion of snow by the rock avalanche, that leads to saturaincorpora-tion of the moving mass (Huggel et al., 2005); and (iii) the chan-nelization by moraines on the plateau and torrent gullies, that has a funnelling effect by preventing lateral spreading. In dif-ferent areas, erosion marks at the ground surface (soil pulled out, striae on boulders) or geometry of the deposit (stripes) indicate the direction of the moving mass, controlled by the moraines.
The runout of the Crammmont landslide was back-analyzed with DAN3D (McDougall and Hungr, 2004), a model based on the “equivalent fluid” approach, as de-fined by Hungr (1995). DAN3D is a relatively simple two-dimensional dynamic model, controlled by a small number of adjustable parameters, which allows a simulation of the event’s flow distance, velocity and distribution of deposits. Two grid files, describing the initial elevation of the sliding
surface and the initial depth of the failure source volume, re-spectively, were provided as input to the model. Two dif-ferent rheologies were combined to describe the landslide flow: a frictional model was used in the proximal path and a Voellmy rheology in the distal path, in order to simulate the effect of the snow in increasing the landslide mobility (Voellmy, 1955). The transition between the frictional and Voellmy models was placed at the base of the scree slope. Taking into account the presence of snow, a bulk friction an-gle of 30◦ was adopted for the frictional model. The two Voellmy resistance parameters were adjusted by trial and er-ror to achieve the best fit with the observed extension of the rock-avalanche deposit, considering also some published val-ues from comparable case studies (Hungr and Evans, 1996; McDougall et al., 2006; Sosio et al., 2008). Values of fric-tion coefficient f=0.17 (dimensionless) and turbulent co-efficientξ=1000 m s−2produced the best results. The first
simulation gave good agreement in terms of flow distance but the results at the base of the scree slope were not consistent with the observed deposit thickness and distribution.
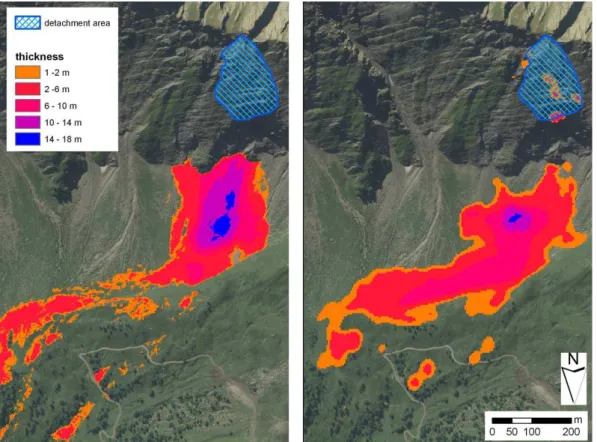
A two-phase simulation was then carried out, with two separate sliding volumes of 370 000 m3and 200 000 m3, re-spectively, released in sequence. The resistance parameters previously specified were adopted for the first event. For the second event, the bulk friction angle was increased to 37◦, based on the assumption that the snow on the talus slope had been removed during the first event. In order to simulate the topographic changes due to the first event, a slice of about 200 000 m3was subtracted from the original detachment area by simply translating upwards the original sliding surface. The topography of the second event was obtained by adding the first deposit to the original topography. Results show a better fit on the scree slope, with a deposit similar to that observed in the field (Fig. 13).
Fig. 13.Comparison between measured (left) and computed by DAN3D (right) rock-avalanche deposit thickness on the scree slope and the plateau.
P. Deline et al.: The December 2008 Crammont rock avalanche, Mont Blanc massif area, Italy 3317 slides originating from the source area and depositing on the
snow-free scree slope are likely dry and frictional in char-acter, their deposit distribution is relatively independent of source volume, at least in terms of the displacement of the centre of gravity. Therefore, an analysis of a single detach-ment, as conducted here for Stage 2, produces approximately the same deposit as would be produced by the analysis of multiple smaller detachments. This is of course a gross ap-proximation, but, in the absence of more detailed record of the slope activity during the winter, it is probably not con-structive to attempt a more refined analysis. The important conclusion is that the high mobility of the 24 December 2008 event was caused by the mobilizing role of the snow cover, while the subsequent activity was more in line with normal dry rock slide behaviour.
6 Conclusions
1. A small rock avalanche, the 2008 Crammont event, is one of the major recent landslides in the Alps. Its slightly low apparent travel angle – especially consid-ering its relative small volume (0.5 Mm3)– results from its channelization and the incorporation of snow. This should draw our attention to the importance of local conditions (e.g. snow cover, topography) in the consid-eration of this hazard in the context of risk management. 2. A schematic model of rock temperature distribution in the Crammont ridge suggests that warm permafrost may be present in the north face at the elevation range of the scar. Climate warming since the termination of the Lit-tle Ice Age and especially in the past one or two decades likely degraded it, and heat advection by water circula-tion could have recently affected the rock mass at depth. 3. A two-phase back-analysis of the motion of the Cram-mont rock avalanche confirms the important role of snow in increasing its mobility. Agreement between simulated and observed trajectories of the sliding mass suggests that the velocities calculated by DAN3D are consistent with the real ones. Modelling is seen to con-tribute towards better understanding of the dynamics of the event, especially its two phases.
4. Occurring in a densely inhabited area of the Alps, close to one of the main international roads crossing the Alps, the Crammont rock avalanche emphasizes how this highly destructive process can place populations at risk, even at a considerable distance from the slope failure site. In the context of present global warming and further warming predicted for the 21st century, per-mafrost degradation should accelerate, and more fre-quent rock avalanches could be triggered.
Acknowledgements. The authors thank M. Ravello, E. Zerga, G. Grange and the Fondazione Montagna sicura (Courmayeur) for information and photos, D. Cat-Berro and L. Mercalli (Societ`a Meteorologica Italiana) for processing the Grand-Saint-Bernard pass data, F. Villa (Imageo) for preparation and simulations with DAN3D, and the two reviewers, T. Davies and C. Prager, for detailed and helpful comments that significantly improved the manuscript.
Edited by: T. Glade
Reviewed by: T. Davies and C. Prager
References
Antoine, P.: Le domaine pennique externe entre Bourg-St-Maurice (Savoie) et la fronti`ere italo-suisse (Bilan des connaissances actuelles sur ce secteur de la zone des Br`eches de Tarentaise), G´eologie Alpine, 48, 5–40, 1972.
Auer, I., B¨ohm, R., Jurkovic, A., Lipa, W., Orlik, A., Potzmann, R., Sch¨oner, W., Ungersb¨ock, M., Matulla, C., Briffa, K., Jones, P.D., Efthymiadis, D., Brunetti, M., Nanni, T., Maugeri, M., Mercalli, L., Mestre, O., Moisselin, J., Begert, M., M¨uller-Westermeier, G., Kveton, V., Bochnicek, O., Stastny, P., Lapin, M., Szalai, S., Szentimrey, T., Cegnar, T., Dolinar, M., Gajic-Capka, M., Zaninovic, K., Majstorovic, Z., and Nieplova, E.: HISTALP – historical instrumental climatological surface time series of the Greater Alpine Region, Int. J. Climatol., 27, 17–46, 2007.
Ballantyne, C. K.: Paraglacial geomorphology, Quaternary Sci. Rev., 21, 1935–2017, 2002.
Broccolato, M., Martelli, D. C. G., and Tamburini, A.: Il rilievo geomeccanico di pareti rocciose instabili difficilmente accessibili mediante impiego di laser scanner terrestre. Applicazione al caso di Ozein (Valle di Cogne, Aosta), Geoingegneria Ambientale e Mineraria, 119, 39–46, 2006.
Coutterand, S. and Buoncristiani, J.-F.: Pal´eog´eographie du dernier maximum glaciaire du Pl´eistoc`ene r´ecent dans la r´egion du mas-sif du Mont Blanc, Quaternaire, 17, 35–43, 2006.
Deline, P.: Recent Brenva rock avalanches (Valley of Aosta): new chapter in an old story?, Geogr. Fis. Din. Quat., Supplemento 5, 55–63, 2001.
Deline, P.: Interactions between rock avalanches and glaciers in the Mont Blanc massif during the late Holocene, Quaternary Sci. Rev., 28, 1070–1083, 2009.
Deline, P., Kirkbride, M. P., Ravanel, L., and Ravello, M.: The Tr´e-la-Tˆete rockfall onto the glacier de la Lex Blanche (Mont Blanc massif, Italy) in September 2008, Geogr. Fis. Din. Quat., 31, 251–254, 2008.
Evans, S. G. and Clague, J. J.: Catastrophic rock avalanches in glacial environments, in: Proceedings of the 5th International Symposium on Landslides, Balkema, Rotterdam, 2, 1153–1158, 1988.
Fischer, L., K¨a¨ab, A., Huggel, C., and Noetzli, J.: Geology, glacier retreat and permafrost degradation as controlling fac-tors of slope instabilities in a high-mountain rock wall: the Monte Rosa east face, Nat. Hazards Earth Syst. Sci., 6, 761–772, doi:10.5194/nhess-6-761-2006, 2006.
on rock avalanches and rockfalls in high-mountain areas, NNat. Hazards Earth Syst. Sci., in review, 2011.
Giardino, M., Borgogno Mondino, E., and Perotti, L.: Geomatics application for geological and geomorphological mapping and landslide hazard evaluation: case studies in the Italian NW-Alps, in: Proceedings of the 31st Symposium on Remote Sensing of Environment, Saint Petersburg (CSI), unpaginated CD-ROM, 4 pp., 2005.
Gruber, S. and Haeberli, W.: Permafrost in steep bedrock slopes and its temperature-related destabilization following climate change, J. Geophys. Res., 112, F02S18, doi:10.1029/2006JF000547, 2007.
Hasler, A.: Thermal conditions and kinematics of steep bedrock permafrost, PhD Thesis, University of Zurich, Zurich, 177 pp., 2011.
Hasler, A., Gruber, S., Font, M., and Dubois, A.: Advective heat transport in frozen rock clefts – conceptual model, laboratory experiments and numerical simulation, Permafrost Periglac., in press, 2011.
Hasler, A., Gruber, S., and Haeberli, W.: Temperature variabil-ity and thermal offset in steep alpine rock and ice faces, The Cryosphere Discuss., 5, 721–753, doi:10.5194/tcd-5-721-2011, 2011.
Hoek, E., and Bray, J.W.: Rock Slope Engineering, Institution of Mining and Metallurgy, pp. 360, 1981.
Hs¨u, K. J.: Catastrophic debris streams (sturzstroms) generated by rockfalls, Geol. Soc. Am. Bull., 86, 129–140, 1975.
Huggel, C., Zgraggen-Oswald, S., Haeberli, W., K¨a¨ab, A., Polkvoj, A., Galushkin, I., and Evans, S. G.: The 2002 rock/ice avalanche at Kolka/Karmadon, Russian Caucasus: assessment of extraordi-nary avalanche formation and mobility, and application of Quick-Bird satellite imagery, Nat. Hazards Earth Syst. Sci., 5, 173–187, doi:10.5194/nhess-5-173-2005, 2005.
Hungr, O.: A model for the runout analysis of rapid flow slides, de-bris flows, and avalanches, Can. Geotech. J., 32, 610–623, 1995. Hungr, O. and Evans, S. G.: Rock avalanche runout prediction us-ing a dynamic model, in: Procs., 7th. International Symposium on Landslides, edited by: Senneset, K., Trondheim, Norway, 1, 233–238, 1996.
Ivy-Ochs, S., Kerschner, H., Maisch, M., Christl, M., Kubik, P.W., and Schl¨uchter, C.: Latest Pleistocene and Holocene glacier vari-ations in the European Alps, Quaternary Sci. Rev., 28, 2137– 2149, 2009.
McDougall, S. and Hungr, O.: A model for the analysis of rapid landslide motion across three-dimensional terrain, Can. Geotech. J., 41, 1084–1097, 2004.
McDougall, S., Boultbee, N., Hungr, O., Stead, D., and Shwab, J. W.: The Zymoetz Rivel landslide, British Columbia, Canada: de-scription and dynamic analysis of a rock slide-debris flow, Land-slides, 3, 195–204, 2006.
Noetzli, J.: Modeling transient three-dimensional temperature fields in mountain permafrost, PhD Thesis, Department of Geography, University of Zurich, Zurich, Switzerland, 150 pp., 2008.
Noetzli, J. and Gruber, S.: Transient thermal effects in Alpine per-mafrost, The Cryosphere, 3, 85–99, doi:10.5194/tc-3-85-2009, 2009.
Noetzli, J., Hilbich, C., Hauck, C., Hoelzle, M., and Gruber, S.: Comparison of simulated 2D temperature profiles with time-lapse electrical resistivity data at the Schilthorn crest, Switzer-land, in: Proceedings of the 9th International Conference on Permafrost, Fairbanks, USA, 29 June–3 July 2008, 1293–1298, 2008.
Noetzli, J., Gruber, S., and von Poschinger, A.: Modellierung und Messung von Permafrosttemperaturen im Gipfelgrat der Zugspitze, Deutschland, Geographica Helvetica, 2, 113–123, 2010.
Orombelli, G. and Porter, S. C.: Il rischio di frane nelle Alpi, Le Scienze, 156, 68–79, 1981.
Pogliotti, P.: Influence of snow cover on MAGST over complex morphologies in mountain permafrost regione, PhD Thesis, Uni-versity of Torino, Torino, 79 pp., 2011.
Porter, S. C. and Orombelli, G.: Late-glacial ice advances in the western Italian Alps, Boreas, 11, 125–140, 1982.
Ravanel, L. and Deline, P.: La face ouest des Drus (massif du Mont-Blanc) : ´evolution de l’instabilit´e d’une paroi rocheuse dans la haute montagne alpine depuis la fin du petit ˆage glaciaire, G´eomorphologie, 4, 261–272, 2008.
Ravanel, L. and Deline, P.: Climate influence on rockfalls in high-Alpine steep rockwalls: The North side of the Aiguilles de Cha-monix (Mont Blanc massif) since the end of the “Little Ice Age”, Holocene, 21, 357–365, doi:10.1177/0959683610374887, 2010. Schneider, D.: On Characteristics and Flow Dynamics of Large Rapid Mass Movements in Glacial Environments, PhD Thesis, University of Zurich, Zurich, 261 pp., 2011.
Sosio, R., Crosta, G. B., and Hungr, O.: Complete dynamic model calibration for the Thurwieser rock avalanche (Italian Central Alps), Eng. Geol., 100, 11–26, 2008.
Suter, S.: Cold firn and ice in the Monte Rosa and Mont Blanc areas: spatial occurrence, surface energy balance and climatic evidence, PhD thesis, Versuchsanstalt f¨ur Wasserbau, Hydrolo-gie und GlazioloHydrolo-gie, ETH Zurich, Zurich, Switzerland, 188 pp., 2002.
Voellmy, A.: ¨Uber die Zerst¨orungskraft von Lawinen, Schweiz-erische Bauzeitung, 73, 159–162, 1955.
Wanner, H., Beer, J., Butikofer, J., Crowley, T. J., Cubasch, U., Fluckiger, J., Goosse, H., Grosjean, M., Joos, F., Kaplan, J. O., Kuttel, M., Muller, S. A., Prentice, I. C., Solomina, O., Stocker, T. F., Tarasov, P., Wagner, M., and Widmann, M.: Mid-to Late Holocene climate change: an overview, Quaternary Sci. Rev., 27, 1791–1828, 2008.