Global challenges for sustainable agriculture and
rural development in Slovakia
Globálne výzvy trvalo udržateľného
poľnohospodárstva a rozvoja vidieka na Slovensku
Magdaléna LACKO-BARTOŠOVÁ1* and Štefan BUDAY2*1
Slovak University of Agriculture in Nitra, Faculty of Agrobiology and Food Resources, Trieda Andreja Hlinku 2, Nitra, 949 76, Slovakia, e-mail:magdalena.lacko-bartosova@uniag.sk *correspondence 2
Research Institute of Agricultural and Food Economics in Bratislava, Trenčianska 55, Bratislava, 824 80, Slovakia, e-mail:stefan.buday@vuepp.sk *correspondence
Abstract
The paper is focused on the evaluation of economic, social and environmental challenges of sustainable agriculture. The selected indicators of the economic challenges of sustainable agriculture imply that agriculture in Slovakia is not in long term be able to ensure competitiveness in the European market, gross agricultural output is characterized by a faster decline in animal production than in crop
production and the value of import of agri-food commodities is higher than the value of export. According to selected indicators of social challenges of sustainable
agriculture the number of persons working in agriculture has decreasing tendency in last years. The evaluation of selected indicators of environmental challenges of sustainable agriculture implies that area of organic agriculture is the most widely applied sub-measure within the measure agri-environmental payments. For ensuring the balance of the three mentioned dimensions of sustainable agriculture is
necessary to increase of local production and consumption of local products, to ensure the protection of nature and landscape, to ensure rural development and to increase the employment opportunities in countryside.
Keywords: agri-environmental support, economic challenges of sustainable agriculture, employment in agriculture, environmental challenges of sustainable agriculture, gross agricultural output, less favoured areas, NATURA 2000, social challenges of sustainable agriculture, sustainable agriculture
Abstrakt
Príspevok je zameraný na hodnotenie ukazovateľov ekonomických,
environmentálnych a sociálnych výziev trvalo udržateľného poľnohospodárstva. Z vybraných ukazovateľov ekonomickej výzvy trvalo udržateľného poľnohospodárstva vyplýva, že poľnohospodárstvo Slovenska nie je z dlhodobého hľadiska schopné zabezpečiť konkurencieschopnosť na európskom trhu, hrubá poľnohospodárska produkcia sa vyznačuje rýchlejším poklesom živočíšnej produkcie ako rastlinnej
produkcie a hodnota dovozu agropotravinárskych komodít je vyššia ako hodnota
vývozu. Podľa vybraných ukazovateľov sociálnych výziev trvalo udržateľného poľnohospodárstva dochádza každoročne k úbytku zamestnancov v
poľnohospodárstve. Z hodnotenia vybraných ukazovateľov environmentálnej výzvy
263 263 263 263 263
trvalo udržateľného poľnohospodárstva je zrejmé, že výmera ekologického poľnohospodárstva je najrozšírenejším podopatrením v rámci opatrenia
agroenvironmentálne platby a produkcia obnoviteľnej energie z poľnohospodárstva a lesníctva za posledné roky stúpa. Na zabezpečenie rovnováhy týchto troch
spomínaných dimenzií je nevyhnutné zvýšiť miestnu produkciu a spotrebu miestnych produktov, chrániť prírodu a krajinu, zabezpečiť rozvoj vidieka a zvyšovať možnosti
zamestnanosti na vidieku.
Kľúčové slová: agroenvironmentálna podpora,ekonomické výzvy trvalo
udržateľného poľnohospodárstva, environmentálne výzvy trvalo udržateľného poľnohospodárstva, hrubá poľnohospodárska produkcia, NATURA 2000, sociálne
výzvy trvalo udržateľného poľnohospodárstva, trvalo udržateľné poľnohospodárstvo, zamestnanosť v poľnohospodárstve, znevýhodnené oblasti
Detailed abstract
Pri zabezpečení trvalo udržateľného poľnohospodárstva sú dôležité tri hlavné myšlienky: ekonomicky životaschopná produkcia potravín, ochrana životného
prostredia a sociálnych potrieb.Cieľom príspevku jehodnotenie ukazovateľov
ekonomických, environmentálnych a sociálnych výziev trvalo udržateľného
poľnohospodárstva. Pri riešení sa vychádzalo z analýzy „tvrdých dát“ za celé územie Slovenska. Primárnymi údajmi boli údaje zo Štatistického úradu SR, Ministerstva pôdohospodárstva a rozvoja vidieka SR a Eurostatu. Sekundárnymiúdajmi boli údaje z Ekonomického poľnohospodárskeho účtu. Slovenské poľnohospodárstvo
prechádzalo za posledné roky zložitým vývojovým obdobím recesie a v súčasnosti
pretrváva v stagnácii rozhodujúcich ekonomických a výrobných ukazovateľov. Z
vybraných ukazovateľov ekonomickej výzvy trvalo udržateľného poľnohospodárstva vyplýva, že poľnohospodárstvo Slovenska nie je schopné dlhodobo vyprodukovať
primeranú úroveň zisku a tým zabezpečiť konkurencieschopnosť na globálnom trhu európskej únie. Slovenské poľnohospodárstvo sa v tvorbe hrubej pridanej hodnoty
umiestnilo na konci spomedzi všetkých štátov Európske únie. Hrubá
poľnohospodárska produkcia sa vyznačuje rýchlejším poklesom živočíšnej produkcie
ako rastlinnej produkcie, vývoj zahraničného agropotravinárskeho obchodu je
poznačený zápornou bilanciou, teda hodnota vývozu je nižšia ako hodnota dovozu a
zberové plochy takmer všetkých plodín poklesli (okrem zberových plôch kukurice a olejnín). Podľa vybraných ukazovateľov sociálnych výziev trvalo udržateľného
poľnohospodárstva dochádza každoročne k úbytku zamestnancov
v poľnohospodárstve a najsilnejšou vekovou kategóriou je skupina pracovníkov vo veku 50-59 rokov. Z hodnotenia vybraných ukazovateľov environmentálnej výzvy
trvalo udržateľného poľnohospodárstva je zrejmé, že výmera ekologického poľnohospodárstva je najrozšírenejším podopatrením v rámci opatrenia
agroenvironmentálne platby a produkcia obnoviteľnej energie z poľnohospodárstva a lesníctva za posledné roky stúpa. V záujme zvýšenia konkurencieschopnosti
slovenského poľnohospodárstva a životaschopnosti slovenských fariem je potrebné,
farmy na Slovensku, ktoré čelia vážnym štrukturálnym problémom, vhodným
spôsobom reštrukturalizovať. V tejto súvislosti je taktiež potrebné podporiť generačnú
obnovu v poľnohospodárstve, teda podporovať najmä mladých poľnohospodárov.
Rovnováhu spomínaných trochdimenzií je možné zabezpečiťoptimálnou mierou
hospodárenia, zameranímfinančných stimulov do inovácií,zvýšením miestnej
264 264 264 264 264
produkcie a spotreby miestnych produktov, ochranou prírody a krajiny,
zabezpečením rozvoja vidieka a zvyšovaním možnosti zamestnanosti na vidieku.
Introduction
The essence of sustainability is a balance between economic, environmental and social criteria. To achieve this balance is important to increase the competitiveness of agriculture, food and forestry sectors and improve the quality of life in rural areas with emphasis on sustainable development (Stehlo P., Buday Š., 2005).
The increasing the competitiveness of the agricultural sector can ensure through the modernization and innovation of farms, knowledge development and increasing expertise overview.
For increasing the quality of life in the rural areas is necessary the development of the regional infrastructure and human capital in the rural areas and aims to improve the conditions for creating job opportunities in all sectors and diverse the rural economy (Stehlo P., Buday Š., 2007).
According to Lacko-Bartošová (2005), the environmental challenges are focused to improve the environment and landscape and it aims to create the multi-functional agricultural and forestry systems with the positive impact on the environment, nature, and appearance of the land. The support is concentrated in diversity of the plant and animal species, quality improvement of the water, agricultural and forestry land, and mitigation of the climate change consequences.
Materials and Methods
By contribution solving we used analysis of „hard data“ for the whole area of Slovakia and qualitative forecast of data for the whole area of Slovakia. The primary
information sources in the evaluation of selected indicators of economic challenges of sustainable agriculture were data from the database of the Statistical Office, Ministry of Agriculture and Rural Development and Eurostat and secondary processed data from the Economic Agricultural Account. In pursuit of selected
indicators of social challenges of sustainable agriculture are again based on the data from the database of the Statistical Office. The basis for the evaluation of the
selected indicators of environmental challenges of sustainable agriculture was quantitative data of the Agricultural Paying Agency. In addition, we have used by solution the methods and techniques based on the analysis of literature, general statistics and research materials.
Results
Part: Economic challenges of sustainable agriculture
The economic situation in the Slovak agriculture
The agriculture in the Slovak Republic is an integral part of the European economy, where extensive structural changes have been proceeding significantly in recent years. These changes substantially affect the domestic production, the price
development and the rural development. Economy of the agriculture in the Slovak Republic as well as economy in each EU country was greatly influenced by the support policy, the prices of agricultural commodities on the world and European
265 265 265 265 265
markets, mainly high price volatility, dependence on world cereal production, utilization, stocks and trade forecasts, growth in demand for animal commodities, growth of agricultural inputs.
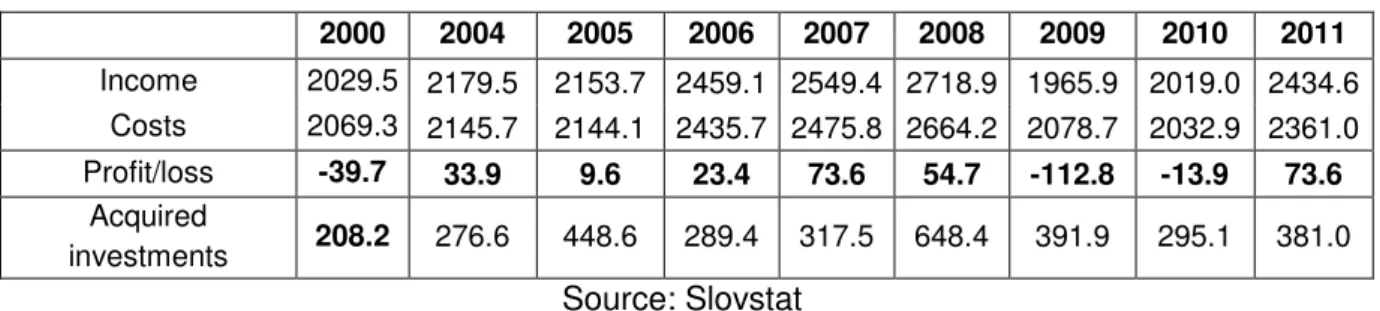
Table 1. Development of main economic indicators for agriculture, in million € Tabuľka 1. Vývoj hlavných ekonomických ukazovateľov poľnohospodárstva, v mil. €
2000 2004 2005 2006 2007 2008 2009 2010 2011
Income 2029.5 2179.5 2153.7 2459.1 2549.4 2718.9 1965.9 2019.0 2434.6 Costs 2069.3 2145.7 2144.1 2435.7 2475.8 2664.2 2078.7 2032.9 2361.0 Profit/loss -39.7 33.9 9.6 23.4 73.6 54.7 -112.8 -13.9 73.6
Acquired
investments 208.2 276.6 448.6 289.4 317.5 648.4 391.9 295.1 381.0
Source: Slovstat
In recent years Slovak agriculture went through the complicated developmental period of recession and currently remains in economic stagnation of its economic and production indicators (table 1):
- profit/ loss has developed variably in response to the change of income and costs,
- negative profit/ loss was reached in the depression years (2009, 2010) and before accession of Slovakia to the EU,
- in the rest years, since accession of Slovakia to the EU, positive profit/ loss was achieved,
- after accession of Slovakia to the EU income has an increasing tendency also due to the support policy, except 2009 and 2010 years, when revenues grew more slowly than costs.
The support to the agriculture had slightly increasing tendency in the most years. In
2011, the support achieved almost € 900 million. The decisive components in the structure of support were (table 2):
- Rural development support – it accounted for 46 %, - Direct payments – it accounted for 41%,
266 266 266 266 266
Table 2. Structure and development of subsidies for agriculture in the years 2004 – 2011, in mil. €
Tabuľka 2. Štruktúra a vývoj podpôr do poľnohospodárstva v rokoch 2004-2011 v mil. €
Type of support 2004 2005 2006 2007 2008 2009 2010 2011
Market oriented expenditures 10.6 127.2 30.9 7.7 7.1 39.8 13.6 13.1 Intervention measures 0.0 0.0 111.2 0.0 0.0 0.0 0.0 0.0 Direct payments 239.9 215.2 229.6 242.1 370.4 364.1 337.6 365.2 Rural development (out of SAPARD) 87.1 187.0 251.9 295.7 273.6 433.5 481.1 408.5 Operational Programme Fisheries 0.0 0.0 0.0 0.0 0.0 0.5 2.0 1.7 State aid. national payments 11.0 10.1 16.4 9.8 9.1 22.4 18.9 7.9 SAPARD Programme 50.4 54.2 19.9 0.0 0.0 0.0 0.0 0.0 General services directly from the
budgetary chapter of the MARD SR 66.5 81.2 79.9 76.7 92.9 86.4 97.6 93.8
PHARE Programme 0.5 2.1 1.3 0.0 0.0 0.0 0.0 0.0
Total 465.9 676.9 741.1 633.9 754.8 946.8 950.8 890.2
Note.: Rural development – Sectoral Operational Programme Agriculture and Rural Development 2004 – 2006, the Rural Development Plan and the Rural Development Programme 2007 – 2013
Source: Ministry of Agriculture and Rural development of the Slovak republic
Profit or loss or business income of the agriculture
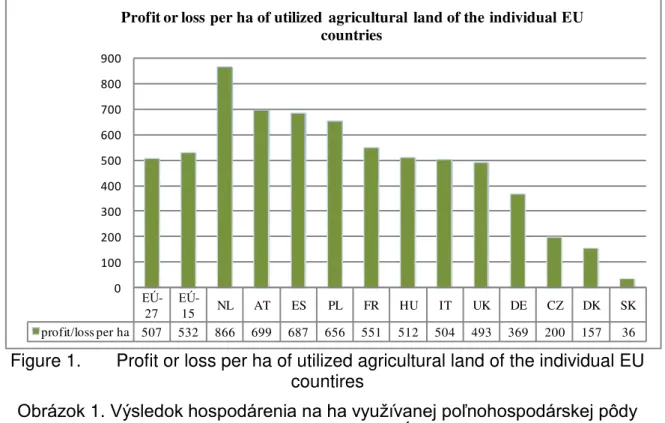
Figure 1. Profit or loss per ha of utilized agricultural land of the individual EU countires
Obrázok 1. Výsledok hospodárenia na ha využívanej poľnohospodárskej pôdy
jednotlivých krajín EÚ (Source: Eurostat, April 2013)
EÚ -27
EÚ
-15 NL AT ES PL FR HU IT UK DE CZ DK SK
profit/loss per ha 507 532 866 699 687 656 551 512 504 493 369 200 157 36 0
100 200 300 400 500 600 700 800 900
Profit or loss per ha of utilized agricultural land of the individual EU countries
267 267 267 267 267
Profit or loss per ha of utilized agricultural land of the individual EU countries was considerably variable. Despite the fact, that Slovak agriculture has posted a positive profit in 2011, its value was 14.1-fold lower than the EU-27 average and Slovakia
reached € 36 per ha. In the Czech Republic profit or loss per hectare has reached €
200. Slovak agriculture is unable to produce adequate levels of long-term profits, thereby ensuring competitiveness within the global market of the European Union (figure 1).
Gross value added, net value added
In terms of GVA formation, Slovak agriculture has reached the lowest level compare to all member countries of the EU-27. The GVA level has reached € 282 per ha of utilized agricultural land, what represented only half level of the gross value added of the EU-12 (532 € per ha of agr. land). The highest level of gross value added
Slovakia achieved in the year of accession of Slovakia to the European Union. Situation in 2011 is described in the figure 2.
Figure 2. Gross value added and net value added per ha of utilized agricultural land by the individual EU countries (Source: Eurostat, April 2013)
Obrázok 2. Hrubá a čistá pridaná hodnota na ha využívanej poľnohospodárskej pôdy
v jednotlivých krajináchEÚ
Gross agricultural output
The development of gross agricultural output in Slovakia is marked by the faster decrease in animal production than crop production and the change in production structure, especially after EU accession. While before accession, animal production was dominant, vice versa, after accession crop production was dominant.
EÚ-27EÚ-15 NL IT DK FR AT DE ES UK HU PL CZ SK GVA per ha 900 1044 4290 1957 1055 1036 1027 914 901 629 624 616 407 282
NVA per ha 555 620 2542 914 522 655 446 425 701 462 427 514 234 136 0
500 1000 1500 2000 2500 3000 3500 4000 4500 5000
Gross value added and net value added
per ha of utilized agricultural land by the individual EU countries
268 268 268 268 268
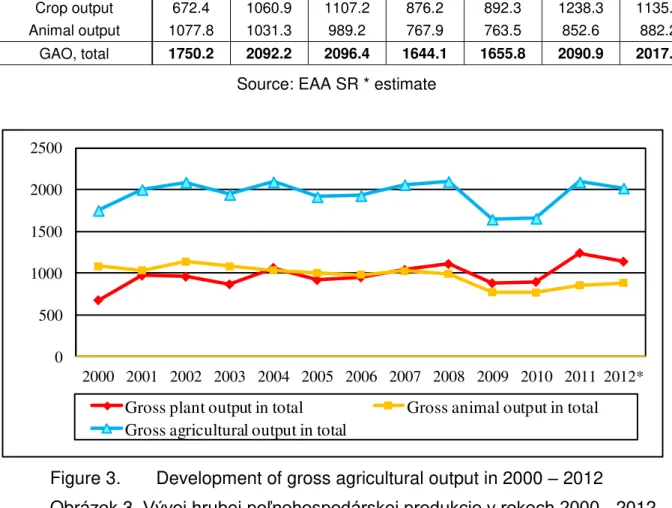
Table 3. Development of Gross agricultural output (GAO) in mil. €, in current prices Tabuľka 3. Vývoj hrubej poľnohospodárskej produkcie (HPP) v mil. €, v bežných
cenách
GAO 2000 2004 2008 2009 2010 2011 2012*
Crop output 672.4 1060.9 1107.2 876.2 892.3 1238.3 1135.5 Animal output 1077.8 1031.3 989.2 767.9 763.5 852.6 882.2
GAO, total 1750.2 2092.2 2096.4 1644.1 1655.8 2090.9 2017.7
Source: EAA SR * estimate
Figure 3. Development of gross agricultural output in 2000 – 2012 Obrázok 3. Vývoj hrubej poľnohospodárskej produkcie v rokoch 2000 - 2012
Gross agricultural output in Slovakia recorded the largest drop in 2009 and 2010. Compared to the previous year the decline has represented almost 20 %. It is estimated, that GAO will not reach pre-crisis levels in 2012, it is assumed that GAO
will reach the level about € 2018 million (table 3, figure 3).
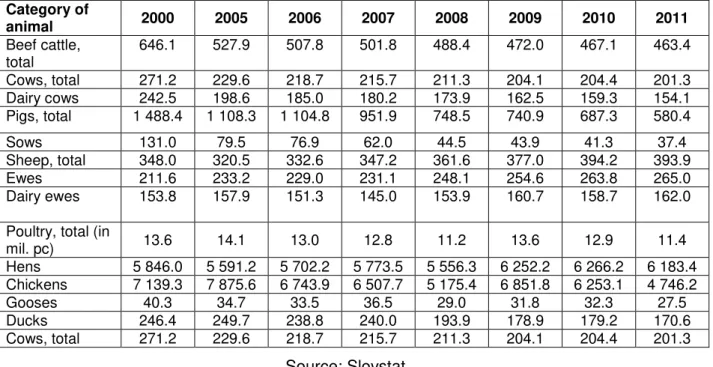
Number of farm animals in the Slovak Republic
Decline in livestock production was due to the decrease in almost all categories of animals, except sheep and hens, which number has grown. The sharpest decline over this period was observed in case of pigs, where number of pigs was decreased by 60 % (sows by 70 %). The number of beef cattle had also decreasing tendency and the decline in 2011 compared to 2000 represented 30 % (dairy cows 40 %) (table 4).
0 500 1000 1500 2000 2500
2000 2001 2002 2003 2004 2005 2006 2007 2008 2009 2010 2011 2012*
Gross plant output in total Gross animal output in total Gross agricultural output in total
269 269 269 269 269
Table 4. Number of farm animals in the Slovak Republic, in thousand heads Tabuľka 4. Vývoj stavov hospodárskych zvierat na Slovensku v tis. ks
Category of
animal 2000 2005 2006 2007 2008 2009 2010 2011
Beef cattle, total
646.1 527.9 507.8 501.8 488.4 472.0 467.1 463.4
Cows, total 271.2 229.6 218.7 215.7 211.3 204.1 204.4 201.3 Dairy cows 242.5 198.6 185.0 180.2 173.9 162.5 159.3 154.1 Pigs, total 1 488.4 1 108.3 1 104.8 951.9 748.5 740.9 687.3 580.4
Sows 131.0 79.5 76.9 62.0 44.5 43.9 41.3 37.4
Sheep, total 348.0 320.5 332.6 347.2 361.6 377.0 394.2 393.9
Ewes 211.6 233.2 229.0 231.1 248.1 254.6 263.8 265.0
Dairy ewes 153.8 157.9 151.3 145.0 153.9 160.7 158.7 162.0
Poultry, total (in
mil. pc) 13.6 14.1 13.0 12.8 11.2 13.6 12.9 11.4
Hens 5 846.0 5 591.2 5 702.2 5 773.5 5 556.3 6 252.2 6 266.2 6 183.4 Chickens 7 139.3 7 875.6 6 743.9 6 507.7 5 175.4 6 851.8 6 253.1 4 746.2
Gooses 40.3 34.7 33.5 36.5 29.0 31.8 32.3 27.5
Ducks 246.4 249.7 238.8 240.0 193.9 178.9 179.2 170.6 Cows, total 271.2 229.6 218.7 215.7 211.3 204.1 204.4 201.3
Source: Slovstat
Development of harvested crop area in the Slovak Republic
The harvested area of almost all crops decreased, except areas of maize and oilseeds. Compared to 2000, the most significant decrease was observed in case of potatoes (by 60 %) as well as in case of sugar beet (by 43%). The harvested area of cereals decreased by 9 % (mainly rye area by 60 %, barley area by 32 % and oats area by 28 %) (table 5).
Table 5. Development of harvested crop area in the Slovak Republic, in thousand ha Tabuľka 5. Vývoj zberových plôch plodín v Slovenskej republike v tis. ha
Crops 2000 2005 2006 2007 2008 2009 2010 2011
Cereals, total 812.4 794.6 732.9 784.4 799.4 768.7 683.3 741.5 Wheat 405.2 373.0 349.1 360.7 373.7 379.2 342.1 362.8 Barley 199.4 204.2 184.5 209.9 213.1 195.8 133.0 135.7
Rye 31.5 24.2 12.5 20.7 25.9 19.6 15.9 13.0
Oat 20.9 19.2 19.5 20.8 17.0 15.9 14.8 15.2
Maize 145.0 154.1 151.0 157.3 154.2 144.2 166.6 202.0 Industrial sugar
beet 31.7 33.2 27.7 18.9 11.1 16.0 17.9 18.1
Potatoes 27.1 19.1 18.4 17.8 14.3 11.6 11.0 10.4
Oil crops 173.9 213.5 250.4 231.4 249.3 267.7 267.0 257.4
Source: Slovstat
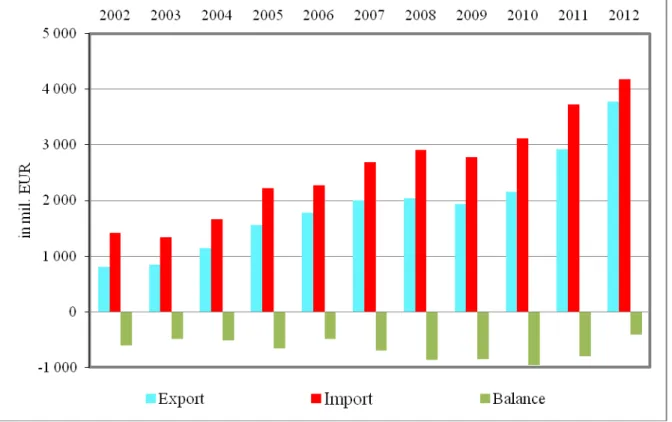
Agri-food foreign trade in the Slovak Republic
Development of agri-food foreign trade is annually characterized by a negative
balance. It means that the value of export is lower than the value of import. The value
270 270 270 270 270
of foreign trade negative balance reached the highest value in 2008 -2011.
Table 6. Development of the agri-food foreign trade of the SR, in mil. €
Tabuľka 6. Vývoj agropotravinárskeho zahraničného obchodu SR, v mil. €
2002 2003 2004 2005 2006 2007 2008 2009 2010 2011 2012
Export 802.0 843.7 1 142.5 1 556.3 1 779.0 1 999.8 2 036.8 1 932.8 2 162.0 2 918.6 3 773.4
Import 1 415.5 1 341.6 1 663.6 2 222.0 2 274.1 2 694.2 2 908.5 2 782.2 3 119.9 3 723.2 4 182.9 Balance -613.5 -497.9 -521.2 -665.7 -495.2 -694.4 -871.7 -849.4 -957.9 -804.5 -409,5
Source: Slovstat
In 2012, value was reduced in half. The opposite situation was observed in the balance of trade in agricultural products, particularly in the last three years, where export is higher than import, which is unfavourable for the SR in terms of resource base for the food industry as well as the employment (table 6, figure 4).
Figure 4. Development of agri-food foreign trade of the Slovak Republic
Obrázok 4. Vývoj agropotravinárskeho zahraničného obchodu v Slovenskej republike
Source: Slovstat
271 271 271 271 271
Part: Social challenges of sustainable agriculture
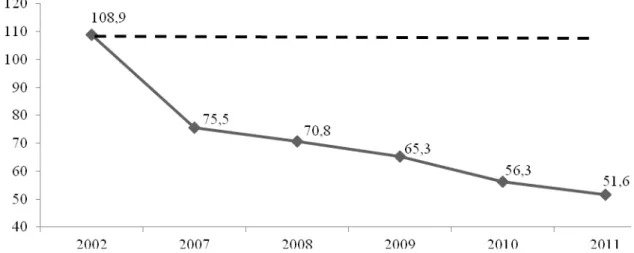
The employment in agriculture
In Slovakia, the number of persons working in agriculture has a decreasing tendency.
Table 7. Development of employment in agriculture, in thousand
Tabuľka 7. Vývoj počtu pracujúcich v poľnohospodárstve v tis. osôb
2000 2004 2007 2008 2009 2010 2011
115,2 67.0 75.5 70.8 65.3 56.3 51.6
Source: Slovstat
There were 108.9 thousand persons working in agriculture in 2002. In 2011, the number of workers has been reducing more than half, at 51.6 thousand. The cause of the decline in employment consists in the strong run-down of agricultural
production, combined with sales crisis in the domestic market, transformation, dissolution of non-agricultural activities and consequently low rate of diversification activities as well as salary unattractiveness (table 7, figure 5).
Figure 5. Development of employment in agriculture, in thousand
Obrázok 5. Vývoj počtu pracujúcich v poľnohospodárstve v tis. osôb
In terms of age structure, the strongest age group in 2002 – 2004 was a group of workers aged 40 – 49 years. Since 2005, group of workers aged 50-59 years is dominant and in 2011, this group makes up almost 40.3 % of all workers in
agriculture. In the long run (since 2000) in the age structure of workers of all ages a drop in number of persons occurred, with the exception of category 60 and over, in which the number of workers slightly increased.
272 272 272 272 272
Part: Environmental challenges of sustainable agriculture
Environmental challenges are focused on improving the environment and landscape and their aim is to create multifunctional agricultural and forestry systems with
positive impacts on the environment, nature and landscape. Support is focused on the diversity of plant and animal species, improvement of water quality, improvement of agricultural and forest soil and mitigation of climate changes effects.
Table 8. Land area in Slovakia (hectares) Tabuľka 8. Výmera pôdy SR (v ha)
Indicator 2010 2011 Index
2011/2010
Agricultural land 1 921 961 1 929 698 100,40
of that: arable land 1 354 436 1 358 423 100,29
permanent crops 23 468 22 132 94,31
other area including gardens 31 028 31 372 101,11
permanent meadows and pastures 513 029 518 230 101,01
Source: Statistical Office of the Slovak Republic SR; Report on Agriculture and Food industry in the Slovak Republic 2011 (Green Report)
The largest area of agricultural land in Slovakia covers arable land (70,4 %),
permanent meadows and pastures have 26,9 % of agricultural land and the smallest area have gardens 1,6 % and permanent crops only 1,1 % (table 8).
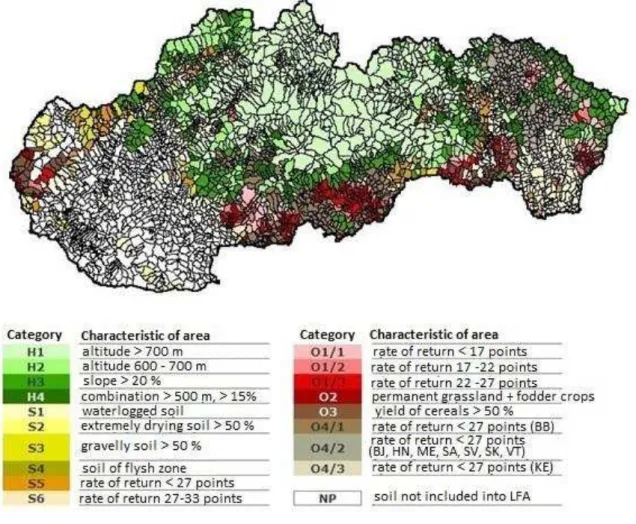
Less Favoured areas
Slovakia is mostly mountainous country with a high share of low productive soils and soils affected by specific handicaps like waterlogged soil, sandy soil or gravelly soil. LFA represent an area 1 245 540 hectares, i.e. 65 % of agricultural land, from which the largest area have mountain areas, 25 % of agricultural land. Other less favoured areas cover 21 % and areas affected by specific constraints 19 % of agricultural land area. Less favoured areas are continuous territorial units, in which the influence of unfavourable conditions, altitude, slope and low soil fertility and other unfavourable natural conditions eventually in connection with specific local economic and social conditions the costs per unit of production in agricultural production lasted above-average. Continuing agricultural activities in worse natural conditions is the basic assumption for maintaining of settlement in these areas with acceptable incomes of rural population in the extent to fulfil its landscape, environmental and social
functions in compliance with the set conditions (table 9, figure 6).
273 273 273 273 273
Table 9. Cumulative data of LFA measures implementation in Slovakia at the end of 2011
Tabuľka 9. Kumulatívne údaje o implementácii opatrení LFA v SR ku koncu r. 2011
Type of area Number of
supported farms
Supported area (hectares)
% of agricultural land in Slovakia
Mountain areas 2 875 472 829 25
Other less favoured areas 1 618 413 457 21
Areas affected by specific constraints 1 618 359 254 19
Total 6 111 1 245 540 65
* Sum does not include double counting of farms, which are farming in both classified areas Source: Section of direct subsidies APA, Annual Progress Report for RDP 2007-2013 for
2011
Figure 6. Image of Less Favoured Areas in Slovakia
Obrázok 6. Zobrazenie znevýhodnených oblastí na Slovensku
Agri-environmental support
Agri-environmental support integrates agricultural and environmental policies targeted to the greening of agricultural land management, protection of the
fundamental components of the environment, mitigating climate change, preserving biodiversity, natural and cultural heritage.
274 274 274 274 274
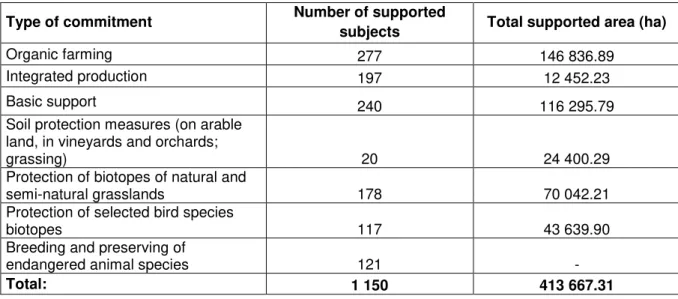
Table 10. Area supported under sub-measures within the measure “Agri
-environmental payments” (as of 31 December 2011)
Tabuľka 10. Výmera podporovaných plôch podľa jednotlivých podopatrení v rámci
agroenvironmentálnych platieb (ku koncu r. 2011)
Type of commitment Number of supported
subjects Total supported area (ha)
Organic farming 277 146 836.89
Integrated production 197 12 452.23
Basic support 240 116 295.79
Soil protection measures (on arable land, in vineyards and orchards;
grassing) 20 24 400.29
Protection of biotopes of natural and
semi-natural grasslands 178 70 042.21
Protection of selected bird species
biotopes 117 43 639.90
Breeding and preserving of
endangered animal species 121 -
Total: 1 150 413 667.31
Source: Division of Direct Payments of the APA, Annual Progress Report on the RDP SR 2007 – 2013 for the year 2011
In cumulative terms, in the period 2007-2011, the area covering 146836.89 hectares
of agricultural land in Slovakia was supported within the sub-measure“Organic
farming”. It isthe most widely applied sub-measurewithinthe measure “
Agri-environmental payments”. The secondmost widely appliedsub-measurewas “Basic
support” that incumulative terms,in the years2007 – 2011, covered 116 295.79 ha.
“Basicsupport” sub-measure specifies management requirements forarableland
and permanent grassland, which represent a transitionbetweenstandard
requirements of CrossCompliance (GAEC, SMR) considering the national legislation
of the Slovak Republic and management practices of organic farming. In short, it is a
stage of extensive productiononarable landandpermanentgrassland(limits on
consumption of fertilizersand banned application of specifiedgroupsof pesticides).
“Basicsupport” sub-measurehas a horizontalscopein order to protectandimprove
a quality of water resources and was targeted tovulnerableareas preferably.
“Integrated production” sub-measure(orchards, vineyardsandvegetables) recorded
the lowest supportedarea in comparison with other sub-measures of “Agri
-environmental payments” measure, incumulative terms12452.23 ha. Integrated
production isan intermediate step of environmentally friendlypracticesbetween
standard land management satisfying CrossCompliance conditions (considering the
national legislation of the Slovak Republic too)and organic farming. Soil protection
measures (protection against erosion onarable land, in vineyards andorchards;
grassing of arable land) in Slovakia were applied to thetotalarea of24400.29 ha of agricultural land. Nearlyhalf of the agricultural land in Slovakia is threatened by
potential water erosion. The totalareasupported,incumulative termsfrom 2007 to
2011, under the sub-measure“Protection of biotopes of natural and semi-natural
grasslands” reached70042.21ha. Under the sub-measure “Protection of selected
bird species biotopes” the total area of 43 639.90 ha was supported in the period
2007 – 2011. The support was granted to farmers applying specificmanagement of
275 275 275 275 275
agricultural land (arable land andpermanent grassland) in Natura2000 (SPA) areas
with the occurrence of selectedspecies of birds (Table 10).
There are two types of the NATURA 2000 areas:
1. The Sites of Community Importance (SCIs)– the area of the SCIs on agricultural land is 42 322 hectares. The SCI areas within the 4th and 5th degree of nature protection are eligible for the support under the measure since the beginning of the program implementation, and their area is 3707 hectares.
2. The Special Protection Areas (SPAs)– at the end of 2010 the total area of the declared SPAs on agricultural land represents 292 193.73 hectares, on this area there are 36 SPAs.
Support for specific methods of management in Natura 2000 sites should contribute to sustainable development with the aim to protect the natural environment and landscape, with the impact on: biodiversity, conservation of high nature value areas (HNV), water quality, and to prevent climate change.
Biomass production as important aspect of struggle against climate change
Slovak Republic committed to achieve 14 % of consumption from renewable energy sources (RES) by 2020. The share of renewable energy sources of primary energy consumption was just around 9.5 % in the year 2010.
Table 11. Development of renewable energy production originated in agriculture and forestry in the years 2007-2011 in Slovak Republic (in ktoe)
Tabuľka 11. Vývoj produkcie obnoviteľnej energie z poľnohospodárstva a lesníctva v rokoch 2007-2011 v Slovenskej republike (v ktoe)
Indicator 2007 2008 2009 2010 2011
Biodiesel 40,65 129,02 89,25 77,77 79,53*
Bioethanol 15,05 47,15 59,19 63,70 65,21
Biofuels production from agriculture 55,70 176,17 148,44 141,47 144,74
Wood biomass 484,00 502,00 647,00 740,00 n.a.
Note: *forecast
Source: EurObserv'ER
In Slovakia the production of biodiesel almost doubled during years 2007-2011 and bioethanol production increased more than quadruple (433 %). Total renewable energy production derived from agricultural crops reached level of 145 ktoe that is growth by 260 % (Table 11) compared to the year 2007.
Discussion
In order to increase the competitiveness of Slovak agriculture and viability of Slovak farms it is needed to restructure farms in Slovakia that are facing serious structural problems, in appropriate manner. Low market participation and low rate of
agricultural activities diversification are regarded as structural problems. In this
276 276 276 276 276
context, it is also necessary to support generation renewal in agriculture, therefore to support especially young farmers.
Support in this regard it is needed to refer to material and / or nonmaterial investments, which improve the overall performance of the farm, relating to the processing, market introduction and / or development of agricultural products.
For ensuring the balance of the three dimensions of sustainable agriculture we must: analyse and characterize exactly in which real state are found,
seek to find a compromise solution for their mutual balanced connection, use of natural resources, respectively production potential in the way, that not
violate the natural fertility of soil,
ensure the protection of nature and landscape in accordance with EU regulations,
form better living conditions in rural areas,
increase the employment opportunities of workers in agriculture i.e. creating family farms, small farms, encourage the establishment of new farms, for example through forming appropriate credit conditions for start of production, the orientation of support policies to increase the interest of young farmers to begin farming,
find the optimal level of farming to ensure the production for another
agricultural use, let´s say for food production purposes and biomass use, focus of financial stimulus into innovations and mutual cooperation,
increase of local and domestic production and consumption of local products for transport costs reduction, lower energy costs and pollution,
further agricultural policy should be aimed to the maintenance of agricultural
activities also in LFA and compensation of farmers’ income for environmental
services.
Acknowledgements
VEGA 1/0513/12: Agroecosystems research for climate change mitigation, production of bioproducts, improvement of nutritional and health parameters of population.
References
Annual Progress Report on the RDP SR 2007-2013 for the year 2011. (2012) Bratislava: RIAFE and EuroConsulting.
EurObserv'ER Barometers. [Online]. European Commission. Available at: http://www.eurobserv-er.org/. [Accessed: 20 May 2013].
Eurostat. [Online]. European Commission. Available at:
http://epp.eurostat.ec.europa.eu/portal/page/portal/eurostat/home/. [Accessed: 20 May 2013].
277 277 277 277 277
Lacko-Bartošová, M. et al. (2005) Udržateľné aekologické poľnohospodárstvo. Nitra: SPU.
Rural Development Programme of the Slovak Republic 2007 – 2013 (version 3 valid from 4 March 2010). [Online]. Bratislava: Ministry of Agriculture and Rural Development of the Slovak Republic. Available at:
http://www.mpsr.sk/en/index.php?navID=7&id=30. [Accessed: 20 May 2013].
Report on Agriculture and Food industry in the Slovak Republic 2011 : Green Report 2011). Bratislava: Ministry of Agriculture and Rural Development of the Slovak Republic, 2012.
Slovstat. [Online]. Bratislava: Štatistický úrad Slovenskej republiky. Available at: http://portal.statistics.sk/showdoc.do?docid=4. [Accessed: 20 May 2013] Stehlo,P., Buday, Š. (2005) Poľnohospodárstvo –súčasť ochrany životného
prostredia a trvalo udržateľného rozvoja. Bratislava: RIAFE. Stehlo, P., Buday, Š. (2007) Stratégia multifunkčného trvalo udržateľného
poľnohospodárstva. Agricultural Economics, 7, 2007, 1, pp. 27 – 38.
278 278 278 278 278