www.clim-past.net/10/551/2014/ doi:10.5194/cp-10-551-2014
© Author(s) 2014. CC Attribution 3.0 License.
Climate
of the Past
Evaluation of modern and mid-Holocene seasonal precipitation of
the Mediterranean and northern Africa in the CMIP5 simulations
A. Perez-Sanz1,2, G. Li2, P. González-Sampériz1, and S. P. Harrison2,3
1Pyrenean Institute of Ecology, (IPE)-CSIC, Avda Montañana 1005, 50059 Zaragoza, Spain 2Department of Biological Sciences, Macquarie University, North Ryde, NSW 2109, Australia
3Centre for Past Climates and Department of Geography & Environmental Sciences, School of Archaeology,
Geography and Environmental Sciences, (SAGES) University of Reading, Whiteknights, Reading, RG6 6AB, UK
Correspondence to:A. Perez-Sanz ([email protected]; [email protected]) Received: 7 August 2013 – Published in Clim. Past Discuss.: 17 September 2013 Revised: 4 February 2014 – Accepted: 6 February 2014 – Published: 20 March 2014
Abstract. We analyse the spatial expression of seasonal climates of the Mediterranean and northern Africa in pre-industrial (piControl) and mid-Holocene (midHolocene, 6 yr BP) simulations from the fifth phase of the Coupled Model Intercomparison Project (CMIP5). Modern observa-tions show four distinct precipitation regimes characterized by differences in the seasonal distribution and total amount of precipitation: an equatorial band characterized by a double peak in rainfall, the monsoon zone characterized by summer rainfall, the desert characterized by low seasonality and total precipitation, and the Mediterranean zone characterized by summer drought. Most models correctly simulate the posi-tion of the Mediterranean and the equatorial climates in the
piControl simulations, but overestimate the extent of mon-soon influence and underestimate the extent of desert. How-ever, most models fail to reproduce the amount of precipita-tion in each zone. Model biases in the simulated magnitude of precipitation are unrelated to whether the models repro-duce the correct spatial patterns of each regime. In the mid-Holocene, the models simulate a reduction in winter rain-fall in the equatorial zone, and a northward expansion of the monsoon with a significant increase in summer and au-tumn rainfall. Precipitation is slightly increased in the desert, mainly in summer and autumn, with northward expansion of the monsoon. Changes in the Mediterranean are small, al-though there is an increase in spring precipitation consistent with palaeo-observations of increased growing-season rain-fall. Comparison with reconstructions shows most models underestimate the mid-Holocene changes in annual precip-itation, except in the equatorial zone. Biases in thepiControl
have only a limited influence onmidHoloceneanomalies in ocean–atmosphere models; carbon-cycle models show no re-lationship betweenpiControlbias andmidHolocene anoma-lies. Biases in the prediction of the midHolocenemonsoon expansion are unrelated to how well the models simulate changes in Mediterranean climate.
1 Introduction
the simulation of climate changes is realistic. However, the evaluation of model performance in the geologic past does provide a way of making such an assessment (Braconnot et al., 2012; Schmidt et al., 2014a).
The mid-Holocene (MH, 6000 yr BP) provides an opportu-nity to examine climate-model performance in the Mediter-ranean region. Palaeoenvironmental evidence suggests that the Mediterranean was wetter than today during the mid-Holocene. Lake levels across the region were higher than present (Kohfeld and Harrison, 2000; Magny et al., 2002; Roberts et al., 2008), indicating a more positive balance between precipitation and evaporation. Speleothem records also indicate increased precipitation compared to present (Roberts et al., 2011). The observed expansion of deciduous trees (Prentice et al., 1996; Roberts et al., 2004; Carrión et al., 2010) across the region indicates that there was a change in rainfall seasonality with increased summer rainfall (Pren-tice et al., 1996). The observed decrease of fires in lowland areas, coupled with an increase in fires at higher elevations, is consistent with more humid conditions – which would sup-press fires in already forested lowland regions but allow them to increase as forests expanded into higher elevation areas (Vannière et al., 2011). The changes in climate were spa-tially complex (Roberts et al., 2011), but pollen-based cli-mate reconstructions (e.g. Cheddadi et al., 1997; Davis et al., 2003; Bartlein et al., 2011) show that most of the Mediter-ranean region was characterized by a year-round decrease in temperature and an increase in plant-available moisture.
Systematic comparisons with observations have shown that global climate models are unable to reproduce the ob-served MH patterns of rainfall changes in the Mediter-ranean. In particular, they do not show a sufficiently large increase in summer rainfall to explain the shift towards deciduous vegetation. This was identified as a problem in atmosphere-only simulations of the mid-Holocene made dur-ing the first phase of the Palaeoclimate Modelldur-ing Intercom-parison Project (PMIP1; see e.g. Masson et al., 1999; Guiot et al., 1999; Bonfils et al., 2004). Coupled ocean–atmosphere simulations made during PMIP2 were able to simulate the types of climate changes seen in the Mediterranean, but the geographic placement of these climate types, the spa-tial extent and the magnitude of the changes were not well captured (Brewer et al., 2007). In particular, the simulated changes in precipitation are small and insufficient to explain the observed expansion of deciduous forests in the region.
The Mediterranean climate involves a complex interac-tion between different processes acting at several different spatio-temporal scales (Xoplaki et al., 2003; Luterbacher et al., 2006; CLIVAR, 2010; Lionello, 2012). However, inter-annual variability in Mediterranean summer precipitation is linked to variability in the strength of the Afro–Asian mon-soon system (Rodwell and Hoskins, 2001; Raicich et al., 2003; Gaetani et al., 2011). Analyses of climate model sim-ulations of the present day suggest that Mediterranean sum-mer precipitation is suppressed during years when the Afro–
Asian monsoon system is strong. This results from intensi-fication of the Hadley cell and enhanced subsidence in the subtropics (i.e. strengthening of the Azores High), leading to high pressure over the eastern Mediterranean which results in decreased rainfall (Gaetani et al., 2011). However, when monsoon intensification is accompanied by northward move-ment of the intertropical convergence zone, as model simu-lations indicate occurred in the mid-Holocene (Braconnot et al., 2007a; Marzin and Braconnot, 2009), the Azores High is also displaced northeastward and weakened (e.g. Harrison et al., 1992). This has been shown to have a significant im-pact on precipitation in eastern North America (Forman et al., 1995; van Soelen et al., 2012) and could potentially lead to increased summer rainfall in the Mediterranean region.
The PMIP2 simulations show a significant enhancement and northward expansion of the African monsoon during the mid-Holocene in response to changes in insolation forc-ing (Braconnot et al., 2007a). However, comparisons with pollen-based estimates of the change in mean annual precip-itation (Joussaume et al., 1999; Bartlein et al., 2011) show that the models underestimate the increase in precipitation by between 20 and 50 % (Braconnot et al., 2007a, 2012). Most models fail to produce a sufficient northward expan-sion of the monsoon. This underestimation of monsoon ex-pansion is also present in the CMIP5 (Coupled Model In-tercomparison Project) MH simulations (see e.g. Harrison et al., 2013). It is possible that this bias in the simulation of the African monsoon is linked to the failure to simulate the MH Mediterranean climate accurately, since larger shifts in the position of the monsoon are produced by models incorporat-ing land-surface feedbacks and/or with higher spatial resolu-tion (Levis et al., 2004; Wohlfahrt et al., 2004; Bosmans et al., 2012).
MH model simulations, made with the same models that are used for future projections, have been made as part of the fifth phase of the CMIP5 (Taylor et al., 2012) and are being analysed as part of the third phase of the Palaeoclimate Modelling Intercomparison Project (PMIP3; Bracconnot et al., 2012).
monsoon and Mediterranean precipitation, in MH Mediter-ranean climate changes.
In this study, we examine the performance of the CMIP5 models for modern and MH climates, and compare the sim-ulated climates with modern and palaeo-observations. This allows us to assess whether biases in the control simulations influence the MH simulations and to investigate whether re-gional biases in the simulation of MH monsoon changes influence model performance in the Mediterranean.
2 Methods
We present analyses of the pre-industrial (piControl) and MH (midHolocene) made by 12 coupled ocean–atmosphere mod-els from the fifth phase of the CMIP5. In order to investigate whether biases in the control simulation influence the real-ism of themidHolocene climates, we first evaluate the pi-Controlsimulation. We use modern observations from the CRU TS3.1 data set, in the absence of climate reconstruc-tions from northern African for thepiControl interval. The
piControl simulation is driven by boundary conditions ap-propriate for 1850 AD, but comparisons with a subset of tran-sient historical simulations show that the spatial patterns and magnitudes of seasonal climates are very similar. In order to evaluate whether models capture the spatial expression of specific seasonal patterns, we define a number of climate types using the modern observations and apply these defini-tions to delimit these climate types in thepiControland mid-Holocenesimulations. We evaluate themidHolocene simula-tions using quantitative climate reconstrucsimula-tions derived from pollen records. Although there are many kinds of palaeo-records that indicate that northern Africa and the circum-Mediterranean region were wetter during the mid-Holocene, including e.g. lake-level and archaeological records, these other sources of information do not provide quantitative es-timates of the change in precipitation. Comparisons of simu-lated and observed climates are based on the simusimu-lated pre-cipitation both within climate zones and within geographic zones.
2.1 Data sources: CMIP5 simulations
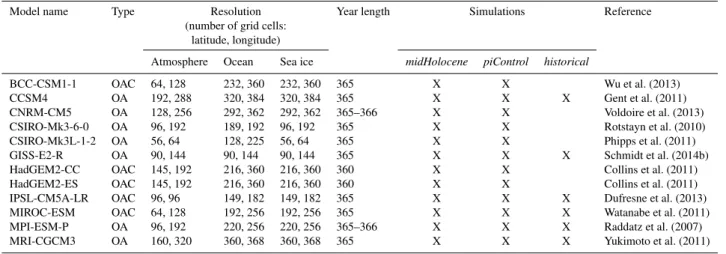
We examine precipitation changes between a mid-Holocene (midHolocene, 6000 yr BP) equilibrium simulation and a control simulation representing pre-industrial conditions ( pi-Control) using 12 models from the fifth phase of the CMIP5. Both themidHoloceneandpiControl are equilibrium simu-lations. We use themidHoloceneandpiControlsimulations in the CMIP5 (http://cmip-pcmdi.llnl.gov/cmip5/dataportal. html) archive as of 15 August 2012 (Table 1). Seven of these simulations are made with ocean–atmosphere (OA) models, and the other 5 models include an interactive carbon cycle (OAC). The piControl simulation has boundary conditions (insolation, greenhouse gas concentrations) appropriate for
1850 CE (common era). ThemidHoloceneexperiment shows the response to changes in the seasonal and latitudinal dis-tribution in insolation 6000 yr ago; greenhouse gas concen-trations are set atpiControl levels (for details of the exper-imental protocol see Taylor et al., 2012, and Braconnot et al., 2012). To assess whether thepiControlstate differs from recent observed climates, we used outputs from a histori-cal simulation (historical: 1850–2005 CE) available for six of the models. Thehistoricalsimulation is forced by time-varying changes in solar, volcanic, and greenhouse gases (Taylor et al., 2012; Braconnot et al., 2012).
The output from each model was interpolated to a common grid (0.5◦) using bilinear interpolation to facilitate compar-isons and the calculation of zonal averages. Long-term mean monthly, seasonal, and annual precipitation values were ob-tained by averaging the last 100 yr of thepiControland mid-Holocene simulations, except in the case of HADGEM2-CC where only 35 yr ofmidHolocenesimulated outputs are available. Long-term means of the sixhistoricalsimulations were obtained by averaging the last 30 yr of each simulation. All averages were areally weighted (by the area of the model grid cells).
2.2 Data sources: modern and mid-Holocene climate data
Observations of the modern climate are taken from the CRU TS3.1 data set (Harris et al., 2014), which provides monthly precipitation values on a 0.5◦ grid for the inter-val 1850–2006. We have created a monthly precipitation cli-matology using data from January 1961 through to Decem-ber 1990. Zonal averages are constructed by areally weight-ing the gridded values.
Bartlein et al. (2011) provide quantitative reconstructions of mean annual precipitation (MAP), expressed as anomalies from the present, from pollen and plant macrofossil records. The original site-based reconstructions were averaged to pro-vide gridded values on a 2◦×2◦ grid, and differences
be-tween the site reconstructions within each grid were used to provide an estimate of reconstruction uncertainty (as a pooled estimate of the standard error). The data set provides mid-Holocene estimates of MAP anomalies for 62 cells (out of a possible 397 cells) within the area of interest (latitude: 0–45◦N, longitude: 20◦W–30◦E).
2.3 Definition of climate regions
Table 1.Characteristics of the CMIP5 models used in these analyses.
Model name Type Resolution Year length Simulations Reference
(number of grid cells: latitude, longitude)
Atmosphere Ocean Sea ice midHolocene piControl historical
BCC-CSM1-1 OAC 64, 128 232, 360 232, 360 365 X X Wu et al. (2013)
CCSM4 OA 192, 288 320, 384 320, 384 365 X X X Gent et al. (2011)
CNRM-CM5 OA 128, 256 292, 362 292, 362 365–366 X X Voldoire et al. (2013)
CSIRO-Mk3-6-0 OA 96, 192 189, 192 96, 192 365 X X Rotstayn et al. (2010)
CSIRO-Mk3L-1-2 OA 56, 64 128, 225 56, 64 365 X X Phipps et al. (2011)
GISS-E2-R OA 90, 144 90, 144 90, 144 365 X X X Schmidt et al. (2014b)
HadGEM2-CC OAC 145, 192 216, 360 216, 360 360 X X Collins et al. (2011)
HadGEM2-ES OAC 145, 192 216, 360 216, 360 360 X X Collins et al. (2011)
IPSL-CM5A-LR OAC 96, 96 149, 182 149, 182 365 X X X Dufresne et al. (2013)
MIROC-ESM OAC 64, 128 192, 256 192, 256 365 X X X Watanabe et al. (2011)
MPI-ESM-P OA 96, 192 220, 256 220, 256 365–366 X X X Raddatz et al. (2007)
MRI-CGCM3 OA 160, 320 360, 368 360, 368 365 X X X Yukimoto et al. (2011)
“pastecs” to determine whether there was a significant “pit” or “peak” in any month. A pit or peak is considered signifi-cant if the probability of turning points occurring in a random series is<0.05, given by
(P (t )=2/n(t−1)!(n−1)!)
where n is the number of observations at time t (Ibanez, 1982).
We calculated the total precipitation in each season (spring: March, April, May; summer: June, July, August; autumn: September, October, November; winter: December, January, February) and for the whole year. A measure of seasonal concentration was calculated following Kelley et al. (2013), where the magnitude of precipitation in each month is represented by the length of a vector in the com-plex plane and the direction of the vector represents the tim-ing (with January set to 0◦). The length of the mean vector divided by the annual precipitation provides an index of sea-sonal concentration (C), where C is 1 when the precipitation is concentrated in a single month and 0 when it is evenly dis-tributed throughout the year.
We applied these definitions to determine the position of different precipitation regimes in thepiControland mid-Holocene simulations. Comparison of the observed limits and those identified in thepiControl allows us to examine (a) whether the models produce these distinctive precipita-tion regimes and (b) how well they simulate their placement independently of whether they simulate the correct magni-tude of precipitation. Comparison of thepiControland mid-Holocenelimits allows us to characterize shifts in precipita-tion regimes, again, independent of changes in precipitaprecipita-tion magnitude.
2.4 Analyses of the model simulations
We evaluate model performance for thepiControlsimulation in two steps. First we examine whether the models reproduce
the spatial extent of different precipitation regimes, and then we examine whether they reproduce the magnitude of total annual and of seasonal precipitation. Long-term means for the period 1961–1990 from the CRU TS3.1 data set (Harris et al., 2014) are compared with long-term averages for the last 100 yr of thepiControl. The standard deviation (SD) of the observations provides a measure of the significance of the difference between observations and simulations. We exam-ine the differences between simulated and observed climate for the latitude band corresponding to a given precipitation regime in the observations. We also compare the differences in the amount of precipitation for the geographic region iden-tified as falling within a specific precipitation regime in each model, which may be less/more extensive than the region identified in the observations.
We also examine the change in precipitation in the mid-Holocene in two steps. First we identify the spatial extent of each precipitation regime in themidHolocenesimulations and compare this with the spatial extent shown in the piCon-trolsimulation of the same model. This allows us to identify whether there have been shifts in the precipitation regimes. We then examine the magnitude of the precipitation change in the latitude band characterized by a specific regime in both thepiControland themidHolocenesimulations for each model. This allows us to identify whether there has been a change in precipitation in situ. We use the standard devia-tion of thepiControlsimulation for each model to determine whether the change betweenmidHoloceneandpiControlis significant.
the model-defined regions of these different rainfall regimes (e.g. the region where the simulated rainfall is of the mon-soon type). We use linear regression to examine the relation-ship between precipitation biases and anomalies for all mod-els, and for the OA and OAC classes of models.
The realism of the simulated change in precipitation ( mid-Holocene−piControl) is assessed by comparing with re-constructions of mean annual precipitation (MAP) from the Bartlein et al. (2011) data set. Comparisons are made by av-eraging the simulated precipitation for the grid cells where there are observations within each 5◦ latitude band. There are sufficient data in most of the 5◦ latitude bands to make robust comparisons.
3 Results
3.1 Modern observed climate
The modern climate of the region can be divided into four distinct latitudinal zones, differentiated by marked differ-ences in the seasonal distribution and amount of rainfall (Fig. 1). In the south, the equatorial band is characterized by high rainfall (∼1800 mm) throughout the year (Fig. 2)
but with peaks in precipitation in spring (∼460 mm) and
autumn (∼600 mm) and less rainfall in summer. This
pat-tern reflects the seasonal migration north and south of the intertropical convergence zone. The “double-peak” rainfall pattern (hereafter DP) occurs between 0 and 5◦N. The re-gion further north (5–20◦N) is characterized by summer
monsoonal rainfall and dry winters. The amount of rainfall declines progressively from ca. 650 mm in summer (June, July, August) in the south to less than 100 mm in the north. The desert area (20–30◦N) is characterized by low rainfall (<100 mm yr−1). There is no pronounced seasonal differ-entiation of rainfall in the desert, although southern regions tend to have slightly more rain in summer than winter and northern regions slightly more rainfall in winter than sum-mer. The Mediterranean zone (30–45◦N) is characterized by higher rainfall, increasing from 200 mm yr−1 in the south band to 780 mm yr−1 in the north. The rainfall is concen-trated in the winter half-year, with a pronounced summer drought.
3.2 piControlsimulations
These four rainfall regimes can generally be identified in the
piControlsimulations, although two of the models (CNRM-CM5, MRI-CGCM3) fail to reproduce the DP pattern in the equatorial zone. However, several models represent the spa-tial extent of the regimes poorly. Thus 5 out of the 12 mod-els show monsoon penetration further north than observed (Fig. 3a). Most models place the northern limit of the desert correctly, but two models (CSIRO-Mk3L-1-2, IPSL-CM5A-LR) show the area of low rainfall and low rainfall seasonality extending further north than observed.
● ● ●
● ●
●
● ● ●
● ●
●
0 50 100 150 200 250
300 Mediterranean
● ● ● ● ● ● ● ● ● ● ● ●
0 10 20 30 40 50
Precipitation (mm)
Desert
● ●
● ●
● ●
● ●
●
●
● ●
0 50 100 150 200 250 300
Monsoon
● ●
● ●
●
● ●
● ●
●
●
●
0 50 100 150 200 250 300
Double Peak
1 2 3 4 5 6 7 8 9 10 11 12
Month
Fig. 1.Observed seasonal cycle of precipitation in each of the de-fined climate zones, using the CRU T3.1 data set (Harris et al., 2014). The mean precipitation each month (mm) is shown by the black line, with the standard deviation shown by the bars. The grey shading shows the maximum and minimum rainfall experienced within the observation period (1961–1990). Note that the scale for the desert region differs from that used for the other regions. Months are numbered consecutively from January (1) through to December (12).
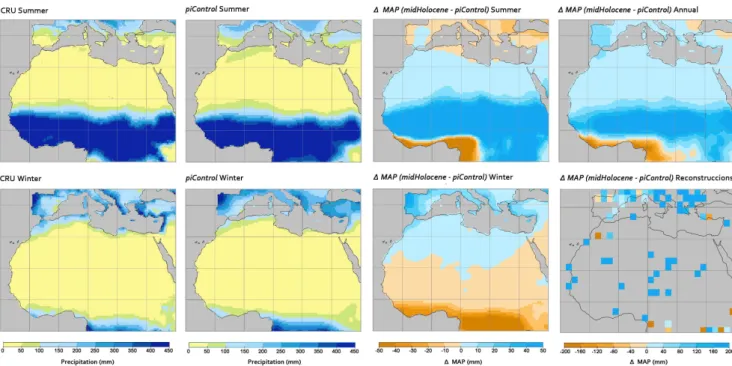
Fig. 2.Observed and simulated modern and palaeoprecipitation patterns. The total summer and winter precipitation from the CRU T3.1 data set (Harris et al., 2014) are compared to ensemble averages of thepiControloutputs of the 12 CMIP5 models. The simulated change in precipitation between the mid-Holocene andpiControlsimulations (midHolocene-piControl) is shown based on the ensemble average of the
midHoloceneoutputs of the 12 CMIP5 models. The observed anomalies in mean annual precipitation (MAP) between the mid-Holocene and
the present day are average values for 2◦×2◦grids from the Bartlein et al. (2011) data set.
● ● ● ● ● ● ● ● ● ● ● ● ● ● ● CRU BCC−CSM1.1 CCSM4 CNRM−CM5 CSIRO−Mk3−6−0 CSIRO−Mk3L−1−2 GISS−E2−R HadGEM2−CC HadGEM2−ES IPSL−CM5A−LR MIROC−ESM MPI−ESM−P MRI−CGCM3
0 200 400 600 800
Annual ● ● ● ● ● ● ● ● ● ● ● ● ● ● ●
0 50 100 150 200 250
Spring ● ● ● ● ● ● ● ● ● ● ● ● ● ● ●
0 50 100 150 200 250
Summer ● ● ● ● ● ● ● ● ● ● ● ● ● ● ●
0 50 100 150 200 250
Autumn ● ● ● ● ● ● ● ● ● ● ● ● ● ● ●
0 50 100 150 200 250
Winter Mediterr anean ● ● ● ● ● ● ● ● ● ● ● ● ● ● ● ● ● ● ● CRU BCC−CSM1.1 CCSM4 CNRM−CM5 CSIRO−Mk3−6−0 CSIRO−Mk3L−1−2 GISS−E2−R HadGEM2−CC HadGEM2−ES IPSL−CM5A−LR MIROC−ESM MPI−ESM−P MRI−CGCM3
0 20 40 60 80 100
● ● ● ● ● ● ● ● ● ● ● ● ● ● ● ● ● ● ●
0 10 20 30 40 50 60 70
● ● ● ● ● ● ● ● ● ● ● ● ● ● ● ● ● ● ●
0 10 20 30 40 50 60 70
● ● ● ● ● ● ● ● ● ● ● ● ● ● ● ● ● ● ●
0 10 20 30 40 50 60 70
● ● ● ● ● ● ● ● ● ● ● ● ● ● ● ● ● ● ●
0 10 20 30 40 50 60 70
Deser t ● ● ● ● ● ● ● ● ● ● ● ● ● ● ● ● ● ● CRU BCC−CSM1.1 CCSM4 CNRM−CM5 CSIRO−Mk3−6−0 CSIRO−Mk3L−1−2 GISS−E2−R HadGEM2−CC HadGEM2−ES IPSL−CM5A−LR MIROC−ESM MPI−ESM−P MRI−CGCM3
0 200 600 1000 1400
● ● ● ● ● ● ● ● ● ● ● ● ● ● ● ● ● ●
0 100 300 500 700
● ● ● ● ● ● ● ● ● ● ● ● ● ● ● ● ● ●
0 100 300 500 700
● ● ● ● ● ● ● ● ● ● ● ● ● ● ● ● ● ●
0 100 300 500 700
● ● ● ● ● ● ● ● ● ● ● ● ● ● ● ● ● ●
0 100 300 500 700
Monsoon ● ● ● ● ● ● ● ● ● ● ● ● ● CRU BCC−CSM1.1 CCSM4 CNRM−CM5 CSIRO−Mk3−6−0 CSIRO−Mk3L−1−2 GISS−E2−R HadGEM2−CC HadGEM2−ES IPSL−CM5A−LR MIROC−ESM MPI−ESM−P MRI−CGCM3
0 500 1000 2000
● ● ● ● ● ● ● ● ● ● ● ● ●
0 200 400 600 800 1000
● ● ● ● ● ● ● ● ● ● ● ● ● Precipitation (mm)
0 200 400 600 800 1000
● ● ● ● ● ● ● ● ● ● ● ● ●
0 200 400 600 800 1000
● ● ● ● ● ● ● ● ● ● ● ● ●
0 200 400 600 800 1000
Doub
le P
eak
Fig. 4.Comparison of simulated and observed mean annual and mean seasonal precipitation (mm) for each of the defined precipitation regimes (Mediterranean, desert, monsoon, double peak). The simulated precipitation (mean and standard deviation) is shown for both the climate zone as defined by the observations (solid line) and as defined in thepiControlsimulation itself (dotted line). The difference between these two lines for each model provides a measure of the degree to which incorrect placement of a given climate affects the zonal means. The grey bars represent one standard deviation of the mean annual and mean seasonal precipitation from observations. The seasons are defined as spring, summer, autumn and winter (as in Sect. 3.1).
are generally much smaller than the difference between the simulated and observed climate.
Comparison of the piControl with modern observations shows that most models fail to reproduce the magnitude of the precipitation (Fig. 4). Only two models (CSIRO-Mk3L-1-2, MPI-ESM-P) correctly reproduce the amount of rainfall in the DP band, while six models overestimate the rainfall by between 350 and 790 mm yr−1. Although some models
overestimate the amount of precipitation in every season, the positive biases are largest in spring (75–290 mm), autumn (90–325 mm) and winter (50–290 mm). Only two models (GISS-E2-R, CNRM-CM5) simulate the correct magnitude
overestimate the rainfall in all seasons of the year. Seven models simulate too much precipitation in the desert zone (10–55 mm yr−1), with too much rainfall in spring, summer and autumn. Given that the desert zone is by definition con-fined to regions with<100 mm precipitation, the overesti-mation of rainfall in this zone is large. Four models under-estimate the Mediterranean precipitation (by between 35 and 90 mm yr−1), because of underestimation of the autumn and winter rainfall, although they overestimate the summer rain-fall. However, the IPSL-CM5A-LR and GISS-E2-R models overestimate total precipitation in this region: GISS produces too much rainfall in spring (45 mm), summer (100 mm) and autumn (60 mm), while IPSL-CM5A-LR simulates too much rainfall (130 mm) in summer only. Comparison of results from models that correctly simulate the location of each regime (compared to the observations) and those in which the area characterized by a given regime is too extensive or too small show that the biases in simulated precipitation are not related to whether models reproduce the spatial location of each regime correctly.
3.3 Mid-Holocene simulation
The location of the DP regime does not change between the piControland midHolocenesimulations of most (9) of the models (Fig. 3b). The two models (CNRM-CM5, MRI-CGCM3) that failed to simulate a DP pattern in the equatorial zone in thepiControlnevertheless simulate this pattern in the
midHoloceneexperiment. However, in the IPSL-CM5A-LR
midHolocenesimulation, the precipitation in the equatorial zone is more monsoon-like than in the model’s piControl
simulation. Most of the models (6) show no change in the northern limit of the monsoon; four models (CCSM4, IPSL-CM5A-LR, MRI-CGCM3, CNRM-CM5) show a northward displacement of the northern limit of the monsoon, while two models (BCC-CSM1.1, MRI-CGCM3) show a south-ward displacement of the northern limit of the monsoon as a result of southward expansion of the desert regime. Only two models (BBC-CSM1.1, MRI-CGCM3) show a north-ward displacement of the northern limit of the desert zone. Thus, in most of the midHolocene simulations, the desert regime occupies either a similar (5 models) or a slightly contracted area (4 models) compared to thepiControl. Only one model (GISS-E2-R) shows a southward expansion of the Mediterranean precipitation regime; otherwise, this zone oc-cupies the same position as in thepiControlsimulations.
We necessarily confine our comparisons of the magnitude of changes within each precipitation regime to those mod-els that simulate a given regime in both the piControl and
midHolocenesimulations. The changes in the DP regime are not consistent and in general do not exceed the variability shown by thepiControl. Only two models (CSIRO-Mk3-6-0, MIROC-ESM) show a significant reduction in precipita-tion (of 200 and 250 mm, respectively) in themidHolocene
compared to thepiControl (Fig. 5; Table 2). In the case of
the CSIRO-Mk3-6-0 model, this is the result of a large de-crease in autumn precipitation but in the case of the MIROC-ESM the decrease is concentrated in the spring. The mon-soon zone is characterized by a significant increase in pre-cipitation, except in the case of the CSIRO-Mk3-6-0 model. The anomalies range from+50 to+200 mm yr−1, reflecting
large increases in summer (15–140 mm) and autumn (20– 250 mm) rainfall. Changes in winter and spring precipita-tion in winter and spring are not significant. Most models show an increase in mean annual precipitation in the desert regime (5–35 mm) as a result of increased summer and au-tumn rainfall, but the change only exceedspiControl variabil-ity in three cases (CCSM4, GISS-E2-R and MIROC-ESM). Most of the models (11) show an increase in mean annual precipitation (10–75 mm) in the Mediterranean regime, al-though this increase only exceeds thepiControlvariability in the case of the GISS-E2-R model. The simulated increase in mean annual precipitation in the GISS-E2-R model results from an increase in spring, summer and autumn and a negli-gible change in winter. All of the models show an increase in spring precipitation, and two models (IPSL-CM5A-LR, HADGEM2-CC) show an increase in summer rainfall ac-companied by either a small increase or no change in winter. 3.4 Comparison ofmidHolocenesimulations and
mid-Holocene observations
Reconstructions of the change in mean annual precipitation in the mid-Holocene (Fig. 6) show somewhat drier condi-tions (ca. 40 mm yr−1) in the equatorial zone (0–5◦N), an
increase in precipitation of between 300 and 400 mm yr−1
between 10 and 30◦N, and an increase of between 100 and
● ● ● ● ● ● ● ● ● ● ● ● BCC−CSM1.1CCSM4 CNRM−CM5 CSIRO−Mk3−6−0 CSIRO−Mk3L−1−2GISS−E2−R HadGEM2−CC HadGEM2−ES IPSL−CM5A−LRMIROC−ESM MPI−ESM−P MRI−CGCM3
−50 0 50
Annual ● ● ● ● ● ● ● ● ● ● ● ● Spring
−50 0 50
● ● ● ● ● ● ● ● ● ● ● ● Summer
−50 0 50
● ● ● ● ● ● ● ● ● ● ● ● Autumn
−50 0 50
● ● ● ● ● ● ● ● ● ● ● ● Winter
−50 0 50
Mediterr anean ● ● ● ● ● ● ● ● ● ● ● ● BCC−CSM1.1CCSM4 CNRM−CM5 CSIRO−Mk3−6−0 CSIRO−Mk3L−1−2GISS−E2−R HadGEM2−CC HadGEM2−ES IPSL−CM5A−LRMIROC−ESM MPI−ESM−P MRI−CGCM3
−50 0 50
● ● ● ● ● ● ● ● ● ● ● ●
−50 0 50
● ● ● ● ● ● ● ● ● ● ● ●
−50 0 50
● ● ● ● ● ● ● ● ● ● ● ●
−50 0 50
● ● ● ● ● ● ● ● ● ● ● ●
−50 0 50
Deser t ● ● ● ● ● ● ● ● ● ● ● ● BCC−CSM1.1 CCSM4 CNRM−CM5 CSIRO−Mk3−6−0 CSIRO−Mk3L−1−2GISS−E2−R HadGEM2−CC HadGEM2−ES IPSL−CM5A−LR MIROC−ESMMPI−ESM−P MRI−CGCM3
−200 −100 0 100 200
● ● ● ● ● ● ● ● ● ● ● ●
−200 −100 0 100 200
● ● ● ● ● ● ● ● ● ● ● ●
−200 −100 0 100 200
● ● ● ● ● ● ● ● ● ● ● ●
−200 −100 0 100 200
● ● ● ● ● ● ● ● ● ● ● ●
−200 −100 0 100 200
Monsoon ● ● ● ● ● ● ● ● ● ● ● ● BCC−CSM1.1CCSM4 CNRM−CM5 CSIRO−Mk3−6−0 CSIRO−Mk3L−1−2GISS−E2−R HadGEM2−CC HadGEM2−ES IPSL−CM5A−LRMIROC−ESM MPI−ESM−P MRI−CGCM3
−200 −100 0 100 200
● ● ● ● ● ● ● ● ● ● ● ●
−200 −100 0 100 200
● ● ● ● ● ● ● ● ● ● ● ● Precipitation (mm)
−200 −100 0 100 200
● ● ● ● ● ● ● ● ● ● ● ●
−200 −100 0 100 200
● ● ● ● ● ● ● ● ● ● ● ●
−200 −100 0 100 200
Doub
le P
eak
Fig. 5.Simulated changes in total and seasonal precipitation in themidHolocenecompared to thepiControlfor each of the four precipitation regimes (Mediterranean, desert, monsoon, double peak) for the region that is common between the two sets of simulations. The standard de-viation of precipitation in thepiControlcontrol simulation of each model is shown (grey bars) to provide a visual measure of the significance of the simulated change in precipitation. The seasons are defined as spring, summer, autumn and winter (as in Sect. 3.1).
3.5 Comparison between bias and anomaly
Comparison of thepiControlbias andmidHoloceneanomaly suggests that model performance in the control simulations directly affects model performance in themidHolocene sim-ulations in the DP, desert and Mediterranean regions (Fig. 7). In the DP region, there is a significant negative significant correlation (Fig. 7, all models, black line: slope =−0.23,
R2= 0.74,p= 0.0) between the bias and the anomaly: mod-els that overestimate precipitation in thepiControlshow the largest reductions in precipitation in themidHolocene sim-ulations (e.g. BCC-CSM1.1, CSIRO-Mk3-6-0 and MIROC-ESM). The overall relationship is driven by the OAC simu-lations (red line:R2= 0.88,p= 0.02); the slope for the OA models is not significant (blue line;R2= 0.37,p= 0.2). In-deed, as examination of these relationships in model-defined DP regions shows, the negative relationship shown by the
OA models in the 0–5◦N is driven by the two models that simulate monsoon-like regimes in this zone in thepiControl. There is no relationship between the piControl bias and the midHolocene anomaly in the monsoon zone (Fig. 7), whether this is defined geographically (slope = 0.00,
Table 2.Summary of area-averaged climate anomalies (midHoloceneminuspiControl) for individual models for individual seasons and for mean annual precipitation. Bold font indicates values that are significantly different from the interannual variability of the modern observations. The seasons are spring, summer, autumn, and winter (as in Sect. 3.1).
Season BCC- CCSM4 CNRM- CSIRO- CSIRO- GISS- HadGEM2- HadGEM2- IPSL- MIROC- MPI-
MRI-anomaly CSM1.1 CM5 Mk3-6-0 Mk3L-1-2 E2-R CC ES CM5A-LR ESM ESM-P CGCM3
Mediterranean
Annual 15.0 24.4 32.6 −21.2 8.4 75.7 30.9 9.2 40.1 30.8 14.3 15.4
Spring 13.9 3.7 16.1 13.0 4.2 28.4 14.5 13.0 22.2 11.6 17.6 10.4
Summer −4.3 2.7 4.7 −10.7 −2.4 20.5 40.6 −8.8 14.0 0.8 3.5 −2.8
Autumn −0.4 10.5 14.0 −21.6 6.6 20.3 −40.9 2.9 8.0 6.0 −3.9 −5.9
Winter 5.8 7.4 −2.3 −1.9 0.0 6.5 16.7 2.1 −4.1 12.4 −2.9 13.8
Desert
Annual 7.7 29.5 32.7 −18.5 4.6 22.8 4.5 4.4 6.8 26.1 14.3 7.7
Spring 0.1 0.6 3.6 0.8 1.3 10.6 0.6 2.1 1.8 4.2 2.1 0.1
Summer 0.8 14.3 9.6 −7.4 3.2 7.7 3.4 4.2 2.8 12.3 6.7 0.8
Autumn 2.8 13.9 18.5 −11.5 0.9 3.9 2.1 −1.3 2.3 10.1 5.1 2.8
Winter 4.1 0.6 1.0 −0.5 −0.8 0.7 −1.7 −0.5 −0.1 −0.4 0.4 4.1
Monsoon
Annual 47.4 148.6 155.8 −53.5 47.2 116.1 207.6 210.4 202.4 182.1 219.9 88.5
Spring −11.2 −2.6 −7.4 −2.6 −2.7 −7.5 −39.1 19.3 6.0 −19.7 17.5 −1.9
Summer 33.6 80.4 97.2 −20.3 21.5 91.6 15.4 122.8 110.0 142.4 132.8 68.3
Autumn 29.8 76.6 78.7 −28.3 32.9 41.4 233.6 72.5 89.6 72.2 70.2 23.7
Winter −4.7 −5.9 −12.6 −2.3 −4.5 −9.4 −2.2 −4.3 −3.2 −12.7 −0.7 −1.5
DP
Annual −76.7 −13.3 – −208.8 −36.4 2.8 123.0 142.0 – −244.4 14.3 –
Spring −41.3 0.5 – −12.7 −0.6 −56.2 −100.9 −1.7 – −87.2 −32.0 –
Summer 1.1 43.8 – −68.1 33.9 87.1 −1.8 8.6 – 29.3 38.7 –
Autumn 29.1 53.1 – −106.8 63.2 71.0 154.9 168.9 – −9.6 55.6 –
Winter −65.5 −110.7 – −21.1 −132.9 −99.1 70.7 −33.9 – −176.9 −48.1 –
−200 0 200 400 600
0−5 5−10 10−15 15−20 20−25 25−30 30−35 35−40 40−45
BCC−CSM1.1 CCSM4 CNRM−CM5 CSIRO−Mk3−6−0 CSIRO−Mk3L−1−2 GISS−E2−R HadGEM2−CC HadGEM2−ES IPSL−CM5A−LR MIROC−ESM MPI−ESM−P MRI−CGCM3
∆MAP (mi d H ol ocene−pi C ont rol) (mm)
Latitude z
one (
oN)
Fig. 6.Comparison of simulated and reconstructed changes in mean annual precipitation in the mid-Holocene for 5◦latitude bands be-tween 0 and 45◦N. The reconstructions are from the Bartlein et al. (2011) data set. The mean, 25–75 % range and full range of the reconstructions are shown (for those latitude bands with sufficient data points). The model results are averages for the grid cells with observations.
There is a significant positive correlation between the pi-Control bias and midHolocene anomaly in the desert re-gion (Fig. 7). This is true whether the rere-gion is defined geographically (slope = 0.32, R2= 0.58, p= 0.01) or using the model-defined desert regimes (slope = 0.32, R2= 0.48,
p= 0.02). Models that produce a reasonable simulation of modern rainfall in this region fail to produce a significant en-hancement in the midHolocenesimulation (CSIRO-Mk3L-1-2, HadGEM2-CC, IPSL-CM5A-LR) whereas models that are too wet in thepiControlproduce large changes in the
mid-Holocene (CCSM4, GISS-E2-R and MIROC-ESM).
How-ever, these relationships are driven by the OA simulations; the OAC simulations do not show any significant relationship between thepiControlbias and themidHoloceneanomaly.
There is also a significant positive correlation between bias and anomaly in the Mediterranean region (Fig. 7), whether the region is defined geographically (slope = 0.14,R2= 0.58,
p= 0.01) or using the model-defined regimes (slope = 0.15,
R2= 0.48,p= 0.02). Models that underestimate precipitation in this zone in thepiControlshow only small increases in the
midHolocene(BCC-CSM1.1, CCSM4 and MPI-ESM) while
● ● ● ● ● −200 −100 0 100 200 ● ● ● ● ● ●
R2= 0.74 p=0
R2
=0.37 p=0.2 R2=
0.88 p=0.02
Double Peak Anomaly (mm) ● ● All OA OAC ● ●● ● ● ● ● ● ● ● ●
R2= 0 p=0.98
R2
=0.13 p=0.48 R2=
0.11 p=0.58
Monsoon ● ●● ● ● ● ● ● ● ● ●
R2= 0.58 p=0.01
R2
=0.68 p=0.04 R2=
0.56 p=0.15
Desert ● ● ● ● ●● ● ● ● ● ●
R2= 0.69 p=0
R2
=0.8 p=0.02 R2=
0.01 p=0.88
Mediterranean Geogr aphic region ● ● ● ● ● ● ● ●
−200 0 200 400 600 800
−200 −100 0 100 200
R2= 0.71 p=0.01
R2
=0 p=0.98 R2=
0.9 p=0.05
Anomaly (mm) Bias (mm) ● ●● ● ● ● ● ● ● ● ●
−200 0 200 400 600 800
R2= 0.05 p=0.49
R2
=0.29 p=0.27 R2=
0 p=0.96
Bias (mm)
● ●● ● ●
−200 0 200 400 600 800
● ●
● ● ●
●
R2= 0.48 p=0.02
R2
=0.48 p=0.13 R2=
0.54 p=0.16
Bias (mm) ● ● ● ● ● ● ● ● ● ● ●
−200 0 200 400 600 800
R2= 0.57 p=0.01
R2
=0.64 p=0.05 R2=
0.46 p=0.21
Bias (mm)
Model specific region
Fig. 7.Relationship between biases in thepiControlsimulation of mean annual precipitation (mm) and mid-Holocene precipitation anomalies
(midHolocene−piControl) as simulated by each of the CMIP5 models for each of the precipitation regimes (Double Peak, Monsoon,
Desert, Mediterranean). The upper panels show biases and anomalies calculated for specific latitudinal bands as defined from the modern observed spatial extent of each regime (geographic region). The lower panels show biases and anomalies calculated for the region identified as characterized by a given regime in each model and simulation (model specific region). The regressions are calculated for all models (All: black), for the coupled ocean–atmosphere models (OA: blue) and for the carbon-cycle models (OAC: red).
Even in those regions where there are significant relation-ships betweenpiControlbias and themidHoloceneanomaly, theR2value ranges from 0.48 to 0.75. Thus, the bias in the
piControlis not the only factor that determines whether the simulated magnitude of the MH climate change is correct. Furthermore, biases in thepiControlappear to have less (or no) influence on the simulatedmidHoloceneanomaly in the OAC simulations, except in the DP zone.
4 Discussion
Our analyses suggest that the CMIP5 models fail to repro-duce key aspects of both the modern and MH climate of the northern Africa and Mediterranean region. Although the models generally reproduce the four characteristic seasonal patterns of precipitation, they do not always simulate these patterns in the correct place. They also tend to underestimate the magnitude of seasonal changes in precipitation. For ex-ample, they underestimate the amount of winter rainfall and overestimate the summer rainfall in the Mediterranean re-gion. This is consistent with previous analyses of Mediter-ranean climates in both the CMIP3 (Giorgi and Lionello, 2008) and CMIP5 (Kelley et al., 2012) simulations. The models overestimate the precipitation in the DP zone, again a feature identified from previous analyses (Roehrig et al.,
2013). Previous analyses of the CMIP5 models (e.g. Roehrig et al., 2013; Brands et al., 2013) have suggested that there is a tendency for models to underestimate precipitation in the Sahel zone. While our analyses confirm this, with 8 out of 12 models showing less summer precipitation than ob-served, some of the models (e.g. CSIRO-Mk3L-1-2, BCC-CSM1.1) show a distinct improvement when the compari-son is made between regions defined by precipitation regimes rather than geographically (Fig. 4). Furthermore, the tempo-ral interval used for comparison also plays a role: MIROC-ESM, for example, simulates summer precipitation correctly but annual rainfall is too large because the simulated mon-soon season is too long. Our evaluations are based on the assumption that the difference in climate between the piCon-trol (1850 AD) and the 1961–1990 modern climatology is small. Comparisons of thepiControl andhistorical simula-tions (Fig. S1, Supplement) for a sub-set of the models ap-pear to support this assumption: the differences between the simulations are smaller than the difference between the sim-ulated and observed climates. There is no synthesis of data for the pre-industrial era from northern Africa, but data from the Mediterranean region does not suggest substantial differ-ences (e.g. Davis et al., 2003).
● ●
0 50 100 150 200
0 50 100 150 200
Mediterranean Observations PMIP2 CMIP5
● ● 0
50 100 150
0 5 10 15 20
Desert
Summer precipitation (mm)
● ●
0 200 400 600 800
0 10 20 30 40 50 60
Monsoon
● ●
0 200 400 600 800
0 100 200 300 400 500 600 Double Peak
Winter precipitation (mm)
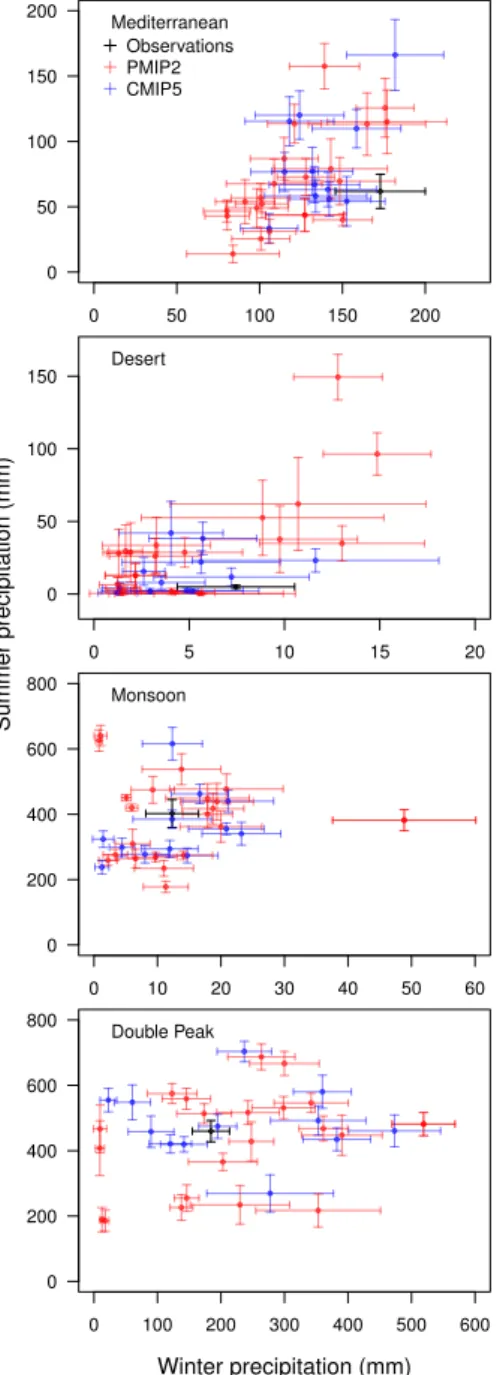
Fig. 8.Comparison of simulated and observed summer and win-ter precipitation in each of the four precipitation regimes (Mediwin-ter- (Mediter-ranean, Desert, Monsoon, Double Peak). The observations (black) are the average for the period 1961–1990 from the CRU T3.1 data set (Harris et al., 2014). The simulated mean and standard deviation of precipitation from the CMIP5 models (blue) is based on the last 100 yr of thepiControl. These simulations can be compared with re-sults from coupled ocean–atmosphere simulations made during the second phase of the PMIP2 (Braconnot et al., 2012; shown in red). The PMIP2 results are the mean and standard deviation based on the last 100 yr of apiControl, except in three cases where only 50 yr of data were available. Model results are calculated for each precipita-tion regime based on the observed geographic extent characterized by these regimes, as defined using the CRU TS3.1 data set. Summer and winter as defined in Sect. 3.1.
consistent with the observations, the magnitude of these changes is significantly underestimated (Fig. 6). The fail-ure to simulate a sufficiently large expansion of the African monsoon has been a major criticism of previous genera-tions of climate models (Joussaume et al., 1999; Coe and Harrison, 2002; Braconnot et al., 2007a, 2012; Brayshaw et al., 2011; Zhao and Harrison, 2011). Comparisons between CMIP5 and PMIP2 models (Fig. 8) show that the two en-sembles are indistinguishable in terms of simulated changes over this study region. Global comparisons of these two sets of simulations (e.g. Harrison et al., 2013) appear to con-firm that the CMIP5 models are no better at simulating cli-mate changes than previous generations of models. It was originally suggested that the underestimation of monsoon expansion reflected the failure to include feedbacks associ-ated with climate-induced changes in land-surface character-istics, including wetter and more organic soils, the replace-ment of desert by grassland and shrubland, and the expan-sion of lakes and wetlands. Indeed, simulations in which the impacts of changes in land-surface characteristics were pre-scribed through changing albedo produced much larger mon-soons (Street-Perrott et al., 1990; Kutzbach et al., 1996; Coe and Bonan, 1997; Broström et al., 1998). However, this effect is not as pronounced in asynchronously-coupled climate– vegetation simulations (Claussen and Gaylor, 1997; Texier et al., 1997; Braconnot et al., 1999), models with dynamic vegetation from PMIP2 (Braconnot et al., 2012), or indeed coupled carbon–climate models in CMIP5 (Harrison et al., 2013). In general, these models produce a strengthening of the monsoon in situ and only a minor northward expansion of the zone of monsoon rainfall. If we assume that the coupled models are behaving reasonably, this shows that the changes to the energy budget produced by the prescribed changes in albedo are compensated by changes in the partitioning be-tween latent and sensible heating through increased evapo-transpiration. This implies that some other mechanism, for example associated with changes in circulation, is required to produce the observed expansion of rainfall in the Sahara.
simulations and the observations are not simply a result of lack of information.
It would be possible to use the qualitative informa-tion about changes in water balance provided by lake-level records to constrain pollen-based climate reconstructions (see e.g. Cheddadi et al., 1997). While this could provide more robust reconstructions of the observed change in pre-cipitation for northern Africa, the number of observations would still necessarily be limited to sites where both pollen and lake-level records are available. Model inversion pro-vides an alternative approach to use of lake-level data for climate reconstruction (see e.g. Vassiljev et al., 1998), and one that has already been successfully used with pollen data (Wu et al., 2007). However, changes in lake-water balance can be brought about by changes in multiple climate param-eters (temperature, precipitation, seasonality of precipitation, cloudiness, vapour pressure, wind speed) and the magnitude of the lake-level changes that occur in response to changes in catchment-water balance are influenced by morphometric factors (lake depth and shape, lake size relative to catchment size) (Harrison et al., 2002), and the methodology for taking account of all these factors has not yet been developed.
The simulated increase in mean annual precipitation in the Mediterranean region is small and, in comparison with the variability already present in thepiControl, is not significant. However, although just half of the models show an increase in summer, all of them show an increase in precipitation in spring and some of them also show an increase in autumn. Thus, some of the models produce an increase in growing season moisture that, although too small, is consistent with the expansion of deciduous forest in this region during the mid-Holocene. Temperate deciduous forests occur in midlat-itude regions with>700 mm of annual precipitation spread throughout the year (see Harrison et al., 2010). Temperate deciduous forest occurs, for example, around Lake Bany-oles in eastern Spain, where mean annual precipitation is ca. 800 mm and nearly half of this falls in spring and sum-mer (Soler et al., 2007). According to the mid-Holocene sim-ulations for the Mediterranean area, the largest increase in growing-season precipitation is ca. 30 mm in spring and 40 in summer (GISS-E2-R and HadGEM2-CC respectively), and the overall change in mean annual precipitation is<75 mm (GISS-E2-R). This is less than the increase required for de-ciduous trees to grow. Nevertheless, these simulations point to mechanisms that could help to explain the observed veg-etation changes in the Mediterranean. Furthermore, if the absence of a significant increase in summer rainfall in the Mediterranean is linked to underestimation of the northward migration of the African monsoon, then improvements in the simulation of monsoonal changes should also lead to a more realistic simulation of Mediterranean climate.
We have shown that there is a significant relationship be-tween the bias in the control simulation and the magnitude of the simulated MH changes in precipitation for the DP, desert and Mediterranean zones, although no such relationship is
present in the monsoon zone. However, the relationship in the desert and Mediterranean zones is only apparent in the OA models; thepiControl bias does not seem to affect the
midHoloceneanomaly in the OAC models. The OA models also show a weakly positive (though non-significant) rela-tionship betweenpiControlbias andmidHoloceneanomaly in the monsoon region. Thus, the apparently significant rela-tionships between bias and anomaly found when considering all the models are not a consistent feature of these simula-tions. Even in the DP, desert and Mediterranean zones, the bias in the OApiControl simulations only explains part of the variability in simulated climate changes. Previous stud-ies have also had difficultstud-ies in finding consistent relation-ships between control biases and MH changes in precipita-tion. Comparison of control and MH atmosphere-only simu-lations made in the first phase of the PMIP1 showed that in-termodel differences in the position of the intertropical con-vergence zone in the control simulation was reflected in the intermodel differences of its position in the MH simulation (Joussaume et al., 1999). However, there was no clear rela-tionship between the amount of precipitation in the control and the increase in precipitation in the MH (Braconnot et al., 2002). Braconnot et al. (2007b), analysing OA simulations from PMIP2, showed that the relationship between the sim-ulated precipitation in the control to the ratio of the change in precipitation between MH and control was negative: mod-els that simulated very little rainfall tended to produce larger changes at the MH. However, this relationship was clearly driven by only three models, and the remaining models show no trend between the precipitation in the control simulation and the ratio of change in the MH. Thus, this seems to be consistent with our analyses. It is hard to escape the conclu-sion that improvements to the simulation of modern climate (see e.g. Haerter et al., 2011) will not guarantee that climate changes will be correctly simulated.
In this study, we have analysed the realism of simulated climates both in terms of climate regimes and by comparing specific geographic bands. The use of climate regimes places less stringent requirements on model performance, allowing an assessment, for example, of whether a model can simulate changes in seasonality independent of location. One reason for adopting this approach is the concern that model reso-lution, particularly in regions of complex topography, could affect geographic patterning (see e.g. Brewer et al., 2007). However, it can be difficult to find objective criteria for the definition of these climate regimes. Although we have been able to distinguish DP from monsoon, and monsoon from desert, climates solely on the basis of precipitation seasonal-ity, it is not possible to use this type of criterion to distinguish desert and Mediterranean climates. Brewer et al. (2007) used
Many of the large-scale features characteristic of pro-jected climate changes are a feature of past climate changes, and comparison with palaeo-observations shows that current models reproduce these features in a realistic way (e.g. Bra-connot et al., 2012; Izumi et al., 2013; Schmidt et al., 2014a; Li et al., 2013). Models, as we confirm here for northern Africa and the Mediterranean region, are also able to simu-late precipitation regimes and shifts in these regimes in a re-alistic way (Joussaume et al., 1999; Braconnot et al., 2007a; Brewer et al., 2007). However, there are still important dis-crepancies between the simulated and observed magnitude of changes in precipitation, despite the increasing complex-ity and resolution of the CMIP5 models compared to earlier generations of models. Given that the ability to simulate the magnitude of MH changes in seasonal climates does not ap-pear to be systematically related to biases in the control simu-lations, focusing on improving the simulation of modern cli-mate will not ensure that future projections or retrodictions of the climate of the Mediterranean and northern Africa will be more reliable. This is of concern given the environmen-tal problems associated with recent climate changes in the Mediterranean and the importance of monsoonal rainfall for agriculture in northern Africa.
5 Conclusions
The CMIP5 models fail to reproduce key aspects of both the modern and MH climate of the northern Africa and Mediter-ranean region, including the correct geographical location of zonal precipitation regimes in the pre-industrial simulation and the magnitude of MH changes in these regimes.
Although biases in the OA simulations explain part of the variability in simulated climate changes, a similar relation-ship is not found for the OAC simulations. Thus, overall, bi-ases in the control simulations cannot explain the failure to reproduce MH changes in precipitation.
As in previous generations of model simulations, the CMIP5 simulations underestimate the northward shift and the magnitude of observed changes in the north African monsoon.
In the Mediterranean region, the simulations show a ten-dency for increased growing-season precipitation. Such a shift is required to explain observed vegetation changes in this region in the MH, but the simulated shift is much too small. We speculate that this is linked to the underestimation of changes in the north African monsoon, suggesting that proved simulation of Mediterranean climates is linked to im-provements in simulating the climate of northern Africa.
The failure to simulate observed mid-Holocene changes in the north African monsoon and the potentially linked failure to simulate the observed shift in rainfall seasonality in the Mediterranean raises concerns about the reliability of model projections of future climates in these regions.
Supplementary material related to this article is
available online at http://www.clim-past.net/10/551/2014/ cp-10-551-2014-supplement.pdf.
Acknowledgements. This work was initiated when A. Perez-Sanz
was a guest scientist at Macquarie University; we thank the Department of Biology for providing funds to facilitate this visit. G. Li is supported by an International Postgraduate Research Scholarship at Macquarie University. This research was supported by the Australian Research Council, grant number DP1201100343 (SPH) and the CGL2012-33063 (PGS) by the Spanish CICYT. We acknowledge the World Climate Research Programme’s Working Group on Coupled Modelling, which is responsible for CMIP, and the climate modelling groups for producing and making available their model output. (For CMIP the US Department of Energy’s Program for Climate Model Diagnosis and Intercomparison provides coordinating support and led development of software infrastructure in partnership with the Global Organization for Earth System Science Portals.) The analyses and figures are based on data archived at CMIP5 on 15 August 2012.
Edited by: A. Paul
References
Amatulli, G., Camia, A., and San-Miguel-Ayanz, J.: Estimat-ing future burned areas under changEstimat-ing climate in the EU-Mediterranean countries, Sci. Total Environ., 450–451, 209–222, doi:10.1016/j.scitotenv.2013.02.014, 2013.
Bartlein, P. J., Harrison, S. P., Brewer, S., Connor, S., Davis, B. A. S., Gajewski, K., Guiot, J., Harrison-Prentice, T. I., Hender-son, A., Peyron, O., Prentice, I. C., Scholze, M., Seppä, H., Shu-man, B., Sugita, S., Thompson, R. S., Viau, A. E., Williams, J., and Wu, H.: Pollen-based continental climate reconstructions at 6 and 21 ka: a global synthesis, Clim. Dynam., 37, 775–802, doi:10.1007/s00382-010-0904-1, 2011.
Bonfils, C., de Noblet-Ducoudré, N., Guiot, J., and Bartlein, P.: Some mechanisms of mid-Holocene climate change in Europe, inferred from comparing PMIP models to data, Clim. Dynam., 23, 79–98, doi:10.1007/s00382-004-0425-x, 2004.
Bosmans, J. H. C., Drijfhout, S. S., Tuenter, E., Lourens, L. J., Hilgen, F. J., and Weber, S. L.: Monsoonal response to mid-holocene orbital forcing in a high resolution GCM, Clim. Past, 8, 723–740, doi:10.5194/cp-8-723-2012, 2012.
Braconnot, P., Joussaume, S., Marti, O., and de Noblet, N.: Syner-gistic feedbacks from ocean and vegetation on the African mon-soon response to mid-Holocene insolation, Geophys. Res. Lett., 26, 2481–2484, doi:10.1029/1999GL006047, 1999.
Braconnot, P., Harrison, S. P., Kageyama, M., Bartlein, P. J., Masson-Delmotte, V., Abe-Ouchi, A., Otto-Bliesner, B., and Zhao, Y.: Evaluation of climate models using palaeoclimatic data, Nat. Clim. Change, 2, 417–424, doi:10.1038/nclimate1456, 2012.
Braconnot, P., Otto-Bliesner, B., Harrison, S., Joussaume, S., Pe-terchmitt, J.-Y., Abe-Ouchi, A., Crucifix, M., Driesschaert, E., Fichefet, Th., Hewitt, C. D., Kageyama, M., Kitoh, A., Laîné, A., Loutre, M.-F., Marti, O., Merkel, U., Ramstein, G., Valdes, P., Weber, S. L., Yu, Y., and Zhao, Y.: Results of PMIP2 coupled simulations of the Mid-Holocene and Last Glacial Maximum – Part 1: experiments and large-scale features, Clim. Past, 3, 261– 277, doi:10.5194/cp-3-261-2007, 2007a.
Braconnot, P., Otto-Bliesner, B., Harrison, S., Joussaume, S., Pe-terchmitt, J.-Y., Abe-Ouchi, A., Crucifix, M., Driesschaert, E., Fichefet, Th., Hewitt, C. D., Kageyama, M., Kitoh, A., Loutre, M.-F., Marti, O., Merkel, U., Ramstein, G., Valdes, P., We-ber, L., Yu, Y., and Zhao, Y.: Results of PMIP2 coupled sim-ulations of the Mid-Holocene and Last Glacial Maximum – Part 2: feedbacks with emphasis on the location of the ITCZ and mid- and high latitudes heat budget, Clim. Past, 3, 279–296, doi:10.5194/cp-3-279-2007, 2007b.
Brands, S., Herrera, S., Fernández, J., and Gutiérrez, J. M.: How well do CMIP5 Earth System Models simulate present climate conditions in Europe and Africa?: A performance comparison for the downscaling community, Clim. Dynam., 41, 803–817, doi:10.1007/s00382-013-1742-8, 2013.
Brayshaw, D. J., Rambeau, C. M. C., and Smith, S. J.: Changes in Mediterranean climate during the Holocene: Insights from global and regional climate modelling, Holocene, 21, 15–31, doi:10.1177/0959683610377528, 2011.
Brewer, S., Guiot, J., and Torre, F.: Mid-Holocene climate change in Europe: a data-model comparison, Clim. Past, 3, 499–512, doi:10.5194/cp-3-499-2007, 2007.
Broström, A., Coe, M., Harrison, S. P., Gallimore, R., Kutzbach, J. E., Foley, J., Prentice, I. C., and Behling, P.: Land surface feed-backs and palaeomonsoons in northern Africa, Geophys. Res. Lett., 25, 3615–3618, doi:10.1029/98GL02804, 1998.
Camuffo, D., Bertolin, C., Barriendos, M., Dominguez-Castro, F., Cocheo, C., Enzi, S., Sghedoni, M., Valle, A., Garnier, E., Alco-forado, M. J., Xoplaki, E., Luterbacher, J., Diodato, N., Maugeri, M. Nunes, M. F., and Rodriguez, R.: 500-years temperatura re-construction in the Mediterranean Basin by means of documen-tary data and instrumental observations, Climatic Change, 101, 169–199, 2010.
Carrión, J. S., Fernández, S., González-Sampériz, P., Gil-Romera, G., Badal, E., Carrión-Marco, Y., López-Merino, L., López-Sáez, J. A., Fierro, E., and Burjachs, F.: Expected trends and surprises in the Lateglacial and Holocene vegetation history of the Iberian Peninsula and Balearic Islands, Rev. Palaeobot. Palynol., 162, 458–475, doi:10.1016/j.revpalbo.2009.12.007, 2010.
Cheddadi, R., Yu, G., Guiot, J., Harrison, S. P., and Prentice, I. C.: The climate of Europe 6000 years ago, Clim. Dynam., 13, 1–9, doi:10.1007/s003820050148, 1997.
Claussen, M. and Gaylor, V.: The greening of the Sahara during the mid-Holocene: results of an interactive atmosphere-biosphere model, Global Ecol. Biogeogr., 6, 369–377, 1997.
CLIVAR: Climate in Spain: Past, Present and Future. Regional cli-mate change assessment report, edited by: Pérez, F. F. and Bos-colo, R., Ministerio de Ciencia e Innovación, Madrid, 83 pp., 2010.
Coe, M. T. and Bonan, G.: Feedbacks between climate and surface water in northern Africa during the middle Holocene, J. Geo-phys. Res., 102, 11087–11101, doi:10.1029/97JD00343, 1997.
Coe, M. T. and Harrison, S. P.: The water balance of northern Africa during the mid-Holocene: an evaluation of the 6 ka BP PMIP simulations, Clim. Dynam., 19, 155–166, doi:10.1007/s00382-001-0219-3, 2002.
Collins, W. J., Bellouin, N., Doutriaux-Boucher, M., Gedney, N., Halloran, P., Hinton, T., Hughes, J., Jones, C. D., Joshi, M., Lid-dicoat, S., Martin, G., O’Connor, F., Rae, J., Senior, C., Sitch, S., Totterdell, I., Wiltshire, A., and Woodward, S.: Develop-ment and evaluation of an Earth-System model – HadGEM2, Geosci. Model Dev., 4, 1051–1075, doi:10.5194/gmd-4-1051-2011, 2011.
Davis, B. A. S., Brewer, S., Stevenson, A. C., and Guiot, J.: The temperature of Europe during the Holocene recon-structed from pollen data, Quaternary Sci. Rev., 22, 1701–1716, doi:10.1016/S0277-3791(03)00173-2, 2003.
Dufresne, J.-L., Foujols, M.-A., Denvil, S., Caubel, A., Marti, O., Aumont, O., Balkanski, Y., Bekki, S., Bellenger, H., and Ben-shila, R.: Climate change projections using the IPSL-CM5 Earth System Model: from CMIP3 to CMIP5, Clim. Dynam., 9–10, 2123–2165, doi:10.1007/s00382-012-1636-1, 2013.
Dunne, J., Evershed, R. P., Salque, M., Cramp, L., Bruni, S., Ryan, K., Biagetti, S., and di Lernia, S.: First dairying in green Sa-haran Africa in the fifth millennium bc, Nature, 486, 390–394, doi:10.1038/nature11186, 2012.
European Environment Agency: Climate change, impacts and vul-nerability in Europe 2012: an indicator-based report, European Environment Agency, Copenhagen, 2012.
Forman, S. L., Oglesby, R., Markgraf, V., and Stafford, T.: Paleo-climatic significance of Late Quaternary eolian deposition on the Piedmont and High Plains, Central United States, Global Planet. Change, 11, 35–55, doi:10.1016/0921-8181(94)00015-6, 1995. Gaetani, M., Pohl, B., Douville, H., and Fontaine, B.: West African
Monsoon influence on the summer Euro-Atlantic circulation, Geophys. Res. Lett., 38, L09705, doi:10.1029/2011GL047150, 2011.
Gent, P. R., Danabasoglu, G., Donner, L. J., Holland, M. M., Hunke, E. C., Jayne, S. R., Lawrence, D. M., Neale, R. B., Rasch, P. J., and Vertenstein, M.: The community climate system model ver-sion 4, J. Climate, 24, 4973–4991, doi:10.1175/2011JCLI4083.1, 2011.
Giorgi, F.: Climate change hot-spots, Geophys. Res. Lett., 33), L08707, doi:10.1029/2006GL025734, 2006.
Giorgi, F. and Lionello, P.: Climate change projections for the Mediterranean region, Global Planet. Change, 63, 90–104, doi:10.1016/j.gloplacha.2007.09.005, 2008.
Guiot, J., Boreux, J. J., Braconnot, P., and Torre, F.: Data-model comparison using fuzzy logic in paleoclimatology, Clim. Dy-nam., 15, 569–581, doi:10.1007/s003820050301, 1999. Haerter, J. O., Hagemann, S., Moseley, C., and Piani, C.:
Cli-mate model bias correction and the role of timescales, Hy-drol. Earth Syst. Sci., 15, 1065–1079, doi:10.5194/hess-15-1065-2011, 2011.
Harrison, S. P., Prentice, I. C., and Bartlein, P. J.: Influence of in-solation and glaciation on atmospheric circulation in the North Atlantic sector: Implications of general circulation model exper-iments for the Late Quaternary climatology of Europe, Quater-nary Sci. Rev., 11, 283–299, doi:10.1016/0277-3791(92)90002-P, 1992.
Harrison, S. P., Yu, G., and Vassiljev, J.: Climate changes during the Holocene recorded by lakes from Europe, in: Climate Develop-ment and History of the North Atlantic Realm, edited by: Wefer, G., Berger, W., Behre, K.-E., and Jansen, E., Springer-Verlag, Berlin, Heidelberg, 191–204, 2002.
Harrison, S. P., Prentice, I. C., Barboni, D., Kohfeld, K. E., Ni, J., and Sutra, J.-P.: Ecophysiological and bioclimatic foundations for a global plant functional classification, J. Veg. Sci., 21, 300– 317, doi:10.1111/j.1654-1103.2009.01144.x, 2010.
Harrison, S. P., Bartlein, P. J., Brewer, S., Prentice, I. C., Boyd, M., Hessler, I., Holmgren, K., Izumi, K., and Willis, K.: Model benchmarking with glacial and mid-Holocene climates, Clim. Dynam., 1432–0894, doi:10.1007/s00382-013-1922-6, 2013. Hoelzmann, P., Jolly, D., Harrison, S. P., Laarif, F., Bonnefille,
R., and Pachur, H.-J.: Mid-Holocene land-surface conditions in northern Africa and the Arabian Peninsula: A data set for the analysis of biogeophysical feedbacks in the climate system, Global Biogeochem. Cy., 12, 35–51, doi:10.1029/97GB02733, 1998.
Hoerling, M., Eischeid, J., Perlwitz, J., Quan, X., Zhang, T., and Pegion, P.: On the increased frequency of Mediterranean drought, J. Climate, 25, 2146–2161, 2012.
Ibanez, F.: Sur une nouvelle application de la théorie de l’information à la description des séries chronologiques planctoniques, J. Plankton Res., 4, 619–632, doi:10.1093/plankt/4.3.619, 1982.
Izumi, K., Bartlein, P. J., and Harrison, S. P.: Consistent large-scale temperature responses in warm and cold climates, Geophys. Res. Lett., 40, 1817–1823, doi:10.1002/grl.50350, 2013.
Joussaume, S., Taylor, K. E., Braconnot, P., Mitchell, J. F. B., Kutzbach, J. E., Harrison, S. P., Prentice, I. C., Broccoli, A. J., Abe-Ouchi, A., Bartlein, P. J., Bonfils, C., Dong, B., Guiot, J., Herterich, K., Hewitt, C. D., Jolly, D., Kim, J. W., Kislov, A., Kitoh, A., Loutre, M. F., Masson, V., McAvaney, B., Mc-Farlane, N., de Noblet, N., Peltier, W. R., Peterschmitt, J. Y., Pollard, D., Rind, D., Royer, J. F., Schlesinger, M. E., Syk-tus, J., Thompson, S., Valdes, P., Vettoretti, G., Webb, R. S., and Wyputta, U.: Monsoon changes for 6000 years ago: Re-sults of 18 simulations from the Paleoclimate Modeling Inter-comparison Project (PMIP), Geophys. Res. Lett., 26, 859–862, doi:10.1029/1999GL900126, 1999.
Kelley, C., Ting, M., Seager, R., and Kushnir, Y.: Mediter-ranean precipitation climatology, seasonal cycle, and trend as simulated by CMIP5, Geophys. Res. Lett., 39, L21703, doi:10.1029/2012GL053416, 2012.
Kelley, D. I., Prentice, I. C., Harrison, S. P., Wang, H., Simard, M., Fisher, J. B., and Willis, K. O.: A comprehensive benchmarking system for evaluating global vegetation models, Biogeosciences, 10, 3313–3340, doi:10.5194/bg-10-3313-2013, 2013.
Kohfeld, K. E. and Harrison, S. P.: How well can we simulate past climates? Evaluating the models using global palaeoen-vironmental datasets, Quaternary Sci. Rev., 19, 321–346, doi:10.1016/S0277-3791(99)00068-2, 2000.
Kuper, R. and Kröpelin, S.: Climate-Controlled Holocene Occupa-tion in the Sahara: Motor of Africa’s EvoluOccupa-tion, Science, 313, 803–807, doi:10.1126/science.1130989, 2006.
Kutzbach, J. E., Bonan, G. B., Foley, J. A., and Harrison, S. P.: Vegetation and soils feedbacks on the response of the African monsoon response to orbital forcing in early to middle Holocene, Nature, 384, 623–626, doi:10.1038/384623a0, 1996.
Levis, S., Bonan, G. B., and Bonfils, C.: Soil feedback drives the mid-Holocene North African monsoon northward in fully coupled CCSM2 simulations with a dynamic vegetation model, Clim. Dynam., 23, 791–802, doi:10.1007/s00382-004-0477-y, 2004.
Li, G., Harrison, S. P., Bartlein, P. J., Izumi, K., and Colin Prentice, I.: Precipitation scaling with temperature in warm and cold cli-mates: An analysis of CMIP5 simulations, Geophys. Res. Lett., 40, 4018–4024, doi:10.1002/grl.50730, 2013.
Lionello, P.: The climate of the Mediterranean Region from the past to the future, Elsevier Science, Burlington, 2012.
Luterbacher, J., Xoplaki, E., Casty, C., Wanner, H., Pauling, A., Kuttel, M., Rutishauser, T., Bronnimann, S., Fischer, E., and Fleitmann, D.: Mediterranean climate variability over the last centuries: a review, in Mediterranean climate variability, Else-vier, Amsterdand, Oxford, 2006.
Magny, M., Miramont, C., and Sivan, O.: Assessment of the im-pact of climate and anthropogenic factors on Holocene Mediter-ranean vegetation in Europe on the basis of palaeohydrological records, Palaeogeogr. Palaeocl., 186, 47–59, doi:10.1016/S0031-0182(02)00442-X, 2002.
Marzin, C. and Braconnot, P.: Variations of Indian and African mon-soons induced by insolation changes at 6 and 9.5 kyr BP, Clim. Dynam., 33, 215–231, doi:10.1007/s00382-009-0538-3, 2009. Masson, V., Cheddadi, R., Braconnot, P., Joussaume, S., and Texier,
D.: Mid-Holocene climate in Europe: what can we infer from PMIP model-data comparisons?, Clim. Dynam., 15, 163–182, doi:10.1007/s003820050275, 1999.
Meehl, G. A., Stocker, T. F., Collins, W. D., Friedlingstein, P., Gaye, A. T., Gregory, J. M., Kitoh, A., Knutti, R., Murphy, J. M., Nodas, A., Raper, S. C. B., Watterson, I. G., Weaver, A. J., and Zhao, Z. C.: Global Climate Projections, in Cli-mate Change 2007: The Physical Science Basis. Contribution of Working Group I to the Fourth Assessment Report of the Inter-governmental Panel on Climate Change, edited by: Solomon, S., Quin, D., Manning, M., Chen, Z., Marquis, M., Averyt, K. B., Tignor, M., and Miller, H. L., Cambridge University Press, Cam-bridge, UK and New York, USA, 2007.
Mehta, A. V. and Yang, S.: Precipitation climatology over Mediter-ranean Basin from ten years of TRMM measurements, Adv. Geosci., 17, 87–91, doi:10.5194/adgeo-17-87-2008, 2008. Monerie, P.-A., Fontaine, B., and Roucou, P.: Expected
fu-ture changes in the African monsoon between 2030 and 2070 using some CMIP3 and CMIP5 models under a medium-low RCP scenario, J. Geophys. Res., 117, D16111, doi:10.1029/2012JD017510, 2012.