EVALUATION OF AREA-BASED IMAGE MATCHING APPLIED TO DTM
GENERATION WITH HIRISE IMAGES
C. Re a, *, R. Roncella b, G. Forlanib, G. Cremonesec, G. Nalettod a
CISAS, Padova University, Italy - [email protected]
bDept. of Civil Engineering, Parma University, Italy - {riccardo.roncella; gianfranco.forlani}@unipr.it
cPadova Astronomic Observatory, Padova, Italy - [email protected]
dDept. of Computer Science, Padova University, Italy - [email protected]
Commission IV, WG IV/7
KEY WORDS: Photogrammetry, Accuracy, Planetary, Pushbroom, High resolution, Matching, DEM/DTM
ABSTRACT:
In the generation of Digital Terrain Models (DTMs) from space images area-based image matching techniques are used in most cases; the image matching strategy, though, is to be tailored to the specific mission characteristics. In this paper, a series of tests have been performed with real and synthetic space images to study the performance of our implementation of the Least Squares Matching algorithm. To this aim, patches extracted from a pair of Hirise images were processed with our DTM generation software Dense Matcher (DM) as well as with Ames Stereo Pipeline (ASP) and the results compared to a reference DTM; moreover, synthetic images, generated from the reference DTM and overlaid with artificial texture ideal for image matching, were processed as well, to discriminate the influence of texture and surface topography on the DTM accuracy. With real images, both software show RMSE ranging from 15 to 38 cm; with synthetic images, processed only with DM, RMSE ranges from 12 to 18 cm.
* Corresponding author. This is useful to know for communication with the appropriate person in cases with more than one author.
1. INTRODUCTION
The importance of high resolution DTMs in the geomorphological studies of planets and asteroids has established stereo coverage and the photogrammetric reconstruction of the body surface as a standard among the scientific goals of space missions. Mars images with resolutions from a few tens of meters down to 30 cm (McEwen et al, 2007) have been acquired in the last decade by several space missions from NASA and ESA aiming to produce high resolution global DTM coverage (Gwinner et al, 2010) or “ultra-high” resolution DTMs in selected areas (Kirk et al, 2008). Due to payload and data rate constraints as well as to illumination and surface texture, often very poor image quality must be improved and image matching algorithms implemented in a pipeline where filtering, coarse-to-fine, pre-rectification and other steps are performed (Heipke, 2007; Kirk et al., 2008; Gwinner et al., 2009) to improve accuracy and the percentage of success of image matching.
The authors are part of a team in charge of the development of a STereo Camera (STC) for the ESA-JAXA mission BepiColombo to Mercury (Cremonese et al, 2009). The main scientific objective of STC is the production of a detailed DTM of the planet from stereo images with a ground resolution varying from 50 m at the equator to about 115 m at the poles. Among other preparation activities, algorithms and software for DTM generation from STC images are being developed. Currently two different strategies are being implemented and tested on space images; the first, implemented in the software DenseMatcher (DM) (see Section 2.1) applies stereo or multi-image area-based techniques to find multi-image point
correspondences; the second, implemented in the software SIEM, is a novel approach where snakes (Kass et al, 1987) are used as a tool to evolve an initial approximation of the stereo pair disparity map until an optimum global correspondence between the images is found (Simioni et al, 2011). In this paper, results will be presented only for the former. After some tests with synthetically generated space images (Massironi et al, 2008) as a first test with real space images, though very different in ground resolution from those of STC, it has been decided to apply DM to Hirise images. The goal is to highlight where improvements are necessary and difficulties can be expected as well as to compare the matching accuracy and the percentage of good matches with other well established software. To this aim, three areas have been selected on a Hirise stereo pair in the Melas Chasma basin, where a reference DTM was available.
The comparison of just the image matching procedure being the main objective of this work, all other steps of the DTM generation procedure have been made independent of the matching software by using the Ames Stereo Pipeline (ASP) (Broxton et al, 2008) framework. Two types of tests have been performed. In the first, applied to real Hirise images, the matching accuracy of DM have been checked against that of ASP and with respect to a reference DTM produced by the University of Arizona with Socet Set (SS). In a second series of tests, using the reference DTM overlaid with a well textured artificial pattern, Hirise synthetic images were generated with a 3D modelling software, matched with DM and triangulated to produce a new DTM; comparison of this DTM to the reference one measures the effect on DTM accuracy of the texture of the real images.
2. ALGORITHMS AND SOFTWARE FOR IMAGE MATCHING USED IN THE TEST
2.1 Dense Matcher
The DTM generation program Dense Matcher being developed at the University of Parma since 2006 implements the NCC (Normalized Cross Correlation) method, the Least Squares Matching (LSM) method (Gruen, 1986) and the Multiphoto Geometrically Constrained Matching (MGCM) method (Gruen et Baltsavias, 1988); only the second has been used in the tests. LSM is a local area-based method, where a linear radiometric transformation and an affine mapping are introduced to minimize the squared sum of the grey values differences between the patch image and the template image. As input data the program requires interior and exterior orientation parameters of the images. The matching stage is embedded in a multi-resolution approach where three levels of an image pyramid are processed. A parallel dense matching procedure is implemented where the initial disparity map is computed by performing a feature based matching followed by interpolation on a grid. The SURF (Bay et al, 2008) or the Harris operator are used to find correspondences, filtering wrong matches with the epipolar constraint. The disparities on the accepted matches are then interpolated on a regular grid using a Delaunay triangulation to fill the initial disparity map. A NCC matching step is executed to improve the initial map (optionally at each level of the pyramid); afterwards the LSM proceeds to refine the disparity. Images may undergo to epipolar resampling to improve efficiency and computational speed. Several options and parameters, such as use of pyramids, acceptance threshold for the correlation coefficient between the g.v. of template and patch, template size, pixel spacing between template centres, etc. can be set to control the processing. After the final dense disparity map computation no hole filling or other post-processing stage is currently performed.
2.2 Ames Stereo Pipeline
The image matching program ASP is “an open source suite of fully automated geodesy and stereogrammetry tools designed to process planetary imagery captured from robotic explorers” (Moratto et al, 2010) from the NASA Ames Intelligent Robotics Group. The program is integrated with the updated versions of USGS ISIS software package (Torson and Becker, 1997) that is now a standard for processing, analysing and archiving images and ancillary information of NASA space missions. According to the ASP manual (Broxton M. J. et al, 2011) has several image matching models; in particular, one of the available sub pixel methods (Nefian et al, 2009) has similarities with LSM.
3. IMAGE AND REFERENCE DATA
3.1 Real images and reference DTM
A stereo pair of Hirise images (PSP_008669_1705 and PSP_009025_1705) that covers the sulphates and valley system in Melas Chasma basin (-9.5° latitude, 283.3° longitude) has been retrieved, together with the corresponding DTM (DTEEC_008669_1705_009025_1705_A01) from the Hirise website (http://hirise.lpl.arizona.edu). The PSP_008669_1705 image has been acquired on June 1, 2008. It has 26.6 cm/pixel resolution and the phase angle is 63.6°. The PSP_009025_1705
image was taken on June 29, 2008. It has a resolution of 26.7 cm/pixel and a phase angle of 52.7 °. According to the header cube data file, the DTM has been produced by A. McEwen and Sarah Mattson of the University of Arizona using SocetSet® from BAE Systems.
Data processing exploited the geometrically “raw” Experimental Data Records (EDRs) and orientation data in the form of NAIF SPICE kernels. The files were fed into ISIS3 (hi2isis) and radiometrically calibrated (hical); the CCD channel pair was merged into a single image (histitch); SPICE kernels for the specific camera cube were determined (spiceinit) and a function fit to camera pointing data (spicefit).
The HiRISE EDR products must be assembled using ISIS noproj. This program transforms input images by projecting them into ground coordinates (latitude and longitude) and then back into the image coordinates of an idealized, distortionless Hirise camera. All the red CCDs are projected into the perspective of the RED5 CCD. From there, hijitreg is performed to work out the relative offsets between CCDs. The CCDs are mosaicked together using the average offset listed from hijitreg using the handmos command. Finally, the images were orthorectified using cam2map.
Since our test schedule foresees the generation of several DTMs with different processing parameters, using the whole image would have required a computational effort not justified by the goal of this paper. We therefore selected three areas (named Are01, Area02 and Area03, see Figure 1) with different characteristics, each made of 2048x2048 pixels (i.e. about 500m x 500 m). Area01 is selected in a rough area, with some peaks, step edges and irregular terrain; Area02 covers a smooth slope where the image contrast is relatively low (few terrain features and low albedo differences); Area03 main features are small undulations a few meters high that look like sand dunes about 350 m long and about 10 m wide.
Figure 1 – Left: the Hirise image with the three patches processed; right: an enlargement of each patch and a colour coded image of the elevation.
3.2 Generation of synthetic images
To generate the synthetic images, three patches (the same where real images were used) were extracted from the Socet Set
reference DTM and imported in 3D Studio Max™. This software allows to define and place cameras in the scene, overlay objects with texture, control illumination and generate synthetic images of the scene. A cellular pattern available in the program library has been overlaid on the reference DTM. Two polar circular orbits spaced by 20° in longitude at an altitude of 250 km were generated. A virtual camera that simulates the Hirise sensor (focal length of 12000 mm, pixel size of the red band CCDs) produces at every position along the orbit one image of the artificial scene composed by one row of 2048 pixel; for sake of simplicity, no optical distortion was applied to the images and the principal point was placed at the centre of the scanline. Finally a routine stitches together each scan line, producing a single image for each camera. Using such synthetic images and the orientation data, a point cloud is generated by image matching and triangulation; the reconstruction error in object space can be evaluated point-wise as the distance of each point from the reference DTM.
4. DTM GENERATION PIPELINE AND TESTS PERFORMED
4.1 DTM generation using Hirise images
Hirise push-broom camera has indeed some outstanding features that make DTM generation challenging: its ground resolution allows a level of detail comparable to airborne photogrammetric images; thanks to the 1 microradian instantaneous field of view, the camera imaging model can be approximated locally as being affected by an affine distortion (i.e. techniques used with frame cameras can be applied to Hirise images as well, regardless of the different camera model if just few image lines are considered). DM usually produces epipolar (normal) images in a pre-processing stage, so that the matching algorithm can achieve more reliable results with one degree of freedom eliminated (i.e. the displacement/disparity across the epipolar lines direction). An attempt was made to force this kind of constraint also with Hirise images (locally the quasi-affine projection geometry of the camera should make the error due to using a pinhole camera model with a push-broom sensor negligible). Since we could not test the procedure in time, we preferred to use an established method for image pre-processing, but we plan to further investigate this problem. In the last pre-processing step the images are ortho-rectified (i.e. projected onto the reference surface of the Mars spheroid) so that perspective differences between the images acquired from different orbits can be reduced. Basically the result achieved is the same of epipolar image resampling (i.e. makes the master and slave image look more alike) even if the geometric constraint, in this case, cannot be applied.
Since the ortho-rectification of the images should have greatly reduced the perspective changes between the master and the slave image also a simple rotation invariant interest operator (e.g. Harris or Foerstner) should give good repeatability in the feature matching; nonetheless the SURF descriptors, usually very reliable, were used so that also scale invariance could be enforced. Finally, due to previous considerations on the camera geometry and since just a small portion of the orbit is considered every time, a RANSAC epipolar constraint is enforced to filter the outliers.
As far as the triangulation stage is concerned the peculiar features of the Hirise sensor (very long focal length and extremely high ground resolution) make the influence of interior and exterior orientation parameters critical for the final restitution accuracy. Since our interest, at this stage, is focused on comparing just the level of performance of the matching
algorithms, we opted to compute object coordinates using the same triangulation code, so that the differences that occur in the comparisons depend only on the matching stage. In particular the triangulation routines implemented in ASP were used, as they are more tested for this kind of application. The matched image coordinates are back-projected by the ASP triangulator on the original ones.
Eventually a GeoTiff raster DTM is obtained that is imported in a GIS software package and then re-projected to the Equi-Rectangular projection where the reference DTM is defined.
4.2 DTM generation using synthetic images
The workflow for DTM generation using synthetic images was much more straightforward. The images produced were processed by Dense Matcher to extract the image coordinates of homologous points. To this aim, a script is executed that records the position and pointing information of each camera at each line acquisition time, producing the exterior orientation data needed to reconstruct the DTM. However, our attempt to produce an ISIS cube file so that this data could also be processed in ASP failed; for the time being, the images were processed only with DM. The final model was therefore produced using our triangulation routines and the TIN (Triangulated Irregular Network) was directly output in the same reference system of the reference DTM.
Our triangulator implements a rigorous sensor model. It converts the pixel coordinates of the homologous points to their physical position with respect to the perspective centre as suggested by USGS in the Instrument kernel files.
The Exterior Orientation (EO) parameters of each line are retrieved by interpolating the spacecraft’s trajectory and pointing vectors by second-order polynomials (Li et al, 2008). Finally, the intersection point is found requiring the parallax vector in object space to have minimum length and the position of the ground point is defined at its mid-point.
4.3 DTM processing parameters
With the real images, for each of three areas, five different DTMs were produced, using both DM and ASP, by changing every time the template window size: 9x9, 13x13, 17x17, 21x21 and 25x25 pixel templates were used. With the synthetic images (processed with DM only) the same schema was applied. DM applied the LSM algorithm with a default value of the acceptance threshold for the matching set to 0.9. With ASP the SUBPIXEL_MODE 2 that implements a Bayes EM weighted affine adaptive window correlator (Nefian et al, 2009) was used, as recommended for high quality results; the mathematical models in the matching were therefore basically the same.
5. RESULTS
5.1 DTM comparison procedure
As mentioned before, the triangulation with real images has been executed in ASP using the navigation data of the Spice kernels: in other words no bundle adjustment was performed. Due to the different orientation procedure between SS and ASP, therefore, georeferencing inconsistencies arise. To remove these systematic differences a two step procedure was used within a 3D modelling software. First, large offsets between the two data sets were computed with an alignment based on manual identification of homologous DTM feature points; then,
to-surface alignment was applied to register the two datasets and analyse only differences in shape. The large offsets were computed using data from Area1 and applied also to Area2 and Area3; the offsets turned out to be in the order of 200 m in cartographic coordinates and about 300 m in elevation. Point-to-surface alignment was performed individually for each DTM produced; to this aim, the SS reference data set has been converted to a TIN representation and compared to each point cloud generated by ASP and DM. The signed distance of each point to the triangulated surface is the error measure that has been considered; due to the preliminary point-to-surface alignment, the average error is zero and therefore the Root Mean Square Error (RMSE) is measured by the Std. Dev. of the discrepancies.
As far as tests with the synthetic images are concerned, the comparison procedure is the same, apart from the application of the offsets, that is not necessary.
5.2 Accuracy of DTM elevations
5.2.1 Real images
The accuracy of the DTM reconstruction, measured with respect to the reference DTM, has been computed as a function of the template size used in the LSM with DM and in the sub pixel refinement (mode 2) of ASP. Figure 2 shows the RMSE both in graphical form as well as numeric form, in the three areas. The mean error depends, as can be expected, on the characteristics of the area. Area03, though with very small high differences, shows the largest average values, almost twice worse than in the other two areas; this is probably due to the ripples of the “waving” structure in the middle. Otherwise, the absolute value of the error is well within the expected relative accuracy in elevation for Hirise, i.e. about 15-20 cm (McEwen et al, 2007). The template size also affects the global accuracy, but the trend is not the same for the two programs. ASP show the same consistent trend in all areas: an increase of accuracy with the template size, until a floor is reached, with decreasing marginal improvements. DM shows the same trend in Area01 and Area02 but an opposite trend in Area03, where accuracy decreases with the template size. Keeping in mind that a 9x9 template corresponds to a surface of about 3m x 3m and a 25x25 template to about 7.5 m x 7.5 m, some improvement in accuracy in relatively smooth terrain should be expected, if the image texture is not too fine. In our experience with DTM generation in close range, there seems to be an optimal range for template size value according to object roughness. Here that range seems to start at T17 and might extend beyond T25. Overall, both DM and ASP show very similar values of accuracy, especially for larger template sizes.
Figure 2 – RMSE (m) of the discrepancies with respect to SS DTM for both ASP and DM DTMs as a function of the template size
Figure 3, 4 and 5 show the error maps for the DM DTMs generated with template size 25 respectively for Area01, Area02, Area03. As it is apparent, the errors are mostly correlated to the surface roughness; generally, the terrain generated turns out to be a smoothed version of the reference DTM, i.e. crests are lower and valleys are higher. White or grey colour represent areas where DM could not successfully match points. Figure 6 shows a portion of the DTM in Area01, with template size 25, compared to the reference DTM and to the image. The ASP and DM surfaces look quite similar and a bit sharper than the reference DTM, with step edges more clearly delineated.
Figure 3 – Error map: DM, Template 25, Area01
Figure 4 – Error map: DM, Template 25, Area02
Figure 5 – Error map: DM, Template 25, Area03
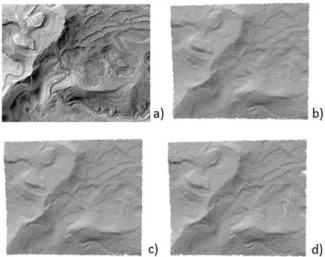
Figure 6 – Enlargement of DTM generation results in the central patch of Area01 (about 350 x 300 m): a) original image; b) reference DTM; c) ASP DTM; d) DM DTM
5.2.2 Synthetic images
The accuracy of the DTM reconstruction with synthetic images is summarized in Figure 7. Three comments can be made. The general trend is similar, though not identical, to that with real images: the terrain is a smoothed replica of the reference DTM. Accuracy still depend on template size: it improves from T09 to T17, then remains flat or seems even to get worse in Area01 and Area02; in Area03 there is a clear minimum (an optimal template size) at T13, with T25 less accurate than T09. It can also be noticed that the overall range of accuracy variation in each area is smaller (about 4 cm) with respect to real images (up to 10 cm).
Figure 7 - RMSE (m) of the DTM produced by DM from synthetic images, as a function of the template size.
In absolute terms, the accuracy obviously improves with respect to real images; in relative terms the gain varies by about 10% in each area, from 15% only in Area01 up to more than 50% in Area03. This highlights the component of image matching accuracy affected by texture.
5.3 Good matches percentage
As pointed out, the current implementation of DM does not have a “hole filling” strategy after the matching; this is normally performed at a later stage, when different models are put together and overlapping areas are merged. In this case, therefore, the hole filling strategy within ASP has been used with both ASP and DM disparity maps.
In the first series of test, with the threshold for acceptance set to 0.9, overall ASP had a much better score of good matches compared to DM. The percentage is also almost independent of template window size; the success percentage varies with the area, though, with Area03 being the worst (about 20% less points than in the other cases).
As can be seen from figure 8, DM shows significant differences in completeness both with respect to template size as well as with respect to the area. Indeed, from T9 to T25 the number of points increases by a factor 1.3 in Area01 up to 3.1 in Area03. As can be seen also from Figure 3, completeness in Area01 is generally very good apart from two areas with less texture; in Area02 (Figure 4) matches are spread evenly (no large empty gaps, but a “salt and pepper” pattern); in Area03 (Figure 5) there are two large gaps (with relatively poor texture) and other smaller ones clearly correlated to the morphology of the terrain.
Figure 8 – Number of matched points as a function of template window size in the three areas, DM, real images
In a second series of tests, our default acceptance threshold has been relaxed to 0.8. This brings the number of good matches in the same order as ASP: the total jumped from 1.6 Mpts to 4.5 Mpts (see Figure 9).
Figure 9 – Number of matched points with DM, T25, Area02: left: threshold 0.9, right: threshold 0.8
In order to check the effect on accuracy of the lower threshold, the DTM was compared to the reference DTM. Figure 10 shows the error colour map; the RMSE turned out to be 15 cm, i.e. the same value obtained with the higher threshold (see Figure 2). As far as synthetic images are concerned, the completeness is much better than with real ones even with the 0.9 threshold, with the best case close to 90% prior to hole filling. As with real data, there are still differences between the areas: Area02 has again the lowest score, with 30% less points than in the other two. Unlike with real images, though, there is no dependence at all of the number of matches on the template size.
Figure 10 – Error map: DM, Template 25, Area02 with threshold for matching acceptance 0.8
6. CONCLUSIONS
A first series of tests has been executed to study the performance of the DM algorithm with space images using both real and synthetic data. The comparison with the 1m spatial resolution SS DTM shows that DM provides elevation accuracies in the expected range for Hirise (15-20 cm) and quite the same as those achieved by ASP. With real images the discrepancies with respect to reference data depend on the template window size, both with ASP and with DM; relatively large templates (>13x13 pixel) seem to perform better. This may depend to some extent on the window size used in SS to generate the reference data; moreover, given the 25 cm ground resolution of the images, such trend is plausible, at least in less textured areas. Indeed, synthetic images with ideal texture and “true” reference DTM also show such dependence on template size. The accuracy improvement with respect to real images varies from 15% to 50%, depending on the area; the best improvement occurs in Area03, where the accuracy was about 38 cm in real images; Area03 still has the lowest accuracy also with synthetic images, though.
A hole filling procedure is foreseen to be implemented in the matching kernel of DM, to take advantage of the image matching quality at each point, coupled with a controlled relaxing of the acceptance threshold.
7. REFERENCES
Bay, H. et al., 2008. SURF: Speeded Up Robust Features.
CVIU, Vol. 110, No. 3, pp. 346—359.
Broxton, M. J., Edwards, L. J. 2008. The Ames Stereo Pipeline: Automated 3D Surface Reconstruction from Orbital Imagery. Lunar and Planetary Science Conference 39, abstract #2419. Broxton M. J. et al, 2011. The Ames Stereo Pipeline: NASA’s Open Source Automated Stereogrammetry Software. v. 1.0.5. http://ti.arc.nasa.gov/m/project/ngt/asp_book_1.0.5.pdf (10 Jan. 2012)
Cremonese G., et al, 2009. The stereo camera on the BepiColombo ESA/JAXA mission: a novel approach, 2009,
Advances in Geosciences, Vol. 15, pp.305-322.
Gwinner, K et al., 2010. Topography of Mars from global mapping by HRSC high-resolution digital terrain models and orthoimages: Characteristics and performance. Earth and Planetary Science Letters 294 (2010): pp. 506–519.
Grün, A., 1985. Adaptive least squares correlations: a powerful matching techniques. South African J. Photogramm. Remote Sensing and Cartography, 14(3), pp. 175-187.
Grün, A., Baltsavias, E.P., 1988. Geometrically constrained multiphoto matching. PE&RS, 54(5), pp. 633-641.
Gwinner, K., et al, 2009. Derivation and validation of high resolution digital terrain models from Mars Express HRSC data,
PE&RS, 75(9), pp. 1127-1142.
Heipke, C. et al, 2007. Evaluating planetary digital terrain models - The HRSC DTM test, Planetary and Space Science, Vol. 55, Issue 14, pp. 2173-2191.
Kass, M., Witkin, A., Terzopoulos, D., 1987. Snakes - Active Contour Models. Int. J. Computer Vision, 1(4), pp. 321-331.
Kirk, R. L. et al. 2008. Ultrahigh resolution topographic mapping of Mars with MRO HiRISE stereo images: Meter-scale slopes of candidate Phoenix landing sitesJ. Geophysical Research, 113, E00A24, 2008.
Li, R., Hwangbo, J. W., Chen, Y., Di, K., 2008. Rigorous photogrammetric processing of Hirise stereo images for Mars topographic mapping. In: IAPRSSIP, Vol. XXXVII, Part B4. Beijing 2008, pp. 987-992.
Massironi M. et al., 2008. Simulations using terrestrial geological analogues to asses interpretability of potential geological feature of the Hermean surface restituted by the STereo imaging Camera of the SIMBIO-SYS package (BepiColombo mission). Planetary and Space Science 56 (2008), pp. 1079–1092
McEwen. A et al., 2007. Mars Reconnaissance Orbiter’s High Resolution Imaging Science Experiment (HiRISE). J. Geophysical Research, Vol. 112, E05S02, 40 pp.
Moratto, Z., Broxton, M.J., Beyer, R.A., Lundy, M., Husmann, K. Ames Stereo Pipeline, NASA’s Open Source Automated Stereogrammetry Software. 41st LPSC Conference (2010)
Nefian, A., Husmann, K. Broxton, M., To, V., Lundy, M., Hancher, M, 2009. A Bayesian Formulation for Sub-pixel Refinement in Stereo Orbital Imagery. Proc. of the 2009 IEEE Int. Conf. on Image Processing. 2009, pp. 2361-2364.
Simioni E. et al, 2011. A new stereo algorithm based on snakes.
PE&RS, vol. 77/5, May 2011, pp. 495-507.
Torson, J.M., and Becker, K.J., (1997) ISIS - A Software Architecture for Processing Planetary Images (abs.), LPSC XXVIII, pp. 1443-1444.
Acknowledgements
This research has made use of the USGS Integrated Software for Imagers and Spectrometers (ISIS). USGS, NASA, JPL and the University of Arizona are acknowledged for providing image and reference data.