ACPD
14, 31319–31360, 2014BVOC and H2SO4
influcence on particle formation
M. Dal Maso et al.
Title Page
Abstract Introduction
Conclusions References
Tables Figures
◭ ◮
◭ ◮
Back Close
Full Screen / Esc
Printer-friendly Version
Interactive Discussion
Discussion
P
a
per
|
Discussion
P
a
per
|
Discussion
P
a
per
|
Discussion
P
a
per
Atmos. Chem. Phys. Discuss., 14, 31319–31360, 2014 www.atmos-chem-phys-discuss.net/14/31319/2014/ doi:10.5194/acpd-14-31319-2014
© Author(s) 2014. CC Attribution 3.0 License.
This discussion paper is/has been under review for the journal Atmospheric Chemistry and Physics (ACP). Please refer to the corresponding final paper in ACP if available.
A chamber study of the influence of
boreal BVOC emissions and sulphuric
acid on nanoparticle formation rates at
ambient concentrations
M. Dal Maso1, L. Liao2, J. Wildt4, A. Kiendler-Scharr3, E. Kleist4, R. Tillmann3, M. Sipilä2, J. Hakala2, K. Lehtipalo2, M. Ehn2, V.-M. Kerminen2, M. Kulmala2, D. Worsnop2, and T. Mentel3
1
Tampere University of Technology, Department of Physics, P.O. Box 692, 33100 Tampere, Finland
2
Department of Physics, University of Helsinki, P.O. Box 64, 00014, Helsinki, Finland
3
IEK-8, Forschungszentrum Jülich, 52425 Jülich, Germany
4
IBG-2, Forschungszentrum Jülich, 52425 Jülich, Germany
Received: 8 October 2014 – Accepted: 9 November 2014 – Published: 11 December 2014 Correspondence to: M. Dal Maso ([email protected])
ACPD
14, 31319–31360, 2014BVOC and H2SO4
influcence on particle formation
M. Dal Maso et al.
Title Page
Abstract Introduction
Conclusions References
Tables Figures
◭ ◮
◭ ◮
Back Close
Full Screen / Esc
Printer-friendly Version
Interactive Discussion
Discussion
P
a
per
|
Discussion
P
a
per
|
Discussion
P
a
per
|
Discussion
P
a
per
|
Abstract
Aerosol formation from biogenic and anthropogenic precursor trace gases in conti-nental background areas affects climate via altering the amount of available cloud condensation nuclei. Significant uncertainty still exists regarding the agents control-ling the formation of aerosol nanoparticles. We have performed experiments in the 5
Jülich Plant-Atmosphere Simulation Chamber with instrumentation for the detection of sulphuric acid and nanoparticles, and present the first simultaneous chamber obser-vations of nanoparticles, sulphuric acid, and realistic levels and mixtures of biogenic volatile compounds (BVOC). We present direct laboratory observations of nanoparticle formation from sulphuric acid and realistic BVOC precursor vapor mixtures performed 10
at atmospherically relevant concentration levels. We directly measured particle forma-tion rates separately from particle growth rates. From this, we established that in our experiments, the formation rate was proportional to the product of sulphuric acid and biogenic VOC emission strength. The formation rates were consistent with a mech-anism in which nucleating BVOC oxidation products are rapidly formed and activate 15
with sulphuric acid. The growth rate of nanoparticles immediately after birth was best correlated with estimated products resulting from BVOC ozonolysis.
1 Introduction
Studies in ambient environments have identified several strong candidates to act as the responsible agents for nanoparticle formation, the strongest being the sulphuric acid 20
molecule, H2SO4 (Weber et al., 1996; Sipila et al., 2010; Kuang et al., 2008). Climate and other effects of atmospheric aerosols are tied strongly with their concentrations, and, in that way, on aerosol sources. Current experimental and theoretical understand-ing of nanoparticle formation suggests that in addition to H2SO4, other compounds are needed to stabilise the initial clusters of sulphuric acid to initiate new particle forma-25
ACPD
14, 31319–31360, 2014BVOC and H2SO4
influcence on particle formation
M. Dal Maso et al.
Title Page
Abstract Introduction
Conclusions References
Tables Figures
◭ ◮
◭ ◮
Back Close
Full Screen / Esc
Printer-friendly Version
Interactive Discussion
Discussion
P
a
per
|
Discussion
P
a
per
|
Discussion
P
a
per
|
Discussion
P
a
per
and theoretical evidence has shown that basic gases, e.g. ammonia or certain amines could act as such stabilising agents (Almeida et al., 2013; Smith et al., 2010; Berndt et al., 2010).
In addition to these bases, various organic compounds have been proposed to par-ticipate in the particle formation process (Zhang et al., 2004; Paasonen et al., 2010; 5
Metzger et al., 2010; O’Dowd et al., 2002). Several laboratory studies have shown ev-idence of biogenic emitted volatile organic compounds (BVOCs) acting as precursors for aerosol number formation (Schobesberger et al., 2013; Ehn et al., 2014; Mentel et al., 2009; Hao et al., 2009; Joutsensaari et al., 2005); particle formation has been shown to correlate positively with the amount of precursor BVOCs, but also depend 10
strongly on the composition of emitted BVOC mixture (Mentel et al., 2009; Kiendler-Scharr et al., 2009); it has been shown that vegetation stress conditions clearly in-fluence the amount of secondary aerosol formed from oxidising plant emissions in addition to model compound studies. (Mentel et al., 2013).
Despite the strong evidence of plant-emitted BVOC influencing the formation pro-15
cess of new particles, the question of the respective roles of plant volatiles and sul-phuric acid in the initial formation process remains open. Detailed, formation-specific measurements with quantification of sulphuric acid and realistic BVOC mixture emis-sions at concentration levels corresponding to the natural atmosphere are currently still lacking. In this study, we performed such measurements to elucidate the role of plant 20
BVOC oxidation and sulphuric acid in atmospheric aerosol formation.
Using the capability of the Particle Size Magnifier (PSM Vanhanen et al., 2011) to observe particles at sizes where they are born, we performed a set of experiments at the Jülich Plant-Atmosphere Chamber (setup see Mentel et al., 2009). Emissions from a group of small trees, representative for the boreal forest species, were introduced 25
ACPD
14, 31319–31360, 2014BVOC and H2SO4
influcence on particle formation
M. Dal Maso et al.
Title Page
Abstract Introduction
Conclusions References
Tables Figures
◭ ◮
◭ ◮
Back Close
Full Screen / Esc
Printer-friendly Version
Interactive Discussion
Discussion
P
a
per
|
Discussion
P
a
per
|
Discussion
P
a
per
|
Discussion
P
a
per
|
this paper, we will give an overview of the dataset obtained in our measurements, and present the results of the particle formation and growth rate analysis together with a dis-cussion of the particle formation mechanism that could lead to our observations. The experiment is, to our knowledge, the first experimental series in which realistic BVOC mixtures (in terms of both concentration levels and composition) have been measured 5
together with realistic H2SO4concentrations. As the dataset presents an excellent op-portunity to test the performance of the aerosol dynamics process model MALTE (Boy et al., 2006), we have also simulated the dataset using the aforementioned model; the results of the detailed aerosol dynamics and gas phase chemistry simulations will be presented in a companion paper (Liao et al., 2014, submitted to ACPD). In this paper, 10
our aim is to test the hypotheses that (a) BVOCs contribute to the nanoCN formation process itself, (b) that sulphuric acid is participating in the formation process, and that (c) organic oxidation compounds are critical for the growth of small particles. In addi-tion, our aim is to discuss our findings with respect to the possible gas-phase reactions leading to compounds participating in particle formation, and the role of boreal forest 15
BVOC emissions in realistic concentrations.
2 Materials and methods
2.1 The JPAC chamber setup
A detailed description of the chamber setup used for these experiments (Jülich Plant - Atmosphere Chamber facility, JPAC) and its performance is given in Mentel et al. 20
(2009). In short, the facility consisted of two Borosilicate glass chambers (Volumes 1150 and 1450 L) with Teflon floors. Each chamber was mounted in separate climate controlled housing separately adjustable to temperatures between 10 and 50◦C. Dis-charge lamps (HQI 400 W/D; Osram, Munich, Germany) were used to simulate the solar light spectrum. At full illumination and at typical mid-canopy heights photosyn-25
ACPD
14, 31319–31360, 2014BVOC and H2SO4
influcence on particle formation
M. Dal Maso et al.
Title Page
Abstract Introduction
Conclusions References
Tables Figures
◭ ◮
◭ ◮
Back Close
Full Screen / Esc
Printer-friendly Version
Interactive Discussion
Discussion
P
a
per
|
Discussion
P
a
per
|
Discussion
P
a
per
|
Discussion
P
a
per
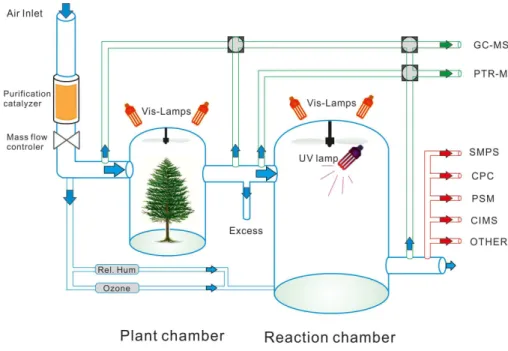
the experiments described here PPFD in the 1450 L chamber was 60 µmol m−2s−1. The smaller chamber was used as plant chamber and the larger chamber was used as reaction chamber. A schematic of the plant chamber setup is given in Fig. 1. The gen-eral operation of the plant chamber was similar to the procedures described in Mentel et al. (2009). Cleaned air was pumped through the plant chamber and a fraction of the 5
air leaving the plant chamber (≈20 L min−1) was fed into a reaction chamber. Besides
the inlet for the air from the plant chamber, the reaction chamber had another separate inlet to add ozone and to allow keeping the humidity in the reaction chamber con-stant. The conditions in the reaction chamber were held constant for all experiments (T =15±0.5◦C, rH=62±2 %, [O3]=60–70 ppb without UV light and 30 to 35 ppb with
10
UV light). OH radicals were generated by ozone photolysis (internal UV lamp, Philips, TUV 40W,λmax=254 nm,J(O
1
D)≈2.9 10−3s−1) and subsequent reaction of O1D with
water. Three to four years old tree seedlings brought from Hyytiälä were used to study SOA formation. Species used were Norwegian spruce (Picea abies L.) Scots pine (Pinus sylvestris L.), and Silver birch (Betula pendula L.). Before the measurements 15
the plants were stored outside near to a forest to obtain realistic conditions with all the environmental impacts plants experience in their environment. After that the trees were introduced in the plant chamber and allowed to adapt to the chamber for several days. While the conditions in the reaction chamber were held strictly constant those in the plant chamber were varied from experiment to experiment. Changing tempera-20
ture and PPFD in the plant chamber caused changes of the emission strengths and thus changes of the source strengths for the reactants in the reaction chamber. This procedure allowed determining the impact of the BVOC load on nucleation of nanopar-ticles. Generation of OH radicals was performed when the BVOC concentrations in the reaction chamber were near to steady state. New particle formation was induced only 25
ACPD
14, 31319–31360, 2014BVOC and H2SO4
influcence on particle formation
M. Dal Maso et al.
Title Page
Abstract Introduction
Conclusions References
Tables Figures
◭ ◮
◭ ◮
Back Close
Full Screen / Esc
Printer-friendly Version
Interactive Discussion
Discussion
P
a
per
|
Discussion
P
a
per
|
Discussion
P
a
per
|
Discussion
P
a
per
|
changed allowing a new steady state to be reached in the reaction chamber for the next experiment. OH radical induced particle formation was measured by a suite of instruments following the particles from sizes of 1 up to 600 nm.
2.2 Measurements
The aim of the measurements was to quantify the rate of particle formation during 5
OH-induced oxidation while varying the amount of BVOC introduced into the reaction volume, and to simultaneously observe the variation of sulphuric acid concentrations. The setup for characterising the formation experiments is described in the following sections.
2.2.1 CIMS
10
Sulphuric acid was measured with a chemical ionisation mass spectrometer, CIMS (Petäjä et al., 2009; Mauldin et al., 1998). In the measurement, the sulphuric acid is chemically ionised by (NO−3) ions in the sample flow. The reagent ions are generated by a241Am alpha source and nitric acid, and then mixed in a controlled manner in a drift tube with concentric sheath and sample flows together with electrostatic lenses. Then, 15
the chemically ionised sulphuric acid molecules pass through a layer of dry nitrogen flow in order to dehydrate the sulphuric acid prior to entering the vacuum system. Once in the vacuum system, the sulphuric acid clusters are dissociated to the core ions by collisions with nitrogen gas seeping through the pinhole in the collision-dissociation chamber. The sample beam, collimated with a set of conical octopoles, is detected 20
with a channeltron after mass filtration with a quadrupole. The sulphuric acid concen-tration is determined by the ratio between the signals at mass 97 amu (HSO−
4) and the reagent ion at mass 62 amu (NO−3) multiplied by the instrument and setup dependent calibration factor. The instrument used in this study was the same as that used in the studies by Sipila et al. (2010). The nominal detection limit of the CIMS is 5×104cm−3
25
ACPD
14, 31319–31360, 2014BVOC and H2SO4
influcence on particle formation
M. Dal Maso et al.
Title Page
Abstract Introduction
Conclusions References
Tables Figures
◭ ◮
◭ ◮
Back Close
Full Screen / Esc
Printer-friendly Version
Interactive Discussion
Discussion
P
a
per
|
Discussion
P
a
per
|
Discussion
P
a
per
|
Discussion
P
a
per
given as factor of 2. Additionally, losses in the sampling line cause additional uncer-tainty in our measurement. However, these uncertainties represent a constant factor in the absolute values observed, whereas our analysis depends on relative changes in the observed concentration. Therefore, whenever shown, we show the part of un-certainty representing random error in our plots, estimated as the short-term SD after 5
de-trending the measurement. When comparing to other observations, the instrument specific uncertainty is cancelled out by the fact that most other sulphuric acid observa-tions available in literature are obtained using similar instrumentation (Paasonen et al., 2010) or even the same instrument (Sipila et al., 2010; Petäjä et al., 2009).
2.2.2 VOC measurements
10
The concentrations of plant-emitted volatile organic compounds were determined by Proton Transfer Reaction Mass Spectrometry and by a Gas Chromatography Mass Spectrometer. The PTR-MS measurement were performed with a time resolution of 10 min and the PTR-MS was switched between the outlet line of the plant chamber and the outlet line of the reaction chamber. The reactant source rate to the reaction 15
chamber was deduced by accounting for the dilution factor caused by ozone and water vapor addition to the plant chamber outflow (Mentel et al., 2009). The GC-MS system was optimised to measure BVOC from C5 to C20. It was used to identify individual BVOC and to quantify its concentrations at the outlet of the plant chamber. Another GC-MS system was used to quantify OH concentrations by determining the decrease 20
in concentration of a tracer compound in the reaction chamber (Kiendler-Scharr et al., 2009). Calibration of all systems was conducted as described in Heiden et al. (2003).
2.2.3 Aerosol measurements
The physical characterisation of aerosol populations was performed with a set of in-struments, with the aim of very detailed characterisation of the nano-CN formation size 25
ACPD
14, 31319–31360, 2014BVOC and H2SO4
influcence on particle formation
M. Dal Maso et al.
Title Page
Abstract Introduction
Conclusions References
Tables Figures
◭ ◮
◭ ◮
Back Close
Full Screen / Esc
Printer-friendly Version
Interactive Discussion
Discussion
P
a
per
|
Discussion
P
a
per
|
Discussion
P
a
per
|
Discussion
P
a
per
|
Scanning Mobility Particle Sizer (SMPS TSI3071+TSI3025A) was used to measure the particle size distribution in the size range 15–600 nm. We used a TSI condensation particle counter (CPC TSI3022A) with a lower detection size limit of 7 nm to measure the total number of particles larger than 7 nm. To detect the smallest particles, we used a Particle Size Magnifier (PSM, Airmodus A09 prototype) to lower the cut-off size of 5
a TSI CPC TSI3022A. In the PSM the aerosol is turbulently mixed with air saturated with diethylene glycol, therefore creating a supersaturation high enough to activate even 1 nm ions, the nominal cut-off size being about 1.6 nm. The PSM was situated next to the reaction chamber, inside the thermal insulation, to minimize tube losses. The sampling line length was approximately 1 m.
10
2.3 Experimental overview
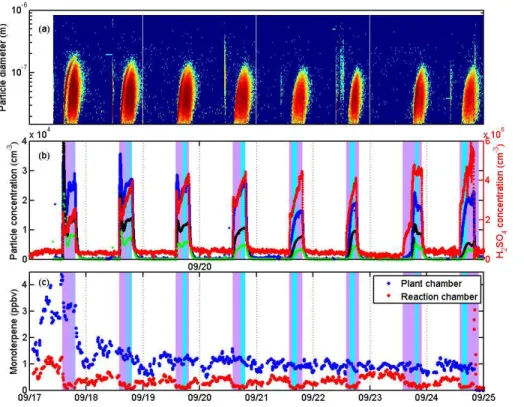
During the experimental campaign, we performed a VOC and SO2 oxidation experi-ment roughly once every day. Aiming for atmospheric concentrations of VOC and sul-phuric acid, we gradually reduced BVOC concentrations by reducing the temperature in the plant chamber; by varying the amount of OH generated we reduced the sulphuric 15
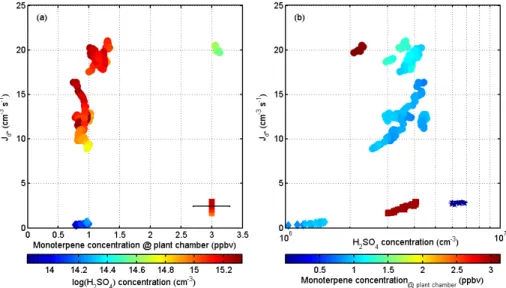
acid production rate. For a given OH source strength, determined by the UV flux (open-ing of the UV shield(open-ing), O3 and water concentration in the reaction chamber, the OH level is to a large extent determined by the amount of OH-reactive VOC available in the chamber. The sulphuric acid concentrations observed were ca. (3–4)×105cm−3
in non-oxidising periods (UV light off). During OH production, the observed concentra-20
tions were between 1.5×106cm−3and 1.0×107cm−3. The lowest concentrations were
obtained during an experiment in which no ozone was added to the reaction chamber (the afternoon of 23 September). This was due to the production mechanism of OH, which depends on the O3 concentration. Depending on the conditions in the reaction chamber, OH concentrations deduced from GC-MS measurements were in the range 25
ACPD
14, 31319–31360, 2014BVOC and H2SO4
influcence on particle formation
M. Dal Maso et al.
Title Page
Abstract Introduction
Conclusions References
Tables Figures
◭ ◮
◭ ◮
Back Close
Full Screen / Esc
Printer-friendly Version
Interactive Discussion
Discussion
P
a
per
|
Discussion
P
a
per
|
Discussion
P
a
per
|
Discussion
P
a
per
experiments with pure alpha-pinene on the 27 September, and zero experiments (no BVOC added to the chamber) on 26 September and 1 October (with added SO2).
2.3.1 PSM detection size in relation to the particle formation size
A key factor in our experiment was our ability to detect freshly formed aerosol particles very shortly after they had been formed, and before they had grown significantly. In 5
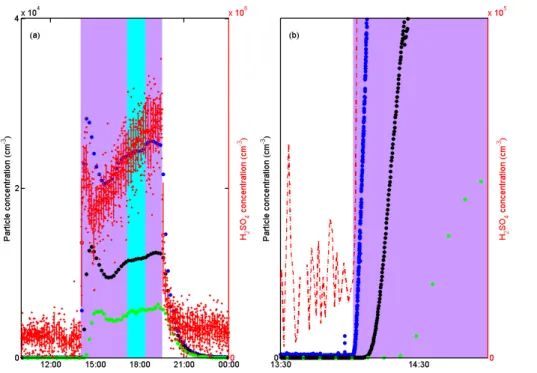
the following, we will present the justification that this assumption was indeed correct. When the UV light was switched offin the chamber, the nanoparticle concentration ob-served by the PSM was approx. 100–200 cm−3
. When applying a HEPA filter to the inlet line, the instrument showed 10–15 counts cm−3. This is in line with the small amount of sulphuric acid present in the chamber at this time, and also proves that no signifi-10
cant contribution from nucleation inside the instrument was present. Upon igniting the UV light, the particle concentration seen by the PSM started to increase almost im-mediately, as did the sulphuric acid concentration (see Fig. 3). We consider the short time difference between the start of OH production and increase in the concentration measured by the PSM as proof of measuring nanoparticles at the size at which they 15
are formed. We have tabulated the time that elapsed from the moment of UV ignition to the time that the PSM concentration reading reached a multiple of 2 and 5 of the “dark” concentration in Table 1. If we now consider the case of the highest growth rates of the 1.6–7 nm particles, (ca. 90 nm h−1, see Sect. 3.2) and factor in a ∆t of 16 s to doubling the particle concentration, we get at maximum a 0.4 nm difference between 20
the detection limit of the PSM and the formation size of particles. This is likely an over-estimation, since the rise in concentration can be clearly recognised earlier than the 16 s used. One has also to assume a timescale for the nucleation process itself, as well as a transport time from inside the chamber to the instrument. (The nucleation process gives a timespan of ca. 10 s for doubling the concentration of 150 cm−3, applying the 25
ACPD
14, 31319–31360, 2014BVOC and H2SO4
influcence on particle formation
M. Dal Maso et al.
Title Page
Abstract Introduction
Conclusions References
Tables Figures
◭ ◮
◭ ◮
Back Close
Full Screen / Esc
Printer-friendly Version
Interactive Discussion
Discussion
P
a
per
|
Discussion
P
a
per
|
Discussion
P
a
per
|
Discussion
P
a
per
|
2.4 Obtaining particle formation rates
A fresh nanoparticle of a size range [dp,dp+ ∆dp] formed in the reaction chamber can have the following fates during its lifetime: (i) it grows to a larger size (ii) it coagulates with other particles (iii) it is lost to chamber walls (iv) it is flushed out of the chamber into the sampling line. Therefore, for the particle concentrationNi in our size range, we 5
can write for its change in time
dNi
dt =Ji−CiNi−Ni
X
j
Ki jNj−ω
iNi−γNi (1)
HereinJi is the formation rate of particles in the size range,ωis a size-dependent wall loss parameter,C is the growth rate out of the size range,Ki j is the coagulation
coefficient between particles in size rangesi andj andγ is the flush out. For the next-10
largest size rangeNi+1,Ji+1is equal toCiNi. Therefore, for sequential size ranges, we
can write:
dN1
dt =J1−J2−N1
X
j
K1jNj−ω1N1−γN1 (2)
dN2
dt =J2−J3−N2
X
j
K2jNj−ω2N2−γN2 (3)
.. . 15
dNn
dt =Jn−Jn+1−Nn
X
j
KnjNj−ω
nNn−γNn (4)
ACPD
14, 31319–31360, 2014BVOC and H2SO4
influcence on particle formation
M. Dal Maso et al.
Title Page
Abstract Introduction
Conclusions References
Tables Figures
◭ ◮
◭ ◮
Back Close
Full Screen / Esc
Printer-friendly Version
Interactive Discussion
Discussion
P
a
per
|
Discussion
P
a
per
|
Discussion
P
a
per
|
Discussion
P
a
per
derivatives, we can now solve forJ1and arrive at
J1=
n
X
i=1
d Nn d t +
n
X
i=1
X
j
KnjNj+ωn+γ
Ni (5)
The coagulation coefficient was calculated using the Fuchs flux matching theory and the dilution (flushout) was taken from measured chamber flow rates. We now as-sume that the rate of formation at the detection limit of the PSM, measuring the 5
smallest particles, was our formation rate of nanoparticles. The size ranges that we used for analysis were based on the instrumentation available:N1.6–7 nm,N7–15 nm, and
N>15 nm. These correspond to concentrations measured with different instruments:
N1.6–7 nm=NPSM−NCPC,N7–15 nm=NCPC−NSMPS, and N>15 nm=NSMPS, the concen-trations referring to the total concenconcen-trations measured by the instruments indicated by 10
the subscripts. The benefit of this approach is the fact that no measurement-based estimate of the growth rate is required. Therefore, we can obtain a formation rate in-dependently from the growth rate. On 23 September in the afternoon, we performed an experiment in which the O3supply was turned offfor the afternoon, and the cham-ber was illuminated with the UV light. This lead to a low formation rate of particles, but 15
most crucially, also the growth rate of particles was very low, and practically no particles reached the detection size of the CPC. Therefore, we did not apply the aforementioned method for this period, but instead simply used the time differential of the PSM data corrected with losses to obtain the formation rate. These points are indicated sepa-rately in the results. After the ozone supply was turned on later, we observed a normal 20
particle formation event (see Fig. 2). Wall losses were empirically assessed in experi-ments from the concentration fall-offafter the UV was turned off, and found to be small for larger particles (>7 nm) when compared to the dilution flow; for the smallest size range, the wall losses were estimated to be 5×10⁻⁴s−1, which is of the order of the
ACPD
14, 31319–31360, 2014BVOC and H2SO4
influcence on particle formation
M. Dal Maso et al.
Title Page
Abstract Introduction
Conclusions References
Tables Figures
◭ ◮
◭ ◮
Back Close
Full Screen / Esc
Printer-friendly Version
Interactive Discussion
Discussion
P
a
per
|
Discussion
P
a
per
|
Discussion
P
a
per
|
Discussion
P
a
per
|
2.5 Obtaining particle growth rates
At the start of a particle formation pulse, one can obtain the particle growth rates follow-ing the time delays in the rise of the particle concentration of PSM, CPC, and SMPS, similarly to the analysis to determining the detection size of the PSM. We used the size sections 1.6–7 nm (PSM-CPC) and 7–15 nm (CPC-SMPS), which again corre-5
spond to the detection limits of the instruments used. The growth rate was obtained by dividing the difference of the lower and upper diameter of the size section with the time difference of observingN0.5×max, the concentration that was 50 % of the maximum concentration observed. This is also the time of the maximum time differential in the concentration of each instrument, which can be interpreted as the peak of a log-normal 10
fresh mode passing the detection limit. Therefore, this method gives us the change in time of the count mean diameter of the fresh particle population, which is the conven-tional parameter used to represent growth rates of fresh particle population (see e.g. Leppä et al., 2011)
3 Results and discussion
15
In the following sections, we will show the results of the particle formation experiments, show the relation between the observed particle formation rates, sulphuric acid, and plant-emitted VOC concentrations, discuss the particle growth rates, and discuss the possible particle formation mechanisms that could explain the observed correlations.
3.1 Particle formation rates related to sulphuric acid and VOC emissions
20
ACPD
14, 31319–31360, 2014BVOC and H2SO4
influcence on particle formation
M. Dal Maso et al.
Title Page
Abstract Introduction
Conclusions References
Tables Figures
◭ ◮
◭ ◮
Back Close
Full Screen / Esc
Printer-friendly Version
Interactive Discussion
Discussion
P
a
per
|
Discussion
P
a
per
|
Discussion
P
a
per
|
Discussion
P
a
per
alpha-pinene) yield OH as a by-product, the formed particles may be produced by the OH-reactions, and ozonolysis does not participate in particle production. These parti-cles never grew to sizes where they could be observed by the CPC at 7 nm. Based on this observation, we can state that BVOC ozonolysis alone cannot be responsible for observed atmospheric particle formation.
5
Clearly detectable particle formation was observed when the UV light was turned on. To derive the nano-CN formation rates at the PSM detection limit, we applied the data analysis methods described in Sect. 2.4 to the measured particle number con-centration and size distribution data. This resulted in a time series of particle formation rates covering the whole particle formation event period. As the method relies on the 10
assumption of a quasi-steady-state in the particle size distribution, we selected time periods during which changes in the particle concentrations, the size distribution, and BVOC observations were slow (see Fig. 2) for the formation rate analysis. We found that during a single event, after the initial burst of particles, sulphuric acid concentra-tions slowly increased as time progressed; simultaneously, also particle formation rates 15
increased proportionally to the H2SO4concentration. However, when conditions in the plant chamber were adjusted to change the VOC emission rates, the rate of formation for similar H2SO4concentrations markedly changed (see Fig. 4).
A decrease in VOC inflow into the reaction chamber corresponded to a decrease in nano-CN formation rates. This was in line with existing hypotheses that compounds 20
formed by the oxidation of plant-emitted VOCs are key compounds in the formation of new particles. Our dataset contained two experiments in which we modulated the input into the reaction chamber: on 23 September, we turned off the ozone input to the chamber and turned the UV light on, and on 27 September, we replaced the plant chamber inflow with pure alpha-pinene. These days are indicated separately in Fig. 4, 25
as the data analysis for those days was different than for the rest of the data. For the no-ozone experiment, sulphuric acid levels were very low ((1–2)×106cm−3), and the
steady-ACPD
14, 31319–31360, 2014BVOC and H2SO4
influcence on particle formation
M. Dal Maso et al.
Title Page
Abstract Introduction
Conclusions References
Tables Figures
◭ ◮
◭ ◮
Back Close
Full Screen / Esc
Printer-friendly Version
Interactive Discussion
Discussion
P
a
per
|
Discussion
P
a
per
|
Discussion
P
a
per
|
Discussion
P
a
per
|
state BVOC concentration was markedly higher both for the dark period and the UV-on period, in line with the removal of the ozonolysis reaction pathway and the reduction of OH production from ozone photolysis. The nano-CN formation rate calculation for this experiment was based only on PSM data, as described in Sect. 2.4. For the alpha-pinene experiment, we had no direct measurement of the BVOC source rate, as the 5
plant chamber was bypassed; however, we can estimate the source rate from the dark-time steady state concentration in the reaction chamber. The concentration was simi-lar to the concentration at the highest plant-induced event, corresponding to an plant chamber concentration of 3–4 ppb. However, the particle formation rate was very much lower than during the plant-induced events (Fig. 2) despite the sulphuric acid level be-10
ing at a similar level to the strongest of those events. This makes the alpha-pinene event a clear outlier of our data, and it has been excluded from the following correlation analysis.
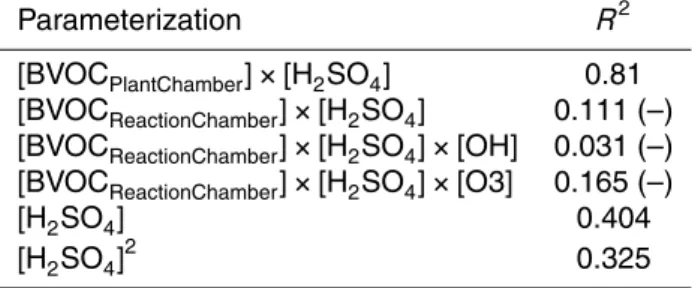
Following the methodology of earlier studies (e.g. Paasonen et al., 2010), we at-tempted to relate the observed particle formation rate to the product of BVOC and 15
oxidants (O3 and OH), and sulphuric acid in the reaction chamber, corresponding the following formulation for the formation rateJ:
J=K
×[BVOC]SS×[Ox]SS×[H2SO4]
CS (6)
where the concentrations [BVOC]SS and [Ox]SS refer to steady-state concentrations of precursor BVOC and their oxidants, ozone and the hydroxyl radical. CS stands for 20
the condensation sink. Despite findings reported in literature, little correlation could be found with this approach (see Table 2). However, when we used the VOC inflow rate (QBVOC, obtained from the flow rate from the plant chamber to the reaction chamber carrying the measured VOC concentration in the plant chamber, with dilution accounted for) multiplied with the sulphuric acid concentration, i.e. a parameterization of the form 25
ACPD
14, 31319–31360, 2014BVOC and H2SO4
influcence on particle formation
M. Dal Maso et al.
Title Page
Abstract Introduction
Conclusions References
Tables Figures
◭ ◮
◭ ◮
Back Close
Full Screen / Esc
Printer-friendly Version
Interactive Discussion
Discussion
P
a
per
|
Discussion
P
a
per
|
Discussion
P
a
per
|
Discussion
P
a
per
we found very good correlation (R2=0.81) with the observed particle formation rate in the reaction chamber (as seen in Fig. 5). The coefficient k in Eq. (7) can be de-rived from the least-square fit to our observation data, and in our experiments it was 1.1×10⁻¹²cm3, with Q expressed as molecules (cm3s)−1. Note that this formulation
does not include a concentration of the organic compound, as commonly used, but 5
rather a source rate of the precursor. We will discuss this, and the rest of our find-ings in relation to different particle formation mechanisms in Sect. 3.3, and discuss the implications for atmospheric particle formation in Sect. 3.4.
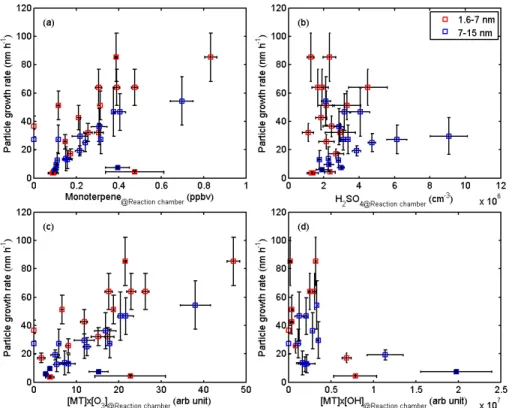
3.2 Particle growth rates related to sulphuric acid and VOC concentrations
To study the effect of sulphuric acid and plant-emitted BVOC on the early growth of 10
particles, we obtained the growth rate of particles at the start of each particle formation burst from the time-difference analysis as described in Sect. 2.5. The results of the analysis are presented in Fig. 6 for two size ranges, 1.6–7 nm (the dection limits of the PSM and the CPC) and 7–15 nm (detection limits of the CPC and SMPS). Over the experiments performed during the campaign, the growth rate of fresh particles ranged 15
from ca. 3 up to ca. 90 nm h−1
. During the no-ozone experiment on 23 September, particle growth rate could not be obtained due to the particles not reaching the CPC detection limit during the 3.5 h that ozone was off; therefore, we assume that the growth rate during this time was clearly below 2 nm h−1
. During the alpha-pinene experiment on 27 September, the growth rates differed from the general trend and they are there-20
fore indicated in the result figures. We found that the growth rate of particles was well correlated with the BVOC concentration in the plant chamber at the start of the particle formation burst (Fig. 6a).
The growth rate of 1.6–7 nm particles was generally somewhat higher than for the larger particles; this is somewhat surprising, because recent literature (e.g. Kulmala 25
ACPD
14, 31319–31360, 2014BVOC and H2SO4
influcence on particle formation
M. Dal Maso et al.
Title Page
Abstract Introduction
Conclusions References
Tables Figures
◭ ◮
◭ ◮
Back Close
Full Screen / Esc
Printer-friendly Version
Interactive Discussion
Discussion
P
a
per
|
Discussion
P
a
per
|
Discussion
P
a
per
|
Discussion
P
a
per
|
species: quick oxidation of BVOC already in the chamber leads to higher low-volatility vapour concentrations at the start of the event. However, due to their short lifetime and the decline of precursor BVOC by oxidation, their concentration at the time particles have reached the size of 7 nm will have diminished, causing lower growth rates. The growth rate showed little correlation with the measured concentration of sulphuric acid 5
(Fig. 6b). This we interpret as an evidence of the growth of particles being dominated by the condensation of organic species resulting of the oxidation of plant-emitted BVOC, and this is also in line with literature reports that have estimated the contribution of sulphuric acid to particle growth to be an order of magnitude lower than the contribution of organics in boreal forest conditions (Boy et al., 2005; Iida et al., 2008; Paasonen 10
et al., 2010). The same conclusion was reached in Liao et al. (2014), where the gas phase was modelled near-explicitly, and the growth of larger particles was analysed. Such a contribution would be lost in the growth signal of our experiments. It should also be noted that the maximum growth rate that sulphuric acid could theoretically contribute (following e.g. Nieminen et al., 2010) is of the order of 0.1–1 nm h−1 with the observed 15
H2SO4concentrations.
As also found in the detailed modelling study by Liao et al. (2014) (companion paper submitted to ACPD), particle growth occurs via condensation of low-volatility vapours to the surface of existing nanoparticles. These low-volatile vapours are considered to be the result of oxidation of BVOCs, and therefore, their concentration should be propor-20
tional to the product of the BVOC concentration and the concentration of the oxidant. As the growth rate is theoretically proportional to the condensing vapour concentration, we compared the observed growth rates to the product of BVOC (we chose monoter-pene as the dominant BVOC) and the measured ozone and the observed OH concen-trations (Fig. 6c and d, respectively). We observed that the growth rate correlated very 25
ACPD
14, 31319–31360, 2014BVOC and H2SO4
influcence on particle formation
M. Dal Maso et al.
Title Page
Abstract Introduction
Conclusions References
Tables Figures
◭ ◮
◭ ◮
Back Close
Full Screen / Esc
Printer-friendly Version
Interactive Discussion
Discussion
P
a
per
|
Discussion
P
a
per
|
Discussion
P
a
per
|
Discussion
P
a
per
approach. We also want to point out that we found clear low outliers in the growth rate data when we performed an experiment where we only usedα-pinene as a BVOC pre-cursor instead of real plant emissions. This suggests that the dominant BVOC acting as a condensing ELVOC precursor is notα-pinene, but some other emitted BVOC.
3.3 Discussion of the nano-CN formation mechanism
5
Recent studies in the particle formation mechanism and the participating species have shown that organic compounds are likely to participate in the nucleation mechanism to-gether with sulphuric acid, and some stabilising bases, such as amines are also consid-ered (see e.g. Almeida et al., 2013; Schobesberger et al., 2013). In this study we did not have the capability to observe the full chemical composition of all possible species; the 10
aim was to perform experiments as close to realistic boreal conditions as possible, and relate our findings to real-world conditions. Therefore, we will explain our findings in the light of observable parameters, and discuss the implications of our results. As shown in Sect. 3.1, the best correlation of the observed particle formation rate was found us-ing the BVOC influx and sulphuric acid concentration as the measurable independent 15
parameters (see Eq. 6). The approach taken in earlier studies, of assuming that the concentration of the organic compound participating in particle formation can be esti-mated from the product of the concentrations of the BVOC precursor and the oxidant, as in Eq. (6) did not show agreement with our data. The reason for this is likely due to the low concentrations used, which led to almost all BVOC precursor being consumed 20
during UV-on periods, and thus the measurement noise makes predictions using Eq. (6) inconclusive. However, as we found that the BVOC influx into the reaction chamber clearly influenced nano-CN formation, and the expression in Eq. (7) resulted in good correlation, we consider it likely that BVOC were involved in the formation pro-cess. To explain the findings, we constructed a conceptual mechanism leading to nano-25
ACPD
14, 31319–31360, 2014BVOC and H2SO4
influcence on particle formation
M. Dal Maso et al.
Title Page
Abstract Introduction
Conclusions References
Tables Figures
◭ ◮
◭ ◮
Back Close
Full Screen / Esc
Printer-friendly Version
Interactive Discussion
Discussion
P
a
per
|
Discussion
P
a
per
|
Discussion
P
a
per
|
Discussion
P
a
per
|
in the field, where the degree of gas phase and particle characterisation may often be lower than in laboratory conditions.
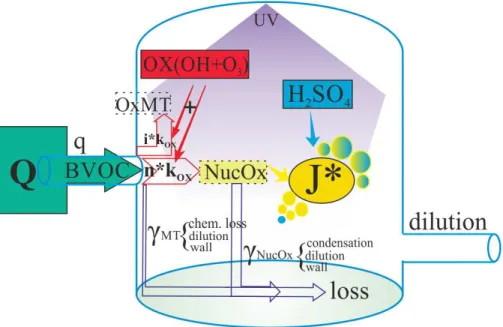
In our system, the source strength of the precursor of BVOC is determined by the concentration of BVOC in the plant chamber and the flow rate between the chambers. The resulting source rate is denoted by q. The total BVOC react with oxidants with 5
a lumped reaction rate constant kox, producing oxidised compounds; a small fraction (denoted byn) of the BVOC is oxidised to produce a product that is able to form clusters with sulphuric acid (NucOx). This compound, in turn, forms nano-CN with sulphuric acid with a reaction ratekJ. In addition, the major fraction (denoted byi =(1−n)) of BVOC
may react to form compounds that do not participate in nano-CN formation (OxVOC, 10
inert in terms of nano-CN formation), as well as be lost to dilution and to the wall. The same applies to the nano-CN-forming compounds: they may react further or be lost to the walls and by dilution. The simplified mechanism is described by the following set of reactions, and a schematic illustration is given in Fig. 7.
Qinflow
q −
→BVOC (R1)
15
·BVOC+OX−k−→ox i·OxVOC+n·NucOX (R2)
BVOC+(X)−γ−−−BVOC→dilution+losses (R3)
NucOX+H2SO4
kJ
−→nanoCN (R4)
NucOx+(X)−γ−−−NucOX→
dilution+losses (R5)
From our measurements, we know that the BVOC is in steady state during the analysis 20
period, and we can assume that NucOx is also in steady state. Now we can solve for the concentrations of BVOC and NucOx using the steady-state approximation, setting the time change of these concentrations to zero. The BVOC concentration now is
[BVOC]= q
n·k
ox[OX]+i·kox[OX]+γBVOC
ACPD
14, 31319–31360, 2014BVOC and H2SO4
influcence on particle formation
M. Dal Maso et al.
Title Page
Abstract Introduction
Conclusions References
Tables Figures
◭ ◮
◭ ◮
Back Close
Full Screen / Esc
Printer-friendly Version
Interactive Discussion
Discussion
P
a
per
|
Discussion
P
a
per
|
Discussion
P
a
per
|
Discussion
P
a
per
and the NucOX concentration is
[NucOX]= n
·k
ox[BVOC][OX]
kJ[H2SO4]+γNucOX
(9)
Solving for the nanoCN formation rate J, which we get from reaction (R4) as J=
kJ[H2SO4][NucOx], we will arrive at
J= q
1+i·kox[OX]+γBVOC
n·kox[OX] 1+
γNucOX kJ[H2SO4]
(10)
5
In our system, the oxidizing reactions are dominating loss reactions for BVOC during UV-on periods (see e.g. Mentel et al., 2009), and thereforei·kox[OX]+γBVOC≈i·kox[OX].
For the nucleation reaction,γNucOxis likely to be significantly greater than the nucleation channel rate (this can be assumed from estimating the amount of molecules that form a new particle) and the second term in the denominator reduces toγNucOx/kJ[H2SO4]. 10
If we now also assume that only a small fraction of BVOC is converted into NucOx (i ≫n, leading to (1+i/n)≈i/n), then the previous equation reduces to
J=qn i
kJ[H2SO4]
γNucOX =
K×q×[H
2SO4] (11)
in which the nucleation rate is expressed as a function of measured quantities, the BVOC source rate q and the measured sulphuric acid concentration, multiplied by 15
a constant that depends on the relative molecular yield of nucleating oxidation prod-ucts, the rate coefficientkJ, and the loss rate of NucOX. The dependence on the
sul-phuric acid causes an implicit dependence on the photochemical oxidation rate; an OH dependence found by Kiendler-Scharr et al. (2009) is thus still observable in our exper-iments. As the isoprene levels were very low in our experiments, the isoprene inhibition 20
effect could not be observed.
ACPD
14, 31319–31360, 2014BVOC and H2SO4
influcence on particle formation
M. Dal Maso et al.
Title Page
Abstract Introduction
Conclusions References
Tables Figures
◭ ◮
◭ ◮
Back Close
Full Screen / Esc
Printer-friendly Version
Interactive Discussion
Discussion
P
a
per
|
Discussion
P
a
per
|
Discussion
P
a
per
|
Discussion
P
a
per
|
of the total oxidised BVOC. In addition, it states that the rate of formation of nano-CN depends on the concentrations of both NucOx and H2SO4, both of which are regulated by their respective sources and losses. For H2SO4, we have experimental knowledge of the concentration, which accounts for its inclusion in the expression for nano-CN formation rate. As NucOx remains experimentally unquantified, its concentration is not 5
included directly, but its contribution can be estimated from the measured source rate. In principle, the steady-state concentration of NucOx could be estimated also from the product of BVOC in the plant chamber and the oxidant concentration, assuming known loss rates. However, as in our experiments almost all of the BVOC is oxidised, and the concentration levels in the reaction chamber are close to the detection limit 10
of our instrumentation, and OH observations are limited in their time resolution. Thus, the relative uncertainty in the respective measurements correlation analysis (Table 2) is unable to discern between different mechanisms. Substituting the source rate and applying the assumptions leading to Eq. (11), we managed to describe the mechanism using observations with lower relative uncertainties, which enables us to state that our 15
observed data forJ indeed shows the correlation that is expected from the postulated reactions. This information was also used to perform detailed modelling of the gas phase chemistry and particle formation and growth in the plant chamber system; this is presented in a companion paper (Liao et al., 2014), which describes in detail the simulations and also focuses on particle growth.
20
The factor n/i =n/(1−n)≈n(for n≪1) conceptually represents the
stoichiomet-ric fractional yield of oxidised BVOC capable of participating in the particle formation process. Based on the recent results by Ehn et al. (2014), it is possible that these com-pounds are similar to the ELVOC identified in their experiment. Ehn and co-authors found a stoichiometric yield of a few percent in their experiment with alpha-pinene; 25
permu-ACPD
14, 31319–31360, 2014BVOC and H2SO4
influcence on particle formation
M. Dal Maso et al.
Title Page
Abstract Introduction
Conclusions References
Tables Figures
◭ ◮
◭ ◮
Back Close
Full Screen / Esc
Printer-friendly Version
Interactive Discussion
Discussion
P
a
per
|
Discussion
P
a
per
|
Discussion
P
a
per
|
Discussion
P
a
per
tation reaction products (PRP) at low-NOxconditions, whereas at high-NOx conditions RO2 reacts predominantly with NO. For our case, this would mean that the ration/i gets smaller, and less NucOX gets produced.
The factor [H2SO4]·k
J/γNucOxdescribes the ratio between the amount of NucOx lost by the nucleation process and the loss by other processes. We can estimate this ratio 5
qualitatively: the maximum value forkJ can be estimated from kinetic gas theory, and is at maximum of the order of 10−10cm3s−1. Thus the numerator is necessarily less than 10−3s−1in our experiments. Comparing this to the condensation sink, which was of the order of 5×10⁻³s−1, and the wall losses for NucOx of the order of 10−2s−1(assuming
similar wall losses as in Ehn et al., 2014), we can see that the nucleation process 10
itself has little influence on the concentration of NucOx. In our experiments, it is likely that the wall losses dominated the loss of NucOx, leading to a minor influence of the condensation sink on the formation rate; however, in field conditions it is likely that the condensation sink dominates andJ is partly regulated by CS. This has been shown for several field studies previously (e.g. Dal Maso et al., 2007). In their study, Metzger 15
et al. (2010) estimated the concentration of NucOx from the particle growth rate; based on their approach, the yield of NucOx was 0.025 % of the VOC concentration. In their study, the growth rate was used also for the determination of the formation rate of nano-CN, which in our study was not required. Therefore, we present an independent confirmation of the results of Metzger et al. using different methodology.
20
As shown in studies by Mentel et al. (2009, 2013) and Kiendler-Scharr et al. (2009), the mixture of BVOC has a profound effect on the particle formation, with pure alpha-pinene producing markedly less aerosol than real plant BVOC mixtures. This is con-firmed by our experiments. For similar total BVOC source rate, pure alpha-pinene pro-duced ca. one order of magnitude lower particle formation rates at equivalent H2SO4 25
concentrations. We interpret this as a sign that the yield of NucOx from alpha-pinene is much lower than for real plant emissions.
ACPD
14, 31319–31360, 2014BVOC and H2SO4
influcence on particle formation
M. Dal Maso et al.
Title Page
Abstract Introduction
Conclusions References
Tables Figures
◭ ◮
◭ ◮
Back Close
Full Screen / Esc
Printer-friendly Version
Interactive Discussion
Discussion
P
a
per
|
Discussion
P
a
per
|
Discussion
P
a
per
|
Discussion
P
a
per
|
also support a hypothesis in which no oxidation of the BVOC is needed, with nano-CN formation occurring directly by the interaction of a compound emitted by plants in proportion of their total BVOC emission. As sulphuric acid formation in our study was coupled with photochemical oxidation, the testing of this hypothesis remains to be performed in future studies. Our results for the growth rates of particles show that 5
in contrast to particle formation, sulphuric acid played little role in nano-CN growth to larger sizes. However, the concentration of monoterpene (or BVOC in general, as total BVOC and monoterpene were strongly correlated) correlated very well with the growth rate of small particles, the only exception being pure alpha-pinene. Correlations corre-sponding to growth occurring by OH-induced oxidation reaction products could not be 10
observed in our experiments, while the correlations with estimations of BVOC ozonol-ysis products were found. As the growth rates of particles were obtained at the very start of particle formation when concentrations both in the gas and particle phase were in strong transition, we cannot reliably estimate the concentrations and yields of the condensing vapors. To do this, detailed modelling of the gas and particle dynamics is 15
required; this work has been performed in the MALTE modelling study of Liao et al. (submitted to ACPD). While the correlations are not conclusive evidence of the ozonol-ysis products governing nanoparticle growth, the data seems to suggest that this is likely, at least for boreal forests.
3.3.1 Relevance to atmospheric particle formation
20
The key aim of our study was to quantify the effect of boreal BVOC on the par-ticle formation rates at realistic concentration levels. Because the emission was de-coupled from the photochemistry and aerosol formation in our experiments, we now can determine whether the BVOC source is comparable to ambient condi-tions. We compared the rates with which the BVOC were introduced to the reaction 25
chamber to ambient rates reported in literature. In boreal forests, average monoter-pene emission rates to the atmosphere vary between 20 and 100 ng s−1
m−2
ex-ACPD
14, 31319–31360, 2014BVOC and H2SO4
influcence on particle formation
M. Dal Maso et al.
Title Page
Abstract Introduction
Conclusions References
Tables Figures
◭ ◮
◭ ◮
Back Close
Full Screen / Esc
Printer-friendly Version
Interactive Discussion
Discussion
P
a
per
|
Discussion
P
a
per
|
Discussion
P
a
per
|
Discussion
P
a
per
periment, the ambient emission rate needs to be compared to the rate at which BVOC were introduced to the reaction chamber, i.e. the source rate q in our sim-plified reaction system (Reaction R2). We measured the source rate into the re-action chamber by measuring the concentration in the plant chamber outlet. Tak-ing dilution into account, a measurement of a 1 ppb concentration at the outlet of 5
the plant chamber corresponds to a BVOC source rate of 1.35×10¹³molecules s−1
into the 1.45 m3 chamber, corresponding to 2.08 ng s−1m−3 (assuming monoterpene,
M=136 g mol−1=2.26×10⁻²²g molecule−1). Thus, the source rate in our chamber
can be estimated as 1.5–8 ng s−1 m−3
. To compare this to ambient conditions, we need to estimate the “reaction volume” in the atmosphere. Spanke et al. (2001) observed 10
that the area of the strongest chemical degradation of monoterpenes in the boreal for-est occurs near the top of the forfor-est canopy. We can therefore assume that the reaction volume extends some tens of meters above the forest. Also, as discussed before, we assume that the oxidation of emitted BVOC occurs quickly after it is exposed to an oxidising atmosphere. Thus we can estimate the “reaction volume” to be a layer of 15
roughly 10–50 m thickness, centered at the the VOC-emitting vegetation, giving a max-imum source rate into the ambient reaction volume of 20–100 ng s−1m−2 divided by 10–50 m, resulting in 0.04–10 ng s−1
m−3
, which is directly comparable to our chamber. To convert our relation of the particle formation rate and BVOC source rate to units used for boreal forest emissions, we apply the formulation
20
J=qn i
kJ[H2SO4]
γNucOX
=KE×E
h×[H2SO4] (12)
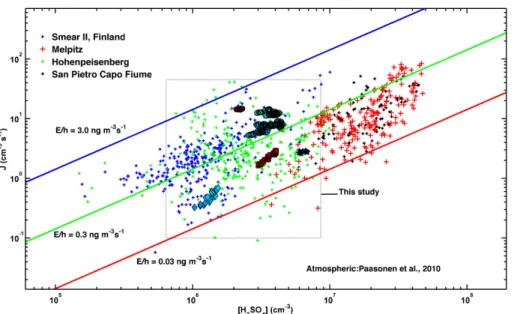
Here,Eis the ambient emission rate of BVOC in ng m−2of forest area,his the particle formation layer height (=the “reaction volume”) in meters, and KE is the fit parameter,
which for our experiments wasKE =4.5×10 −6
m3ng−1. Thus for an emission rate of 50 ng s−1m−2mixed into a layer of thickness 50 m and at a sulphuric acid concentration 25
of 1.0×106cm−3, we would get J=10 cm−3s−1 (see Fig. 8). Because the chemical
ACPD
14, 31319–31360, 2014BVOC and H2SO4
influcence on particle formation
M. Dal Maso et al.
Title Page
Abstract Introduction
Conclusions References
Tables Figures
◭ ◮
◭ ◮
Back Close
Full Screen / Esc
Printer-friendly Version
Interactive Discussion
Discussion
P
a
per
|
Discussion
P
a
per
|
Discussion
P
a
per
|
Discussion
P
a
per
|
formulations involving yields, reaction rates, and sink strengths of unknown chemical compounds that are essentially fitting parameters. Assuming that atmospheric particle formation occurs similarly to the process in our chamber, i.e. the BVOC oxidation and subsequent nano-CN formation occurs quickly after emission if sufficient sulphuric acid is present, then our formulation can be directly applied to atmospheric conditions. 5
One caveat remains: as stated in the discussion of Eq. (11), K (and therefore also
KE) is actually a parameter including the fractional yield n/i of NucOx, the “activation parameter”kJ, and the loss rate of NucOx. In our chamber the loss rate was influenced
(and probably dominated) by the wall loss rate, which does not apply for ambient con-ditions, where the condensation sink will be the dominant sink. Therefore, for atmo-10
spheric application, theKE should be scaled by the condensation sink. It should also
be noted that our parameterisation is only valid for unstressed boreal vegetation; other types of vegetation, or stress conditions, leading to different emission profiles (e.g. Mentel et al., 2013) will produce NucOx with a different fractional yieldn, and thusKE
will change for such emissions; this is exemplified by ourα-pinene experiment, which 15
produced almost an order of magnitude lower particle formation rates than the boreal plant mixture for similar BVOC and H2SO4 levels. Such stress conditions could occur e.g. during early spring recovery of the forest, which has been show to produce more nucleation mode particles (Dal Maso et al., 2009). In addition, our experiments were performed under fairly constant and high OH production; it is likely that variable OH will 20
have an influence on then/i ratio, and therefore the simplified form in Eq. (11) is not applicable, and one should apply the full form given in Eq. (10).
4 Conclusions
We performed controlled nano-CN formation experiments in the Jülich Plant-Atmosphere Chamber setup using boreal forest BVOC emitters and simultaneously 25
ACPD
14, 31319–31360, 2014BVOC and H2SO4
influcence on particle formation
M. Dal Maso et al.
Title Page
Abstract Introduction
Conclusions References
Tables Figures
◭ ◮
◭ ◮
Back Close
Full Screen / Esc
Printer-friendly Version
Interactive Discussion
Discussion
P
a
per
|
Discussion
P
a
per
|
Discussion
P
a
per
|
Discussion
P
a
per
H2SO4 concentration without need for the determination of the particle growth rate, which has been reported to cause the largest uncertainties in the nano-CN formation rate determination. To our knowledge, this is the first time that nanoCN, H2SO4, and realistic levels and mixtures of BVOC have been observed in controlled laboratory con-ditions.
5
In agreement with many other studies, (Kulmala et al., 2013; Almeida et al., 2013; Schobesberger et al., 2013; Wildt et al., 2014), we found conclusive evidence that re-alistic boreal forest BVOC directly influence nanoparticle formation rates at levels that are similar to atmospheric levels, while sulphuric acid is also required for the process. We found no correlation for the formation rate with steady-state observations of BVOC 10
concentrations in the reaction volume; however, we found high correlation when using BVOC source rate as the independent variable. We found that such a correlation is con-sistent with a gas-phase mechanism in which BVOC is quickly oxidised to form a com-pound that is able to stabilise H2SO4, but also rapidly condenses on existing particulate matter and available wall surfaces. Possible candidates for such compounds are the 15
recently observed ELVOC (Ehn et al., 2014), which are formed at least by ozonolysis. Our observations are not conclusive in determining the oxidation pathway for the for-mation of the nucleating compounds. We could parameterise the forfor-mation rate in our chamber as a function of the BVOC source rate and the sulphuric acid concentration, yieldingJ=1.1×10⁻¹²cm3×Q
BVOC×[H2SO4], withQgiven in units of molecules cm
−3
20
per second, and [H2SO4] in molecules cm
−3
. To translate this for application with at-mospheric observations, we obtainedJ=4.5×10⁻⁶m3ng−1×EBVOCh−1×[H2SO4], in
whichEBVOC is the emission rate of BVOC per unit area of boreal forest, andhis the height of the layer in which particle formation occurs. The prefactor forJ is expected to be dependent on the BVOC mixture, in line with observations of e.g. Mentel et al. 25
ACPD
14, 31319–31360, 2014BVOC and H2SO4
influcence on particle formation
M. Dal Maso et al.
Title Page
Abstract Introduction
Conclusions References
Tables Figures
◭ ◮
◭ ◮
Back Close
Full Screen / Esc
Printer-friendly Version
Interactive Discussion
Discussion
P
a
per
|
Discussion
P
a
per
|
Discussion
P
a
per
|
Discussion
P
a
per
|
After formation of the initial nuclei, oxidised plant emissions are responsible for the main part of the aerosol growth to larger sizes. Thus, plant derived organic compounds enhance aerosol formation in both the formation and the growth phase. In the atmo-sphere, with enough oxidants present, the strength of the nucleation source is deter-mined by the availability of precursor BVOC, and by sulphuric acid concentrations. For 5
growth, a larger fraction of the BVOC oxidation products are condensing and the slower oxidation by ozonolysis steers the pace of the growth.
Our findings are a step towards more exact predictions of the response of atmo-spheric aerosol formation to future changes in trace gas emissions and land use changes. The nucleation process presents an upper limit for the cloud condensation 10
nuclei (CCN) production; loss processes such as deposition and coagulation result in only a fraction of formed particles reaching CCN size. The faster the nanoparticles grow, the higher this fraction is. As plant-emitted organics enhance both the maximum number and the survival probability of potential CCN, biogenic activity and stress im-pacts on plants may play a significant role in negative climatic feedbacks via aerosol 15
effects (Kulmala et al., 2004, 2014). Also, the impact of organic emissions on particle concentrations is enhanced compared to a situation where only sulphuric acid deter-mines the initial nuclei formation rate.
More generally, the magnitude of the BVOC effect depends on the SO2 concentra-tion. In SO2-polluted environments, the effect of variation in BVOC will diminish and 20
particle formation is mainly determined by the H2SO4concentration. At low SO2 con-centrations, the BVOC effect becomes more dominant. Therefore, the effect of BVOC cannot be ignored when modelling tropospheric aerosol formation in clean conditions, such as the pre-industrial period (Merikanto et al., 2010) or rural areas, or when making projections for future aerosol loadings (e.g. Arneth et al., 2010). In these cases SO2 25
levels are likely to be low, and the BVOC effect on nucleation has potentially a major impact on particle and CCN formation.
ACPD
14, 31319–31360, 2014BVOC and H2SO4
influcence on particle formation
M. Dal Maso et al.
Title Page
Abstract Introduction
Conclusions References
Tables Figures
◭ ◮
◭ ◮
Back Close
Full Screen / Esc
Printer-friendly Version
Interactive Discussion
Discussion
P
a
per
|
Discussion
P
a
per
|
Discussion
P
a
per
|
Discussion
P
a
per
Atmospheric Science – From Molecular and Biological processes to the Global Climate (ATM)), and the PEGASOS (Pan-European Gas-Aerosols-climate interaction Study, project No FP7-ENV-2010-265148).
References
Almeida, J., Schobesberger, S., Kurten, A., Ortega, I. K., Kupiainen-Maatta, O., Praplan, A. P.,
5
Adamov, A., Amorim, A., Bianchi, F., Breitenlechner, M., David, A., Dommen, J., Don-ahue, N. M., Downard, A., Dunne, E., Duplissy, J., Ehrhart, S., Flagan, R. C., Franchin, A., Guida, R., Hakala, J., Hansel, A., Heinritzi, M., Henschel, H., Jokinen, T., Junninen, H., Kajos, M., Kangasluoma, J., Keskinen, H., Kupc, A., Kurten, T., Kvashin, A. N., Laakso-nen, A., Lehtipalo, K., Leiminger, M., Leppa, J., LoukoLaakso-nen, V., Makhmutov, V., Mathot, S.,
10
McGrath, M. J., Nieminen, T., Olenius, T., Onnela, A., Petaja, T., Riccobono, F., Riip-inen, I., Rissanen, M., Rondo, L., Ruuskanen, T., Santos, F. D., Sarnela, N., Schallhart, S., Schnitzhofer, R., Seinfeld, J. H., Simon, M., Sipila, M., Stozhkov, Y., Stratmann, F., Tome, A., Trostl, J., Tsagkogeorgas, G., Vaattovaara, P., Viisanen, Y., Virtanen, A., Vrtala, A., Wag-ner, P. E., WeingartWag-ner, E., Wex, H., Williamson, C., Wimmer, D., Ye, P., Yli-Juuti, T.,
15
Carslaw, K. S., Kulmala, M., Curtius, J., Baltensperger, U., Worsnop, D. R., Vehkamaki, H., and Kirkby, J.: Molecular understanding of sulphuric acid-amine particle nucleation in the atmosphere, Nature, 502, 359–363, 2013. 31321, 31335, 31343
Arneth, A., Unger, N., Kulmala, M., and Andreae, M.: Clean the Air, Heat the Planet?, Science, 326, 672–673, 2010. 31344
20
Ball, S., Hanson, D., Eisele, F., and McMurry, P.: Laboratory studies of particle nucleation: Initial results for H2SO4, H2O, and NH3 vapors., J. Geophys. Res.-Atmos., 104, 23709–23718, 1999. 31320
Berndt, T., Stratmann, F., Sipilä, M., Vanhanen, J., Petäjä, T., Mikkilä, J., Grüner, A., Spindler, G., Lee Mauldin III, R., Curtius, J., Kulmala, M., and Heintzenberg, J.: Laboratory study on new
25
particle formation from the reaction OH+SO2: influence of experimental conditions, H2O vapour, NH3and the amine tert-butylamine on the overall process, Atmos. Chem. Phys., 10, 7101–7116, doi:10.5194/acp-10-7101-2010, 2010. 31321
Boy, M., Kulmala, M., Ruuskanen, T. M., Pihlatie, M., Reissell, A., Aalto, P. P., Keronen, P., Dal Maso, M., Hellen, H., Hakola, H., Jansson, R., Hanke, M., and Arnold, F.: Sulphuric acid