ABSTRACT:Objective: To estimate the trends of self-rated health in relation to overweight in the adult population of the capitals of the Brazilian Midwest region and the Federal District. Methods: Cross-sectional study with a population aged 20 to 59 years, using data from the Telephone-based Surveillance of Risk and Protective Factors for Chronic Diseases (VIGITEL), performed between 2008 and 2014. The estimates using the complex sampling design were made using simple linear regression, trend graphs and Boxplot.
Results: The categories “poor” and “very poor” didn’t increase in the analyzed period. There was an average increase of 0.5 percentage point per year in the categories “fair” and “good” and an average decrease of 1.0 percentage point in the category “very good”. The trend analysis of mean body mass index found there was a progressive growth in all cities. The worst health perceptions showed higher values of body mass index in both sexes. We observed the existence of obese people assessing their health positively. Conclusion: Self-rated health remained relatively constant whereas the body mass index continued to grow between 2008 and 2014. The self-rated health of individuals with high body mass index (>30 kg/m2) does not seem to be
directly related to their weight. Therefore, it is important to analyze the association of these two variables controlling for morbidity, health behaviors (smoking and alcohol consumption, physical activity and diet), and sociodemographic factors.
Keywords: Overweight. Obesity. Self-assessment. Health Status Indicators. Interview.
Trends of self-rated health in relation
to overweight in the adult population
in Brazilian Midwest capitals
Tendências da autoavaliação de saúde em relação ao excesso de peso na
população adulta residente nas capitais do Centro-Oeste do Brasil
Lúcia Stela Pessanha Lopes de SouzaI, Gisela Soares BrunkenI,
Neuber José SegriI, Deborah Carvalho MaltaII
IPostgradute Program in Collective Health, Universidade Federal de Mato Grosso – Cuiabá (MT), Brazil. IIHealth Surveillance Secretariat from the Ministry of Health – Brasília (DF), Brazil.
Corresponding author: Lúcia Stela Pessanha Lopes de Souza. Rua Buenos Aires, 39, apto. 803, Jardim das Américas, CEP: 78060-634, Cuiabá, MT, Brasil. E-mail: [email protected]
Conlict of interests: nothing to declare – Financial support: none.
INTRODUCTION
Self-rated health (SRH) is an important health indicator analyzed in population sur-veys. The theme started to be studied in the 1970s, as a demand from the Sociology ield, in order to assess its association with mortality1,2. Epidemiological and qualitative studies
brought consistent results that pointed to SRH as a useful indicator to diagnose the health status of the populations3,4.
As a global health indicator, obtained from the perception of individuals coming from signs and meanings, based on the multidimensional aspects of human life5, it is important
to consider its relationship with factors that can establish the level of health status. The lit-erature has studies about the relationship between SRH and morbimortality, as well as its
association with socioeconomic, demographic, behavioral, among other factors1-10.
Self-rated health is related to the social world and to psychological experiences, on the one hand, and to the biological world, on the other, showing the inluence of the cognitive low in the responses to the only question composing this indicator, usually asked as followed: “How is your health in general: excellent, very good, good, fair, or poor?”. The individual irst assesses what health is and which are its most relevant components; then, he or she considers some aspects, such as age, the situation of known people, health history and the expected development of health; and, inally, he or she decides which the best option is to describe the situation11.
This study aimed at estimating the tendencies of SRH and body mass index (BMI), as well as the relationship between both from 2008 to 2014, in the Midwest region of Brazil.
RESUMO:Objetivo: Estimar as tendências da autoavaliação de saúde em relação ao excesso de peso na população adulta residente nas capitais da região Centro-Oeste e no Distrito Federal. Método: Estudo transversal com população entre 20 e 59 anos, utilizando dados de inquéritos telefônicos de base populacional do Sistema de Vigilância de Fatores de Risco e Proteção para Doenças Crônicas (VIGITEL), realizados entre os anos de 2008 e 2014. As estimativas foram feitas considerando o planejamento amostral complexo, utilizando-se regressão linear simples, gráicos de tendência e Boxplot. Resultados: As categorias “ruim” e “muito ruim” não tiveram alteração no período analisado. Observou-se aumento médio de 0,5 ponto percentual para as categorias “regular” e “bom”, e diminuição média de 1,0 ponto percentual na categoria “muito bom”. Na análise de tendência das médias do índice de massa corporal, veriicou-se aumento progressivo em todas as cidades. Nas piores percepções de saúde, constatou-se valores mais elevados do índice de massa corporal em ambos os sexos. Observou-se a existência de pessoas obesas autoavaliando sua saúde de maneira positiva. Conclusão: A autoavaliação de saúde se manteve relativamente constante enquanto o índice de massa corporal seguiu tendência crescente entre 2008 e 2014 nas capitais do Centro-Oeste e no Distrito Federal. A autoavaliação de saúde dos indivíduos com índice de massa corporal elevado (> 30 kg/m2) parece não ter relação direta com seu peso. É importante analisar a associação
dessas duas variáveis, controlando-as por morbidades, comportamentos de saúde (etilismo e tabagismo, atividade física e alimentação) e fatores sociodemográicos.
Of the risk factors for noncommunicable chronic diseases (NCCD), the excess weight prob-lem stands out, considered as a global epidemic12.
The Midwest region was chosen considering some special characteristics related with the factors associated with SRH found in the literature, when compared to other Brazilian regions:
1. From 2000 to 2010, it was the region with the second highest population growth rate;
2. It presented the second highest gross domestic product (GDP) per capita;
3. It was the second largest region in average household income per capita; 4. It is the second largest region in terms of schooling;
5. Until 2006, it held the third position in the ranking of mortality rates due to the main causes associated with NCCD, in progressive growth; even if, in the aforementioned year, it has been surpassed by the Northeast.
Therefore, it is observed that the Midwest region is in an intermediate position in relation to the others in the mentioned aspects13. It is emphasized that Cuiabá was leader in the
rank-ing of the prevalence of obesity in 2010 (18.7%) and 2013 (22.4%). Another aspect to men-tion regarding the region studied is the fact that is includes the Federal District, which is the capital of the country and has some particular features in relation to other federation units.
METHODS
This is a cross-sectional, population study including all three capitals of the Midwest region and the Federal District. It uses data about the adult population aged between 20 and 59 years old (n = 38,151), in the Telephone-based Surveillance of Risk and Protective Factors for Chronic Diseases (VIGITEL), from the Ministry of Health in Brazil referring to the period of 2008 to 2014.
VIGITEL has collected the self-rated health status of individuals composing the samples representing the population in the Brazilian capitals and in the Federal District since 2006, together with information about health behaviors, socioeconomic status, reported morbid-ities and information about weight and height to obtain BMI14.
The samples were composed to reach at least 2,000 people, aged more than 18 years, liv-ing in the city, and households with at least one landline. The samplliv-ing process is conducted in two steps. In the irst one 5 thousand landlines are selected per city, using the records of telephone operators. The selected sample is divided in replicas similar to 200 landlines that reproduce the same proportion of landlines per region of telephone preix14. The second
stage is conducted at the interview, to identify the active landlines, therefore eligible for the System. For each eligible landline there is a consultation about the acquiescence of users to participate in the study. If positive, one person is selected amongst the ones who are older than 18 years of age in the household, and that person will be interviewed. 14.
person was the product of the inverse of the number of landlines by the number of adults in the household of the interviewee. Afterwards, post-stratiication weight was attributed, considering the sociodemographic variables sex, age group and schooling level using the “rake” technique, interactive process that generates weights in order to even the sociode-mographic composition of the sample to that of the city’s population14.
The variable SRH was obtained with the following question: “Would you classify your health status as very good, good, fair, poor, really poor, do not know or did not want to inform”. The categories “do not know” and “did not want to inform” were excluded from the analyses. The BMI variable was built based on data about reported weight and height, using the following formula: weight (kg)/height (m)². The cutof points to classify the individuals in the samples were: low weight (BMI < 18.5 kg/m2); eutrophic (BMI between 18.5 and 24.9
kg/m2); overweight (BMI between 25.0 and 29.9 kg/m2) and obesity (BMI ≥ 30 kg/m2)15.
The records corresponding to individuals aged less than 20 years old and older than 60 years old, as well as pregnant women, were excluded. At irst, a single database was organized based on the sum of VIGITEL databases referring to the years 2008 to 2014. For that, all variables used were categorized and named the same in the seven databases. Records corresponding to ages lower than 20 and higher than or equal to 60 years, in this case, were also excluded.
The percentages of categories of SRH and BMI means were calculated for each year, according to sex and capitals in the Midwest region, with their respective 95% conidence intervals (95%CI). To calculate BMI means, initially the records of BMI > 50 (n = 58) were excluded in order to verify its impact on the mean, which did not happen; therefore, these discrepant values were maintained in the inal calculation.
The behavior of the tendencies of BMI means and the SRH categories in the studied period was analyzed with trend line graphs. The vertical axis in the logarithmic scale was used for SRH, in order to prevent distortions and make relative comparisons between the several categories of this variable. For BMI, a graph using the 95%CI was used to show the temporal trend, as well as to allow comparisons between the means in the period.
Aiming at estimating the variation of SRH in the period between 2008 and 2014, this variable was grouped in two categories: “poor/very poor” and “very good/good/ fair”. Afterwards, a simple linear regression model was applied, and the outcome – dependent variable – was the percentage of adults who declared their health status to be “poor/very poor”. The explanatory variable was the year of study, expressed as a quantitative variable.
Boxplot graphs were elaborated with the distribution of BMI, according to the cat-egories of SRH for men and women in each year considered. The veriication of possi-ble diferences between the categories was analyzed using the Kruskal-Wallis nonpara-metric test.
The software Stata, version 11, was used for data analysis, considering the design vari-ables of the complex sample plan and the 0.05 signiicance level.
lo
g
%
100.00
2008 2009 2010 2011 2012 2013 2014
10.00
1.00
0.10
2008 2009 2010 2011 2012 2013 2014 Very good 21.51 23.65 25.54 22.07 23.34 17.27 17.07 Good 49.27 47.41 49.27 48.49 48.30 52.30 50.55 Fair 25.19 24.83 22.35 24.86 24.33 26.03 27.96
Poor 3.17 3.53 2.23 3.48 2.98 3.52 3.40
Very poor 0.86 0.58 0.61 1.10 1.05 0.87 1.04
Figure 1. Trend lines in the categories of self-rated health from 2008 to 2014 in the capitals of the Midwest and the Federal District, according to data from the Telephone Disease Surveillance System.
in the National Human Research Ethics Commission from the Ministry of Health (CONEP – Report n. 355,590, from June 26, 2013, CAAE: 16202813.2.0000.008)14. This study was approved
by the Ethics Committee of Hospital Júlio Muller in Cuiabá, Mato Grosso, report n. 568.889, from March, 26, 2014.
RESULTS
In the trend analysis of the BMI means, some diferences were detected in the period of 2008 to 2014 (p < 0.001). In 2008, the mean BMI in the four capitals of the study was 24.99 kg/m2, reaching 25.93 kg/m2 seven years later (p < 0.001). By observing Figure 2, it
is possible to see a signiicant increase (p < 0.001) between 2010 and 2011. After this year (2011), the Midwest region reached the overweight range, once the inferior 95%CI limit was higher than 25 kg/m2.
In the stratiication per city, the BMI diferences in the period remained signiicant in the four capitals (p < 0.001), and there were similarities in the mean BMI growth for all of them; however, in diferent levels. The means of the pair formed by Cuiabá/Campo Grande were very similar in 2008, 2010, 2011 and 2012. Also, Goiânia/Brasília present similar means in practically all years (Figure 3).
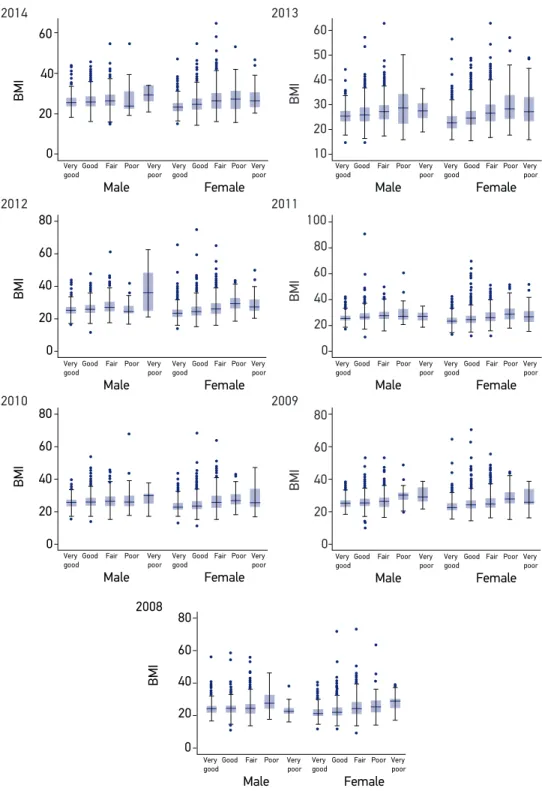
In the analysis of the relationship between the BMI averages, according to SRH cat-egories (Figure 4), the Boxplot graphs presented unusual values (outliers) in relation to almost all categories in the seven years analyzed and in both genders, especially above the upper axis. The interquartile range of BMI values for the total number of capitals was higher in the worse health perceptions, indicating an increasing variability of data
BMI
26.50
2008 2009 2010 2011 2012 2013 2014
25.50 26.00
25.00
24.50
24.00
2008 2009 2010 2011 2012 2013 2014 Mean 24.99 25.08 25.15 25.62 25.69 25.75 25.93 LL 24.83 24.88 24.92 25.46 25.50 25.57 25.70 UL 25.14 25.29 25.37 25.79 25.88 25.94 26.17
Figure 2. Trend of the mean body mass index (with 95%CI in the points) from 2008 to 2014 in the capitals of the Midwest and the Federal District according to data from the Telephone Disease Surveillance System.
in this central range of values, in the worst SRH categories. Besides, the Kruskal-Wallis test showed that the distribution of BMI values, generally, was diferent between the SRH categories in all years. The worst health perceptions found higher BMI values in both genders in the periods analyzed (p < 0.05). In the analyzed period, the year 2012 stands out, when the biggest diference between BMI means for people with very good
(24.50 kg/m2 – 95%CI 24.19 – 24.81) and very poor SRH (33.13 kg/m2 – 95%CI 27.45 –
38.82) was found.
DISCUSSION
SRH remained relatively constant, whereas BMI had an increasing trend between 2008 and 2014, in the capitals of the Midwest and the Federal District.
There was an increasing trend in BMI means in the three capitals analyzed and in the Federal District. This increase is in accordance with the alert from the World Health Organization (WHO)15 referring to the growing prevalence rates of obesity all over the world, both in
developed and in developing countries, increasing the risks of NCCD. The four cities of the
BMI
26.00 26.50 27.00
2008 2009 2010 2011 2012 2013 2014
25.00 25.50
24.50
24.00
23.50
2008 2009 2010 2011 2012 2013 2014
Campo Grande 25.56 25.69 25.97 25.97 26.43 26.08 26.40
Cuiabá 25.53 25.42 25.89 25.94 26.26 26.57 26.68 Goiânia 24.77 24.98 24.96 25.37 25.60 25.59 25.60 Brasília 24.82 24.89 24.84 25.58 25.40 25.57 25.81
Figure 3. Trend of the mean body mass index from 2008 to 2014 according to capitals of the Midwest and the Federal District according to data from the Telephone Disease Surveillance System.
Figure 4. Boxplot of the body mass index regarding the categories of self-rated health for both genders, referring to the period of 2008 to 2014, based on the data from the Telephone Disease Surveillance System.
BMI: body mass index.
2014 2013 2012 2010 2011 2009 2008 BMI BMI BMI BMI BMI BMI 60 60 40 40 50 20 20 30 10 60 60 80 80 100 40 40 20 20 0 0 0 60 80 40 20 0 BMI 60 80 40 20 0 60 80 40 20 0 Male Female Very good
Good Fair Poor Very
poor Very good
Good Fair Poor Very poor
Male Female
Very good
Good Fair Poor Very
poor Very good
Good Fair Poor Very poor
Male Female
Very good
Good Fair Poor Very
poor Very good
Good Fair Poor Very poor
Male Female
Very good
Good Fair Poor Very
poor Very good
Good Fair Poor Very poor
Male Female
Very good
Good Fair Poor Very
poor Very good
Good Fair Poor Very poor
Male Female
Very good
Good Fair Poor Very
poor Very good
Good Fair Poor Very poor
Male Female
Very good
Good Fair Poor Very
poor Very good
Midwest region presented similar growth in BMI means, pointing to a signiicant increase from 2010 to 2011, reaching the overweight category. It is important to mention that BMI can be considered to provide the measurement of obesity in a population level, even if indi-rectly, since it does not measure the body fat level, which efectively deines excess weight and obesity12.
Both in developing and developed countries, the increasing overweight and obe-sity trends have been attributed to the so-called “obesogenic” environment, which essentially facilitates the intake of energy-dense foods, while restricting and inhibit-ing activities that require high energy waste. In Brazil, the higher increase of adult obesity was observed in families with lower income, showing the replacement of low
nutrition with nutritional16. Urban diets are usually characterized by the intake of
polished grains and by the intake of higher levels of fat and animal products, refined sugar, processed foods and foods consumed outside the household, especially in devel-oping countries17.
Regarding SRH, it was observed that the percentages in the categories “poor” and “very poor” remained without significant changes in the analyzed period. However, the percentages in the categories “good” and “fair” increased, whereas those in the category “very good” reduced throughout the years. Supposedly, part of the popula-tion that judged their health as “very good” began to consider it as “good” or “fair”, possibly because of the high prevalence of noncommunicable diseases, which are also
a result of the increasing BMI12. The research shows that the category “good” is
prev-alent over the others, probably because the answer “good” does not require such rig-orous knowledge, besides being less compromising in comparison to another health assessment parameter. The two categories with worst evaluation – “poor” and “very poor” – had the lowest response percentages, which is not surprising, since this is an adult population including young adults at productive age, and in a sample
represent-ing the urban population. Pavão et al.5 indicate that better socioeconomic conditions,
health behaviors and lack of morbidities contribute to improve the health perception of the individuals.
Based on the results of the relationship of SRH and BMI, the existence of obese peo-ple with positive self-rated health is demonstrated. Among the 58 peopeo-ple identiied with BMI > 50 kg/m2, only 10 reported their health as “poor” or “very poor”. Probably, the
self-rated health of individuals with high BMI (> 30 kg/m2) is not related to their weight,
but with other morbidities, especially those resulting from the excess weight, such as dia-betes and hypertension. Studies of multiple regression with the analyzed samples can clarify that question.
good performance in Brazilian urban areas18. Even though all information is self-reported,
including weight and height, this is considered as a relevant and eicient tool to monitor excess weight in the population 19.
The advantage of this study is that it studies population-based samples in four Brazilian cities, including the Federal capital. For that, we used a data base from an important survey tool of health surveillance, which basically uses the same questionnaire each year, so it is possible to estimate the trends. Even though seven years is still considered a short period from the statistical and epidemiological point of view, to analyze trends, the series studied allowed the veriication of the evolution of SRH and BMI.
CONCLUSION
SRH remained relatively constant, whereas BMI had an increasing trend between 2008 and 2014 in the capitals of the Midwest and the Federal District.
SRH of individuals with high BMI (> 30 kg/m2) seems to have no direct relation with
their weight. Therefore, it is important to analyze the association of these two variables by controlling them per morbidities, health behaviors (alcoholism and smoking, physical activities and diet) and sociodemographic factors.
ACKNOWLEDGMENTS
We would like to thank the Health Surveillance Secretariat from the Ministry of Health for granting us with the data bases for the study.
1. Idler EL, Benyamini Y. Self-rated health and mortality: a review of twenty-seven community studies. J Health Soc Behav 1997; 38(1):21-37.
2. Mossey JM, Shapiro E. Self-rated health: a predictor of mortality among the elderly. Am J Public Health 1982; 72(8):800-8.
3. Barros MBA, Zanchetta LM, Moura EC, Malta DC. Auto-avaliação de saúde e fatores associados, Brasil, 2006. Rev Saúde Pública 2009; 43(Suppl 2):27-37. 4. Peres MA, Masiero AV, Longo GZ, Rocha GC, Matos
IB, Najnie K, et al. Auto-avaliação de saúde em adultos no sul do Brasil. Rev Saúde Pública 2010; 44(5): 901-11. 5. Pavão MA, Werneck GL, Campos MR. Autoavaliação do estado de saúde e a associação com fatores
sociodemográicos, hábitos de vida e morbidade na população: um inquérito nacional. Cad Saúde Pública 2013; 29(4): 723-34.
6. Barreto SM, Figueiredo RCD. Doença crônica, auto-avaliação de saúde e comportamento de risco: diferença de gênero. Rev Saúde Pública 2009; 43(Suppl 2): 38-47.
7. Guimarães JMN, Chor D, Werneck GL, Carvalho MS, Coeli CM, Lopes CS, et al. Association between self-rated health and mortality: 10 years follow-up to the Pro-saúde cohort study. BMC Public Health 2012. [Internet]. Disponível em: http://www. biomedcentral.com/1471-2458/12/676 (Acessado em: 21 de julho de 2013).
8. Kondo N, Sembajwe G, Kawachi I, Dam RM, Subramanian SV, Yamagata Z. Income inequality, mortality, and self-rated health: meta-analysis of multilevel studies. BMJ 2009; 339: 1-9.
9. Luppa M, Weyerer S, Konig HH, Braher E, Rieder-Heller SG. Health status and risk for depression among the elderly: a meta-analysis of published literature. Age Ageing 2010; 39: 31-8.
10. Szwarcwald CL, Souza-Júnior PRB, Esteves MAP, Damacena GN, Viacava F. Sócio-demographic determinants of self-rated health in Brazil. Cad Saúde Pública 2005; 21(Suppl): 554-64.
11. Jylhä M. What is self-rated health and why does it predict mortality? Towards a uniied conceptual model. Soc Sci Med 2009; 69: 307-16.
12. World Health Organization. Obesity: preventing and managing the global epidemic. Geneva: World Health Organization; 2000 (Technical Report Series, 894).
13. Brasil. DATASUS, Departamento de Informática do SUS. Informações de saúde (TABNET), Inquéritos e pesquisas. [Internet]. Disponível em http://www2.datasus.gov. br/DATASUS/index.php?area=0207 (Acessado em: 1.º de fevereiro de 2014).
14. Brasil. Ministério da Saúde. Vigitel Brasil 2014: Vigilância de fatores de risco e proteção para doenças crônicas por inquérito telefônico. Brasil: Ministério da Saúde; 2015. 15. World Health Organization. Global Status Report
on noncommunicable diseases 2010. Geneva: World Health Organization; 2010.
16. Monteiro CA, Conde WL, Popkin BM. Income-Speciic Trends in Obesity in Brazil: 1975-2003. Am J Public Health 2007; 97(10): 1808-12.
17. Helman CG. Cultura, Saúde e Doença. 5ª ed. Porto Alegre: Artmed; 2009.
18. Monteiro CA, Moura EC, Jaime PA, Lucca A, Florindo AA, Figueiredo ICR et al. Monitoramento de fatores de risco para doenças crônicas por entrevistas telefônicas. Rev Saúde Pública 2005; 39(1): 47-57.
19. Radcliff TA, Bobroff LB, Lutes LD, Durning PE, Daniels MJ, Limacher MC, et al. Comparing costs of telephone versus face-to-face extended care programs for the management of obesity in rural settings. J Acad Nutr Diet 2012; 112(9): 1363-73.
Received on: 11/30/2015