w w w . r b h h . o r g
Revista
Brasileira
de
Hematologia
e
Hemoterapia
Brazilian
Journal
of
Hematology
and
Hemotherapy
Original
article
Pattern
of
hemolysis
parameters
and
association
with
fetal
hemoglobin
in
sickle
cell
anemia
patients
in
steady
state
Juliane
Almeida
Moreira,
Marília
Rocha
Laurentino,
Rosângela
Pinheiro
Gonc¸alves
Machado,
Maritza
Cavalcante
Barbosa,
Ronaldo
Pinheiro
Gonc¸alves,
Amanda
de
Menezes
Mota,
Lilianne
Brito
da
Silva
Rocha,
Alice
Maria
Costa
Martins,
Alcínia
Braga
de
Lima
Arruda,
Iêda
Pereira
de
Souza,
Romélia
Pinheiro
Gonc¸alves
∗UniversidadeFederaldoCeará(UFC),Fortaleza,CE,Brazil
a
r
t
i
c
l
e
i
n
f
o
Articlehistory:
Received8August2014 Accepted14January2015 Availableonline14April2015
Keywords: Anemia Sicklecell Hemolysis Biologicalmarkers Fetalhemoglobin
a
b
s
t
r
a
c
t
Objective:Thisstudyaimedtoevaluatetheinfluenceoffetalhemoglobin(HbF)onhemolysis
biomarkersinsicklecellanemiapatients.
Methods:Fiftyadultsicklecellanemiapatientswereincludedinthestudy.Allpatientswere
takinghydroxyureaforatleastsixmonthsandwerefollowedattheoutpatientclinicof a hospitalinFortaleza,Ceará,Brazil.Thecontrolgroupconsistedof20hemoglobinAA individuals. The reticulocytecountwasperformed byanautomated methodology, lac-tate dehydrogenase anduricacidweremeasuredbyspectrophotometryandarginaseI byenzyme-linkedimmunosorbentassay(ELISA).ThepresenceofHbSwasdetectedby high-performanceliquidchromatography.Thelevelofsignificancewassetforap-value <0.05.
Results:A significantincreasewasobservedinthereticulocytecountandlactate
dehy-drogenase,uricacidandarginaseIlevelsinsicklecellanemiapatientscomparedtothe controlgroup(p-value<0.05).PatientshavingHbFlevelsgreaterthan10%showeda signifi-cantdecreaseinthereticulocytecount,arginaseIandlactatedehydrogenase.Asignificant decreasewasobservedinarginaseIlevelsinpatientstakinghydroxyureaatadosegreater than20mg/kg/day.
Conclusion: Theresultsofthisstudyshowthatsicklecellanemiapatientshaveincreases
inthehemolysisbiomarkers,lactatedehydrogenase,reticulocytecount,arginaseI,uric acidandincreasesinHbFcanreducethereticulocytecountandarginaseIandlactate dehydrogenaselevels.
©2015Associac¸ ˜aoBrasileiradeHematologia,HemoterapiaeTerapiaCelular.Published byElsevierEditoraLtda.Allrightsreserved.
∗ Correspondingauthorat:RuaPereiraValente,640,Aldeota,60160-250Fortaleza,CE,Brazil.
E-mailaddress:[email protected](R.P.Gonc¸alves). http://dx.doi.org/10.1016/j.bjhh.2015.01.008
Introduction
Sicklecellanemia(SCA)isanhemolyticanemiacharacterized bystructuralchangesinthe-globinchain,leadingtothe syn-thesisofanabnormalhemoglobin(Hb)inhomozygous(Hb SS).1
TheprimaryeventliableforanycomplicationsinSCAis thepolymerizationofHb S,whichculminatesinhemolysis andvaso-occlusiveevents.Theseinturntriggerotherevents suchasaninflammatoryprocess,increasedoxidativestress, endothelialdysfunction and decreasedavailability ofnitric oxide(NO).2
Lactatedehydrogenase(LDH)isamarkerofintravascular hemolysisandelevationsinitsplasmaconcentrationare asso-ciatedwiththeclinicalphenotypeofpulmonaryhypertension, priapismandlegulcersinSCA.3Studieshavedemonstrated
thatLDHmay beausefulmarkerofdisease complications relatedtohemolysis.2,4
HyperuricemiaoccursonlyinSCApatientswho develop abnormalrenal tubular function, with decreased uric acid clearancesecondarytodecreasedurateexcretion.5
Arginase is the enzyme that converts L-arginine to ornithine and urea. During the hemolysis process, this enzyme is released from red blood cells, contributing
to the consumption of L-arginine and decreasing NO
concentrations.6,7
There are two distinct isoforms of arginase (I and II), whichareencodedbydifferentgenesanddifferinmolecular andimmunologicalproperties,tissuedistribution,subcellular localizationandregulationofexpression.8 ArginaseIis
pri-marilyexpressedintheliverandredbloodcells,whereasthe expressionofarginaseII(mitochondrialenzyme)isdiffused invarious tissuessuch asthe brain,bone marrow, kidney, small intestineand mammary glands.9 During the process
ofhemolysis,NOreactswithHbtoformmethemoglobinand nitrate.
Arginaseisan enzymeabundantinreticulocyteswhich predominateinpatientswithchronichemolyticanemia, in particularSCAasthereisarapidturnoverofredbloodcells. Patients who have low arginine levels are more likely to developpulmonary hypertension, stroke, priapism and leg ulcers,andconsequentlyincreasedmortality.2,7Studieshave
shown a positive association of arginase I with hemolysis markerssuchastotalbilirubin,indirectbilirubinandaspartate aminotransferase.10,11
Fetalhemoglobin(HbF)isthemostpowerfulmodulator ofthe clinicaland hematologicfeaturesofSCAinfluencing both clinical and laboratory features. The pathophysiol-ogyof this disease is dependent on the polymerization of deoxy-sickle Hb; the Hb F concentration reduces this pro-cess,therebyreducinghemolysisandvaso-occlusiveevents. Theuse of hydroxyurea may contribute toincreased Hb F production, however, not all patients respondwell to this drug.12–15
Thus,the present study aimsto evaluatetheimpact of the Hb F on hemolysis biomarkers in adult patients with SCA.
Methods
Subjectsandsamples
Thiswasacross-sectionalandanalyticalstudyoffiftyadult SCA patients underoutpatient treatmentat the University HospitaloftheUniversidadeFederaldoCeará(UFC) in For-taleza, Ceará, Brazil from March 2012 to March 2013. All patients signed informed consent forms according to the researchprotocol approvedbythe EthicsCommitteeofthe UFC.Eligibilitycriteriaincludedadultpatientswithmolecular diagnosticsofSCAtakinghydroxyureaatadoseofbetween 0.5 and 1.5g/day for at least six months without recent blood transfusions. Transfusions were documented by the absenceofHbAmeasuredbyhigh-performanceliquid chro-matography(HPLC)(UltraResolutionSystem,TrinityBiotech), accordingtothecriteriadescribedbyBallasetal.16Acontrol
groupwascomposedbytwentyblooddonors(HbAA).
Analysisofbiomarkers
Avenousbloodsample(10mL)wascollectedinatube contain-ingtheethylenediaminetetraaceticacid(EDTA)anticoagulant tomanuallyperformareticulocytecountandtomeasurethe percentageofHbFbyHPLCanalysis.Moreovera6-mLvenous bloodsamplewascollectedinatubewithseparatorgelbut withoutanticoagulanttomeasureserumLDH,uricacidand arginaseI.LDHanduricacidweremeasuredbykinetic analy-sisusingtheLabtest®kit.Theserumconcentrationofarginase Iwasdeterminedaccordingtotheenzyme-linked immunosor-bentassay(ELISA)kitforhumanarginaseprotocol(USCNKLife ScienceInc.).Thekitisasandwichenzymeimmunoassayfor
invitroquantitativemeasurementofserumarginaseI.
Statisticalanalysis
Statistical analysis was performed using GraphPad Prism 5.0 (USA). Initially, data normality was analyzed using the Kolmogorov–Smirnov test. The unpaired t-test and Mann–Whitneytestwereusedtocomparetwonumerical vari-ables.Amultiplecomparisonofmeanswasperformedusing theanalysisofvariance(ANOVA)test(Bartlett’stestforequal variances) followed byNewman–Keuls post-test toidentify whichgroupsweredifferent.TheSpearmantestwasusedto correlatethearginaseIwithHbFconcentration,reticulocyte count,LDHanduricacidlevels.Allresultswereexpressedas means±standarderrorofthemean(SEM).Thelevelof signif-icanceforallanalyseswassetforap-value<0.05.
Results
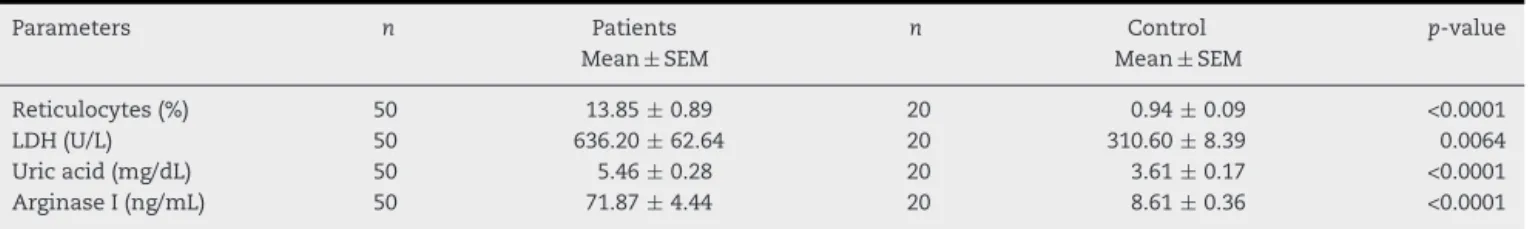
Table1–Demographicandhematologicparametersof
sicklecellanemiapatients(n =50)andcontrolgroup
(n =20).
Patients(n=50) Control(n=20)
Gender(F/M) 28/22 14/6
Age 37.78(20–63) 27.67(20–55)
Hemoglobin(g/dL) 8.596±0.2093 12.34±0.5
Hematocrit(%) 24.93±0.5791 39±0.6
MCV(fL) 98.84±1.515 94.4±1.5
MCH(pg) 34.50±0.6112 33.4±0.8
MCHC(%) 34.41±0.1868 32.5±0.5
Leucocytes(×109/L) 13.7±2.7 6.3±1.6 Platelets(×109/L) 381.8±24.5 390.2±25.7
HbF(%) 12.68±1.162 –
HbS(%) 80.93±1.006 –
MCV: Mean corpuscular volume; MCH: Mean corpuscular hemoglobin;HbF:Fetalhemoglobin;HbS:Sicklehemoglobin. Dataareexpressedinmean±standarderrorofthemean(SEM).
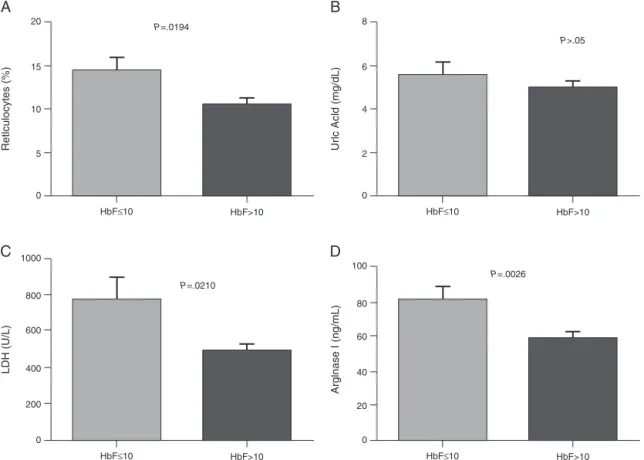
orequalto10%showedasignificantincreaseinthe reticu-locytecount,andarginaseIandLDHlevels(Figure1).There wasnocorrelationbetweentheHbFanduricacid.Patients onlowdosesofhydroxyurea(<20mg/kg/day)hadasignificant increaseinthearginaseIlevels(Figure2).Moreover,therewas nosignificantrelationshipbetweenhydroxyureadosesandHb F,LDH,anduricacidlevelsorthereticulocytecount.
Discussion
SCAischaracterizedbythepresenceofHbSinhomozygous andisassociatedwithaheterogeneousclinicalpresentation, includingseverehemolyticanemia,painfulcrises,and vaso-occlusive events. It is associatedwith high morbidity and mortality,mainlyduetoinfections,andsostudiesthatmight establishprognosticmarkersforthemostsevereclinical man-ifestationsofthediseasearenecessary.17
A significant increase in the reticulocyte count was observedin SCA patients comparedto control individuals. Reticulocytosisisaresponsetothehemolyticprocess. Cortel-lazzi et al.18 demonstrated a significant difference in the
reticulocytecountin adultpatientswith SCAcompared to acontrolgroup(HbAA).Someauthors haveattributedthe increasedreticulocytecount toincreasedexpansion ofthe erythroidlineage.2,19
In the presentstudy there was asignificant increaseof serum LDH in patients withSCA compared to the control group.TheseresultsareinagreementwiththestudyofElias etal.20whofoundasignificantincreaseofLDHcomparedto
acontrolgroupinthesamestudypopulationatsteadystate. Stojanovicetal.21foundanelevationinserumLDHlevelsin
patientswithSCAinbothsteadystateandincrises.Taylor et al.22suggest usingthe determinationofLDHinpatients
withSCAatbaselineasapredictivemarkerofincreasedrisk ofmortalityduetotheinfrequencyofvaso-occlusiveevents. Inaprospectivestudy,NajimandHassan23evaluatedLDHas
amarkerofvaso-occlusioninSCAchildrenandadolescents duringepisodes. LDH isanenzymeassociatedwith hyper-hemolysis; the authors concluded that LDH is an efficient biochemical marker of the severity of pain during vaso-occlusiveepisodes.2,19,22TheSCApatientsinthisstudywith
highHbFconcentrations(>10%)hadlowerLDHlevels,which showstheimportantroleofHbFinthehemolysisprocess.
AsignificantincreaseinuricacidhasbeenreportedinSCA patientscomparedtocontrolgroups.Cerqueiraetal.11showed
a positivecorrelation betweenuricacid and biomarkersof hemolysisbymeasuringindirectandtotalbilirubinlevelsin SCApatients.However,inthepresentstudynorelationship wasobservedbetweenuricacidlevels andotherhemolysis markersorHbFlevels.ThestudyofAl-Naamaetal.24showed
thaturicacidlevelswerehigherinSCApatientsthanina con-trolgroup.Theseauthorsattributedtheelevationofuricacid toincreasedbonemarrowactivityandrenewalofnucleicacids thatcanoccurduringthehemolysisprocess.
Theresultsofthisstudydemonstrateanincreaseinthe arginaseIlevelsinSCApatientscomparedtoacontrolgroup. TheseresultscorroborateastudybyVilas-Boasetal.25who
reportedasignificantdifferenceinserumarginaseinpatients withSCA comparedtocontrolindividuals.Thedataofthe study demonstratethatarginaseIisamarkerofhemolysis which increasesinSCAatsteady stateandcanbeusedin practiceasamodulatorofhemolysis.
NocorrelationwasconfirmedbetweentheHbFleveland the hemolysisparametersstudied,althoughsignificant dif-ferences in the levels of arginaseI, LDH and reticulocytes were observed between patients with low and high Hb F concentrations. ThisHb isthemaininhibitorofHbS poly-merization,contributingtoanimprovementinhemolysisand vaso-occlusiveevents.ByinhibitingthetendencythatHbSis polymerized,HbFpreventsthecelldamagecausedthereby reducingclinicalcomplicationsinSCApatients.12
Table2–Comparativeanalysisofthehemolysisparametersinsicklecellanemiapatients(n =50)andthecontrolgroup
(n =20).
Parameters n Patients
Mean±SEM
n Control
Mean±SEM
p-value
Reticulocytes(%) 50 13.85±0.89 20 0.94±0.09 <0.0001
LDH(U/L) 50 636.20±62.64 20 310.60±8.39 0.0064
Uricacid(mg/dL) 50 5.46±0.28 20 3.61±0.17 <0.0001
ArginaseI(ng/mL) 50 71.87±4.44 20 8.61±0.36 <0.0001
LDH:Lactatedehydrogenase.
20
A
15
10
5
P=.0194
Retlculocytes (%)
0
HbF≤10 HbF>10 HbF≤10 HbF>10
8
B
6
4
2
P>.05
Ur
lc Acld (mg/dL)
0
1000
C
800
600
200
P=.0210
LDH (U/L)
0
HbF≤10 HbF>10 HbF≤10 HbF>10
400
100
D
80
40
20
P=.0026
Arglnase I (ng/mL)
0 60
Figure1–ComparisonofhemolysisbiomarkerslevelsaccordingtoHbFconcentration.(A)Reticulocytes;(B)UricAcid;(C) Lactatedehydrogenase(LDH);(D)ArginaseI.Resultsareexpressedasmeans±standarderrorofthemean(SEM)and analyzedusingtheunpairedt-testandMann–Whitneytest.
Concerningtothe use ofhydroxyurea, asignificant dif-ferencewasobservedinthelevelsofarginaseIinpatients who used lower doses (<20mg/kg/day) compared to those on higher doses of hydroxyurea (≥20mg/kg/day) however, therewere nosignificant differencesin LDH,uricacid and reticulocytes. Although hydroxyurea can be used in SCA asitcanincreasetheconcentrationofHbF, somepatients may not respond well to medication, with many factors
100
60
40
20
P=.0197
Arginase I (ng/mL)
0
<20mg/kg/day
HU
≥20mg/kg/day 80
Figure2–ComparisonofarginaseIlevelsaccordingtoHU dosage.Resultsareexpressedinmean±standarderrorof mean(SEM)andanalyzedbyUnpairedttest.
involved,rangingfromgeneticpolymorphismstochangesin theabsorptionandmetabolismofthedrug.13,26,27
The current study did not include patients not taking hydroxyurea,asmorethan70%ofthepatientsofthe insti-tutions ofthis study haveclinicalindicationsand are thus treated using hydroxyurea. Further studies should be per-formedtoconsolidatetheresultsonhemolyticbiomarkersas aprognosticparameterinSCA.Ourfindingssuggestthatthe HbFconcentrationcaninterfereinhemolysis.However,other mechanismssuchasgeneticfactorsandtheuseof hydrox-yureamayalsoaffecttheseparameters.
Conflicts
of
interest
Theauthorsdeclarenoconflictsofinterest.
r
e
f
e
r
e
n
c
e
s
1.AdornoEV,ZanetteA,LyraI,SeixasMO,ReisMG,Gonc¸alves MS.Clinicalandmolecularcharacteristicsofsicklecell anemiainthenortheastofBrazil.GenetMolBiol. 2008;31(3):621–5.
2.KatoGJ,GladwinMT,SteinbergMH.Deconstructingsicklecell disease:reappraisaloftheroleofhemolysisinthe
3. KatoGJ,McgowanV,MachadoRF,LittleJA,TaylorJ6th,Morris CR,etal.Lactatedehydrogenaseasabiomarkerof
hemolysis-associatednitricoxideresistance,priapism,leg ulceration,pulmonaryhypertension,anddeathinpatients withsicklecelldisease.Blood.2006;107(6):
2279–85.
4. AtagaKI,MooreCG,JonesS,OlajideO,StrayhornD,
HinderliterA,etal.Pulmonaryhypertensioninpatientswith sicklecelldisease:alongitudinalstudy.BrJHaematol. 2006;134(1):109–15.
5. DiamondHS,MeiselAD,HoldenD.Thenaturalhistoryof urateoverproductioninsicklecellanemia.AdvInternMed. 1979;90(5):752–7.
6. JenkinsonCP,GrodyWW,CederbaumSD.Comparative propertiesofarginases.CompBiochemPhysiol. 1996;114B:107–32.
7. MorrisSMJr,BhamidipatiD,Kepka-LenhartD.HumantypeII arginase:sequenceanalysisandtissue-specificexpression. Gene.1997;193(2):157–61.
8. SchnogJJ,JagerEH,vanderDijsFP,DuitsAJ,MoshageH, MuskietFD,etal.Evidenceforametabolicshiftofarginine metabolisminsicklecelldisease.AnnHematol.
2004;83(6):371–5.
9. MorrisCR,KatoGJ,PoljakovicM,WangX,BlackwelderWC, SachdevV,etal.Dysregulatedargininemetabolism,hemolys isassociatedpulmonaryhypertension,andmortalityinsickle celldisease.JAMA.2005;294(1):81–90.
10.Vilas-BoasW,CerqueiraBA,ZanetteAM,ReisMG, Barral-NettoM,GoncalvesMS,ArginaseLevels.Their associationwithTh17-relatedcytokines,solubleadhesion molecules(Sicam-1andSvcam-1)andhemolysismarkers amongsteady-statesicklecellanemiapatients.Ann Hematol.2010;89(9):877–82.
11.CerqueiraBA,BoasWV,ZanetteAD,ReisMG,GoncalvesMS. IncreasedconcentrationsofIL-18anduricacidinsicklecell anemia:contributionofhemolysis,endothelialactivationand theinflammasome.Cytokine.2011;56(2):471–6.
12.AkinsheyeI,AlsultanA,SolovieffN,NgoD,BaldwinCT, SebastianiP,etal.Fetalhemoglobininsicklecellanemia. Blood.2011;118(1):19–27.
13.SteinbergMH,LuZH,BartonFB,TerrinML,CharacheS,Dover GJ.Fetalhemoglobininsicklecellanemia:determinantsof responsetohydroxyureaMulticenterStudyofHydroxyurea. Blood.1997;89(3):1078–88.
14.AkinsheyeI,SolovieffN,NgoD,MalekA,SebastianiP, SteinbergMH,etal.Fetalhemoglobininsicklecellanemia: molecularcharacterizationoftheunusuallyhighfetal hemoglobinphenotypeinAfricanAmericans.AmJHematol. 2012Feb;87(2):217–9.
15.MiltonJN,RooksH,DrasarE,McCabeEL,BaldwinCT,Melista E,etal.Geneticdeterminantsofhaemolysisinsicklecell anaemia.BrJHaematol.2013;161(2):270–8.
16.BallasSK,LieffS,BenjaminLJ,DampierCD,HeeneyMM, HoppeC,etal.Definitionsofthephenotypicmanifestations ofsicklecelldisease.AmJHematol.2010;85(1):6–13. 17.SteinbergMH,RodgersGP.Pathophysiologyofsicklecell
disease:roleofcellularandgeneticmodifiers.Semin Hematol.2001;38(4):299–306.
18.CortellazziC,TeixeiraSM,BorbaR,GervásioS,CintraCS, GrottoHZ.Reticulocyteparametersinhemoglobinopathies andirondeficiencyanemia.RevBrasHematolHemoter. 2003;25(2):97–102.
19.SteinbergMH.Predictingclinicalseverityinsicklecell anaemia.BrJHaematol.2005;129(4):465–81.
20.EliasDB,RochaLB,CavalcanteMB,PedrosaAM,JustinoIC, Gonc¸alvesRP.Correlationoflowlevelsofnitriteandhigh levelsoffetalhemoglobininpatientswithsicklecelldisease atbaseline.RevBrasHematolHemoter.2012;34(4):265–9. 21.StankovicStojanovicK,SteichenO,LefevreG,BachmeyerC,
AvellinoV,GrateauG,etal.Highlactatedehydrogenaselevels atadmissionforpainfulvaso-occlusivecrisisisassociated withsevereoutcomeinadultSCDpatients.ClinBiochem. 2012;45(18):1578–82.
22.TaylorJG6th,NolanVG,MendelsohnL,KatoGJ,GladwinMT, SteinbergMH.Chronichyper-hemolysisinsicklecellanemia: associationofvascularcomplicationsandmortalitywithless frequentvasoocclusivepain.PLoSONE.2008;3(5):e2095. 23.NajimOA,HassanMK.Lactatedehydrogenaseandseverityof
paininchildrenwithsicklecelldisease.ActaHaematol. 2011;126(3):157–62.
24.Al-NaamaLM,al-SadoonEA,al-SadoonTA.Levelsofuric acid,ureaandcreatinineinIraqichildrenwithsicklecell disease.JPakMedAssoc.2000;50(3):98–102.
25.Vilas-BoasW,CerqueiraBA,ZanetteAM,ReisMG, Barral-NettoM,GoncalvesMS.Arginaselevelsandtheir associationwithTh17-relatedcytokines,solubleadhesion molecules(sICAM-1andsVCAM-1)andhemolysismarkers amongsteady-statesicklecellanemiapatients.Ann Hematol.2010;89(9):877–82.
26.LettreG,SankaranVG,BezerraMA,AraújoAS,UdaM,Sanna S,etal.DNApolymorphismsattheBCL11A,HBS1L-MYB, andbetaglobinlociassociatewithfetalhemoglobinlevels andpaincrisesinsicklecelldisease.ProcNatlAcadSciUSA. 2008;105(33):11869–74.