Rev Saúde Pública 2006;40(1) www.fsp.usp.br/rsp
INTRODUCTION
Psychotropic drug use has increased in the last few decades in various Occidental countries4,13 and even
in some countries in the Orient.14,15 This increase has
been attributed to an increase in the frequency of the diagnosis of psychiatric disturbances in the popula-tion, the introduction of new psychotropic drugs in the pharmaceutical market, and new therapeutic rec-ommendations of already existent psychotropic drugs.
The prevalence of psychotropic use found in a
Modifications in psychotropic drug use
patterns in a Southern Brazilian city
Maria Aparecida P Rodrigues, Luiz Augusto Facchini and Maurício Silva de Lima
Programa de Pós-Graduação em Epidemiologia. Faculdade de Medicina. Universidade Federal de Pelotas. Pelotas, RS, Brasil
Correspondence:
Maria Aparecida P Rodrigues Avenida Duque de Caxias, 250 3o piso
96030-002 Pelotas, RS, Brasil E-mail: [email protected]
*Lima M. Morbidade Psiquiátrica Menor e Consumo de Psicofármacos em Pelotas, RS [Master’s dissertation]. Pelotas: Universidade Federal de Pelotas; 1995.
Based on Master’s dissertation presented at the Faculdade de Medicina of Universidade Federal de Pelotas, in 2004. Received on 10/1/2005. Reviewed on 2/8/2005. Approved on 8/8/2005.
Keywords
Psychotropic drugs, administration & dosage. Drug utilization, trends. Pharmacoepidemiology. Cross-sectional studies.
Psychopharmacology.
Abstract
Objective
To assess the prevalence and patterns of psychotropic use by population and to compare the results with a study carried out in 1994.
Methods
This is a population-based cross-sectional study carried out in 2003 with 3,542 participants aged 15 or older who lived in an urban area in Southern Brazil. Two-week recall data were collected in household interviews through the same questionnaire used in the 1994 study. The variables studied were age, gender, race, education, family income, marital status, smoking, medical diagnosis of hypertension, and physician visit at last three months. Pearson’s Chi-square and linear tendency were used in the bivariate analysis. Four levels of multivariate analysis was performed.
Results
The overall prevalence of psychotropic use was 9.9% (CI 95%: 8.9-10.9). There was no significant difference among standardized age groups when compared to the prevalence rates observed in 1994. Higher psychotropic use was associated with being female, older age, medical diagnosis of hypertension, and health service utilization. Of those interviewed, 74% of those drug users were using psychotropic drugs for over three months.
Conclusions
A decade later, prevalence remained high, yet psychotropic drug use did not increase. The association between health service utilization and consumption shows the importance of the appropriate prescription of psychotropic drugs and regular follow-up of those prescribed them by physicians.
1988 study1 in Ilha do Governador (state of Rio de
Janeiro), was 5.2% and 10% in a 1993 study in the city of São Paulo.7
Rev Saúde Pública 2006;40(1) www.fsp.usp.br/rsp Modifications in psychotropic drug use
Rodrigues MAP et al
dence interval. In addition, it permitted the detection of relative risks equal to or greater than 1.6 with 80% power for predictors with frequencies between 20% and 80% and psychotropic use prevalence rate of 7% for those unexposed, with a significance level of 5%. The calculation was estimated using EpiInfo 6.04d.
The data collection instrument used was the same instrument used in the 1994* study. It consisted of a structured and pre-coded questionnaire and included specific aspects of psychotropic drug use including demographic, socioeconomic, and health variables. Thirty-two interviewers were selected who were all 18 or older and had completed high school. They completed a 40 hour training session and a theory and practice exam. A pilot study to test the question-naire, instructions manual, and interview training was conducted in a census district, which was not included in the sample.
Fieldwork was conducted during the months of October through December of 2003 and data was collected directly with eligible individuals through interviews in their homes. In cases of absence or refusal, the interviewers returned at least two more times to the household. In an attempt to revert re-fusals, the district supervisor made an attempt to encourage participation.
Data entry was conducted using EpiInfo 6.04d with double data entry and automatic checks for consist-ency and range.
The dependent variable was defined by the follow-ing question: “Since <day of the week> the week before last, have you taken any medication for nerv-ousness or to sleep or any other medication that is only sold with a prescription?”. Respondents were asked to show their prescription, packaging, or in-structions so that interviewers could note and code the medication in the future based on the Ministry of Health’s National Agency of Sanitary Vigilance (ANVISA) list of controlled medicines (A3, B1, B2, and C1). If the respondent took more than one medi-cation, the one that was most recently used was in-cluded. The length of time using the medication, place of acquisition, person responsible for recommending the medication, and if the person used any other psy-chotropic drugs other than that already indicated were also included in the questionnaire. Chronic use was considered those who used the drug intermittently for at least three months.
The following independent variables were studied:
*Instituto Brasileiro de Geografia e Estatística. Censo demográfico de 2000. Available from: http://www.ibge.gov.br/cidadesat [2005 nov 18]
**Lima M. Morbidade Psiquiátrica Menor e Consumo de Psicofármacos em Pelotas, RS [Master’s dissertation]. Pelotas: Universidade Federal de Pelotas; 1995.
During this same period, the Pelotas mental health services were expanded through the creation of vari-ous Psychosocial Care Centers (CAPS). This was ac-companied by the creation of the Municipal Phar-macy which caused an increase in free access to psy-chotropic drugs among those who use the One Health System (SUS).
Even though the facts cited indicate a likely in-crease in the use of psychotropic, there is no study in the country that has evaluated the use of psycho-tropic drugs among the same population group dur-ing a set amount of time. The objective of the current study was to verify the current prevalence and pat-tern of psychotropic drug use in comparison to the 1994 findings.
METHODS
The study was conducted in Pelotas, a mid-sized port city located in the extreme south of Brazil with a population of approximately 320,000, of which 93.2% reside in urban areas (Demographic Census 2000 IBGE*).
This cross-sectional study was conducted in 2003 with individuals 15 years and older who were resi-dents in the urban areas of the city.
The process of defining the sample was conducted in various stages. The groups were selected based on the municipal districts defined in the 2000 IBGE Demographic Census. After excluding the collective districts, 144 of the 404 municipal districts were sys-tematically sorted and stratified according to the av-erage income of the head of household. Each district was then visited to identify the households. The households were chosen proportionately based on the size of each district, after the exclusion of those which were abandoned or commercial spaces, lead-ing to the definition of a sample of 1,530 eligible households. All of those living in the households who were 15 or older were included in the sample.
confi-!
Rev Saúde Pública 2006;40(1) www.fsp.usp.br/rsp
Modifications in psychotropic drug use Rodrigues MAP et al
sex; age (years completed); skin-color (white or non-white); marital status (with, without companion, separated, or widowed; educa-tion (years of school completed); family in-come (monthly minimum wage according to the value of the national minimum wage during the period of data collection, in quar-tiles); smoking (non-smoker, smoker, or former smoker); medical diagnosis of hyper-tension, and medical consultation in the last three months.
Data analysis was conducted using Stata 8.0. First, a description of the sample was conducted. Pearson’s Chi-square and linear tendency were used in the bivariate analysis.
The adjusted analysis was conducted using linear regression based on a conceptual linear analysis model composed of four levels. In the first level were the demographic variables (sex, age, skin color), the second level were the socioeconomic variables (mari-tal status, education, family income), the third level included smoking status and medical diagnosis of systemic arterial hypertension, and in the fourth level, medical consultation in the last three months. The variables associated with exposure and the depend-ent variable were kept in the analysis with p≤0.20 for control of the confounders.
The comparison of total prevalence of psychotropic use and the proportion of usage in the variables of exposure of the 1994 and 2003 studies used the pro-portional comparison test.
The study was submitted to and approved by the Universidade Federal de Pelotas Commission of E-thics and Research. Before of the questionnaire was administered, verbal consent was obtained from the respondents and the confidentiality of the data col-lected was guaranteed.
RESULTS
A total of 3,542 individuals were included in the study, excluding those missing and refusals (3.8%). The medical diagnosis of hypertension variable had 446 missing values, of which 439 related to the group under 20 years old. Data for these individuals was only collected among those who used psychotropic drugs, which only was the case for three individuals of whom none of them had a medical diagnosis of hypertension. In 1994, the sample was 1,277 people.
The prevalence of psychotropic use was 9.9% (95% CI: 8.9-10.9), with a study delineation effect of 1.03
and intraclass correlation of 0.005. In 1994, the preva-lence rate was 11.9% (95% CI: 10.1-13.7). After the standardization of the data by age, the prevalence went from 11.5% in 1994 to 10.0% in 2003 and there was no significant difference between the two (p=0.13).
In 1994, 92% of psychotropic drug users received a prescription for the medication from their physi-cian. The remaining 8% decided to take the medica-tion on their own. The percentage of psychotropic use with a medical prescription was 92%, of which 41% was through a general clinic, 20% through psy-chiatrists, and 31% through other specialists.
The figure shows the comparison by group of psy-chotropic drugs consumed in 1994 and 2003. In both studies, the benzodiazepines represent more than half of the psychotropic drugs consumed. In 2003, there was a reduction in the proportion of antipsychotic use (p=0.09) and anorexigens (p=0.0006), in com-parison with the 1994 study. On the other hand, there was a significant increase in the antidepressant use in 2003 in comparison with 1994 (p=0.0003).
In 1994, 7.2% of the individuals utilized another psychotropic drug. The percentage increased signifi-cantly (p<0.001) to 22.2% in 2003. Chronic use did not vary significantly between the two studies even though it increased from 70.4% in 1994 to 73.9% in 2003 (p=0.35). Nonetheless, access to psychotropic drugs in the SUS pharmacy presented a highly sig-nificant increase from 3.5% in 1994 to 11.1% in 2003 (p<0.001).
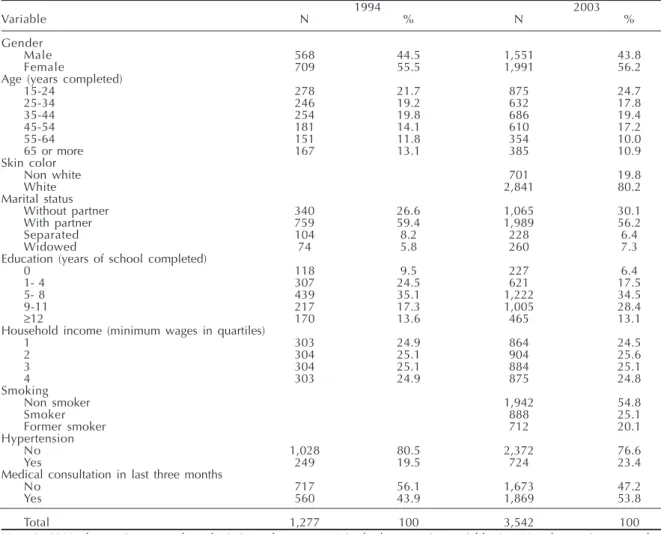
Table 1 describes the study samples in 1994 and 2003 according to the demographic, socioeconomic, and health variables. The distribution of the character-istics between the variable categories was similar in both studies. More than half of the individuals were women in 1994 and in 2003. In 1994, 22% of the indi-viduals were between 15 and 24, and in 2003, the per-centage was 25%. In 1994, 59% had a partner and in 2003, the percentage was 56%. With regard to educa-tion, the percentage of individuals who reported
be-57.9%
11.8% 9.0%
8.4%
7.9% 5.0% Benzodiazepínes
Antipsychotic Amphetamine derivative Antidepressant Anticonvulsant Others
52.1% 31.6%
6.7% 3.7%
4.0% 1.9%
1994 2003
178 426
" Rev Saúde Pública 2006;40(1) www.fsp.usp.br/rsp Modifications in psychotropic drug use
Rodrigues MAP et al
tween 9 and 11 years of education increased from 17% to 28% in 2003. Note that hypertension went from 20% in 1994 to 23% in 2003. With regard to medical visits in the last three months, note that the percentage went from 44% to 54% in 2003. In 2003, 55% of re-spondents did not smoke and 80% were white.
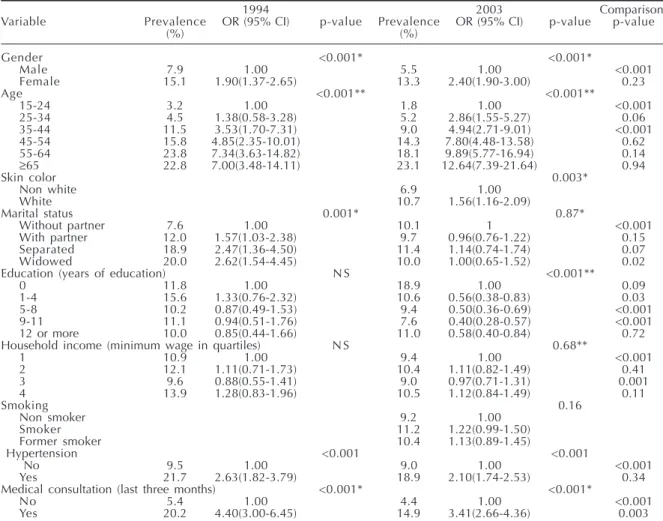
Table 2 presents the patterns of psychotropic drug use in 1994 and 2003, stratified by demographic, so-cioeconomic, and health variables. It examines their differences using the proportions comparison test.
The consumption of psychotropic drugs was sig-nificantly higher among females in both years ana-lyzed and reached more than double that of the males in 2003. There was a statistically significant reduc-tion in psychotropic use among men in 2003 when compared with the 1994 study.
Psychotropic use increased with age and presented a strong linear tendency in both years. In 2003, there was a reduction in use among the younger groups
when compared to 1994, which was significant in the age brackets between 15 and 24 and 35 to 44. As the age group 15 to 24 was the reference category, the odds ratio increased in 2003 as compared to 1994. However, in both studies the levels of usage were simi-lar among the age bracket 45 and older.
In 1994, the individuals with partners, separated, and widowed used significantly more psychotropic drugs than those without a partner. Marital status did not present a significant association with psycho-tropic use in 2003 due to the increase in usage within the reference category of “without partner”. There was a statistically significant decrease in the widowed category in comparison with the 1994 study.
Education was not significantly associated with psy-chotropic use in 1994. In 2003, a reduction in psycho-tropic use was observed among individuals with high levels of education when compared to the group with-out education (p<0.001). This change occurred because there was a significant reduction in psychotropic use
Table 1 - Description of sample according to their demographic, socioeconomic, behavioral, and health characteristics. Pelotas, Brazil, 1994 and 2003.
1994 2003
Variable N % N %
Gender
Male 568 44.5 1,551 43.8
Female 709 55.5 1,991 56.2
Age (years completed)
15-24 278 21.7 875 24.7
25-34 246 19.2 632 17.8
35-44 254 19.8 686 19.4
45-54 181 14.1 610 17.2
55-64 151 11.8 354 10.0
65 or more 167 13.1 385 10.9
Skin color
Non white 701 19.8
White 2,841 80.2
Marital status
Without partner 340 26.6 1,065 30.1
With partner 759 59.4 1,989 56.2
Separated 104 8.2 228 6.4
Widowed 74 5.8 260 7.3
Education (years of school completed)
0 118 9.5 227 6.4
1- 4 307 24.5 621 17.5
5- 8 439 35.1 1,222 34.5
9-11 217 17.3 1,005 28.4
≥12 170 13.6 465 13.1
Household income (minimum wages in quartiles)
1 303 24.9 864 24.5
2 304 25.1 904 25.6
3 304 25.1 884 25.1
4 303 24.9 875 24.8
Smoking
Non smoker 1,942 54.8
Smoker 888 25.1
Former smoker 712 20.1
Hypertension
No 1,028 80.5 2,372 76.6
Yes 249 19.5 724 23.4
Medical consultation in last three months
No 717 56.1 1,673 47.2
Yes 560 43.9 1,869 53.8
Total 1,277 100 3,542 100
#
Rev Saúde Pública 2006;40(1) www.fsp.usp.br/rsp
Modifications in psychotropic drug use Rodrigues MAP et al
in the categories of 1 to 4, 5 to 8, and 9 to 11 years of school in comparison to the 1994 study.
Psychotropic use was not significantly associated with family income in 1994 and 2003. However, a sta-tistically significant reduction was observed in psy-chotropic use in the first and third quartiles of family income in 2003 when compared to the 1994 study.
Note that individuals with hypertension used more psychotropic drugs than those who did not have hyper-tension in both the 1994 and 2003 studies (p<0.001).
Individuals who had a medical consultation in the last three months reported significantly higher psy-chotropic use than those who had not in both studies. Nonetheless, in the 2003 study, a significant reduc-tion in psychotropic use among those who had a medical consultation in the last three months was observed when compared to the 1994 study.
In 2003, white individuals reported higher psycho-tropic use than non-whites (p=0.003) and with re-gards to smoking, no association with psychotropic use was found. The smoking and skin color data from the 1994 study were not released.
After controlling for confounders, being female, older age, hypertension, and a medical consultation in the last three months continued to be significantly associated with psychotropic use in the 1994 and 2003 studies. Marital status was no longer signifi-cantly associated with psychotropic use in 1994. The adjustment made in 2003 maintained a significant association between white skin color with psycho-tropic use and found a significant association be-tween smoking and psychotropic use.
DISCUSSION
Possible memory bias is inherent in a study of
us-Table 2 - Prevalence, unadjusted odds ratio for psychotropic use and comparison of prevalence rates between the two years studied. Pelotas, Brazil, 1994 and 2003.
1994 2003 Comparison
Variable Prevalence OR (95% CI) p-value Prevalence OR (95% CI) p-value p-value
(%) (%)
Gender <0.001* <0.001*
Male 7.9 1.00 5.5 1.00 <0.001
Female 15.1 1.90(1.37-2.65) 13.3 2.40(1.90-3.00) 0.23
Age <0.001** <0.001**
15-24 3.2 1.00 1.8 1.00 <0.001
25-34 4.5 1.38(0.58-3.28) 5.2 2.86(1.55-5.27) 0.06
35-44 11.5 3.53(1.70-7.31) 9.0 4.94(2.71-9.01) <0.001
45-54 15.8 4.85(2.35-10.01) 14.3 7.80(4.48-13.58) 0.62
55-64 23.8 7.34(3.63-14.82) 18.1 9.89(5.77-16.94) 0.14
≥65 22.8 7.00(3.48-14.11) 23.1 12.64(7.39-21.64) 0.94
Skin color 0.003*
Non white 6.9 1.00
White 10.7 1.56(1.16-2.09)
Marital status 0.001* 0.87*
Without partner 7.6 1.00 10.1 1 <0.001
With partner 12.0 1.57(1.03-2.38) 9.7 0.96(0.76-1.22) 0.15
Separated 18.9 2.47(1.36-4.50) 11.4 1.14(0.74-1.74) 0.07
Widowed 20.0 2.62(1.54-4.45) 10.0 1.00(0.65-1.52) 0.02
Education (years of education) N S <0.001**
0 11.8 1.00 18.9 1.00 0.09
1-4 15.6 1.33(0.76-2.32) 10.6 0.56(0.38-0.83) 0.03
5-8 10.2 0.87(0.49-1.53) 9.4 0.50(0.36-0.69) <0.001
9-11 11.1 0.94(0.51-1.76) 7.6 0.40(0.28-0.57) <0.001
12 or more 10.0 0.85(0.44-1.66) 11.0 0.58(0.40-0.84) 0.72
Household income (minimum wage in quartiles) N S 0.68**
1 10.9 1.00 9.4 1.00 <0.001
2 12.1 1.11(0.71-1.73) 10.4 1.11(0.82-1.49) 0.41
3 9.6 0.88(0.55-1.41) 9.0 0.97(0.71-1.31) 0.001
4 13.9 1.28(0.83-1.96) 10.5 1.12(0.84-1.49) 0.11
Smoking 0.16
Non smoker 9.2 1.00
Smoker 11.2 1.22(0.99-1.50)
Former smoker 10.4 1.13(0.89-1.45)
Hypertension <0.001 <0.001
No 9.5 1.00 9.0 1.00 <0.001
Yes 21.7 2.63(1.82-3.79) 18.9 2.10(1.74-2.53) 0.34
Medical consultation (last three months) <0.001* <0.001*
No 5.4 1.00 4.4 1.00 <0.001
Yes 20.2 4.40(3.00-6.45) 14.9 3.41(2.66-4.36) 0.003
Note: In 2003, the sample size was 3,542 and the maximum number of missing values was 446 in the hypertension variable. In 1994, the sample size was 1,277 and the maximum number of missing values was 63 in the household income variable. OR: Odds ratio
$ Rev Saúde Pública 2006;40(1) www.fsp.usp.br/rsp Modifications in psychotropic drug use
Rodrigues MAP et al
age relying on recall. Nonetheless, the time period of 14 days is short and various studies in this field have used this time period. The 1994 study used this same time period which allows for comparison.
The absence of a difference between the prevalence patterns of psychotropic use in 1994 and 2003 con-trasts with the rest of global literature, which sug-gests an increase in psychotropic use in recent dec-ades.3,13 One possible explanation is that psychotropic
use was already high in the city (11.9% in 1994*) when compared to findings in national (5.4% in a 1993 study1 in Rio de Janeiro) and international (6.4%
in a 2002 multi-center study11 in various European
countries) literature.
The percent of self-medication in 2003 was the same as in 1994, which shows that part of those who use psychotropic drugs (8%) continue to use them with-out medical orientation. This finding points to a need for educational campaigns regarding the risks of self-medication.
The increase in antidepressant usage in the last decade demonstrates a tendency supported by other research3,12 which has shown an increase in the
diag-nosis of depressive diseases accompanied by an in-crease in new medications and an expansion of thera-peutic uses for these medications.
The decrease in anorexigen use should be observed with caution. In the 1994 study it was investigated in more detail than in 2003, which increased the possi-bility of the respondents reporting its use.
The increase in the proportion of individuals using another kind of psychotropic medicine may indicate an increase in outpatient treatment for more serious mental disturbances, which takes advantage of the location of these individuals in their households.
The important increase in the percentage of indi-viduals who received psychotropic medicines in the SUS pharmacy indicates that there was greater access to psychotropic drugs among individuals with lower wages. This finding suggests an increase in equal access to this medication and also assists in under-standing why there was no association between psy-chotropic use and family income.
The risk of use increased among women even though there was no difference in use among females between 1994 and 2003 and a reduction in use among males. Psychotropic use was greatest among women, being twice that of men in 2003. This finding is
sup-ported by other literature1,6,7 which relates this
find-ing in part to the greater use of health services by women than men.8 On the other hand, gender is also
associated with a distinct medical perspective of the need to use psychotropics. In their evaluation of pri-mary care medical visits, Moreno Luna et al9
con-cluded that physicians address symptoms of anxiety and depression differently depending on the sex of their patients by prescribing more ansiolitic drugs and diagnosing more functional causes for women.
Psychotropic use increased with older age among the age groups analyzed. This is supported by the literature.1,6 In contrast, the reduction observed in use
among the age group of 15-24 is not supported by the literature. This finding may support a tendency found in industrialized countries of an increase in psychotropic use among younger people16 that is still
not observed in Brazil. On the other hand, the diffi-culties young people face in accessing specialized neurological public medical and mental health serv-ices may partly explain this finding. With regard to the elderly, the large usage psychotropic drugs is cause for alarm due to the increased risk of cognitive degeneration, syncope, breaks and fractures associ-ated with these medicines, which are already more frequent within this group.
The greater use of psychotropic drugs observed among whites in 2003 may be related to cultural fac-tors and inequality in the health care system. Olfson12
had already detected lower indices of treatment for depression among blacks and Hispanics as compared to whites during a ten year period in the United States.
Even though psychotropic use was not associated with education in 1994 and 2003 in the adjusted analysis, use was greater among individuals without education in 2003. This finding may be related to the greater frequency of mental disturbances within this group, as observed by Ludermir.5
With regard to the increased use of psychotropic drugs among smokers in the adjusted analysis of the 2003 study, it is noteworthy that an association be-tween mental illness and nicotine dependencehas been documented4,11 and considered an outcome of
addictive behavior. As such, it is important to con-sider that psychotropic drugs are frequently prescribed in combination with treatment for tobacco depend-ence. The association between the medical diagnosis for hypertension and psychotropic use may indicate, similar to what was observed in a multi-center study,11
that individuals who have a chronic organic disease may have an increased probability of receiving a
%
Rev Saúde Pública 2006;40(1) www.fsp.usp.br/rsp
Modifications in psychotropic drug use Rodrigues MAP et al
chotropic prescription due to the fact that they go to the doctor more frequently.
Further applying this perspective, it is possible to understand the strong connection between medi-cal consultations in the last three months and psy-chotropic use in both the 1994 and 2003 studies. This shows the importance of the medical consul-tations, which should be valued by physicians and patients alike to ensure that the prescription of psy-chotropic drugs is the result of an adequate diag-nosis. In conclusion, this study showed a panorama of current psychotropic use in this location, in ad-dition to comparing findings with a previous study conducted in the same city. It is hoped that the
f indings will contribute to the advancement of mental health policies and pharmaceutical care including efforts related to services offered, per-manent education for doctors and health profes-sionals, and health education for psychotropic users and the general population.
The present study only researched the characteris-tics of psychotropic drug users. In the future, studies regarding other factors which influence the use of psychotropic drugs, such as the characteristics of the physicians and their relationship to the health care system, will be necessary in addition to the use of qualitative techniques to more extensively examine psychotropic drug use.
REFERENCES
1. Almeida L, Coutinho E, Pepe V. Consumo de psicofár-macos em uma região administrativa do Rio de Janeiro: a Ilha do Governador. Cad Saúde Pública 1994;10(1):5-16.
2. Cherin P, Colvez A, Deville de Periere G, Sereni D. Risk of syncope in the elderly and consumption of drugs: a case-control study. J Clin Epidemiol 1997;50(3):313-20.
3. Hemels ME, Koren G, Einarson TR. Increased use of antidepressants in Canada, 1981-2000. Ann Pharmacother 2002;36(9):1375-9.
4. Leon J, Becona E, Gurpegui M, Gonzalez-Pinto A, Diaz FJ. The association between high nicotine dependence and severe mental illness may be consistent across countries. J Clin Psychiatry 2002;63(9):812-6.
5. Ludermir AB, Melo Filho DA. Condições de vida e estrutura ocupacional associadas a transtornos mentais comuns. Rev Saúde Pública 2002;36(2):213-21.
6. Magrini N, Vaccheri A, Parma E, D’Alessandro R, Bottoni A, Occhionero M et al. Use of
benzodiazepines in the italian general population: prevalence, pattern of use and risk factors for use. Eur J Clin Pharmacol 1996;50(1-2):19-25.
7. Mari JJ, Almeida Filho N, Coutinho E, Andreoli SB, Miranda CT, Streiner D. The epidemiology of psychotropic use in the city of São Paulo. Psychol Med 1993;23(2):467-74.
8. Mendoza-Sassi R, Béria JU. Utilización de los servicios de salud: una revisión sistemática sobre los factores relacionados. Cad Saúde Pública
2001;17(4):819-32.
9. Moreno Luna ME, Clemente Lirola E, Pinero Acín MJ, Martinez Matías MR, Alonso Gómez F, Rodríguez Alcalá FJ. Influencia del género del paciente en el manejo de cuadros ansioso/depresivos. Aten Primaria 2000;26(8):554-8.
10. Neutel CI, Perry S, Maxwell C. Medication use and risk falls. Pharmacoepidemiol Drug Saf
2002;11(2):97-104.
11. Ohayon MM, Lader MH. Use of psychotropic medication in the general population of France, Germany, Italy and the United Kingdom. J Clin Psychiatry 2002;63(9):817-25.
12. Olfson M, Marcus SC, Druss B, Elinson L, Tanielian T, Pincus HA. National trends in the outpatient treatment of depression. JAMA 2002;287(2):203-9.
13. Pincus HA, Tanielian T, Marcus SC, Olfson M, Zarin DA, Thompson J et al. Prescribing trends in
psychotropic medications: primary care, psychiatry, and other medical specialties. JAMA
1998;279(7):526-31.
14. Tajima O. Mental health care in Japan: recognition an treatment of depression and anxiety disorders. J Clin Psychiatry 2001;62 Suppl 13:39-44.
15. Ungvari GS, Chung YG, Chee YK, Fung-Shing N, Kwong TW, Chiu HF. The pharmacological treatment of schizophrenia in chinese patients: a comparison of prescription patterns between 1996 and 1999. Br J Clin Pharmacol 2002;54(4):437-44.