Article
Printed in Brazil - ©2013 Sociedade Brasileira de Química0103 - 5053 $6.00+0.00
A
*e-mail: [email protected]
13
C NMR and EPR Spectroscopic Evaluation of Oil Shale Mined Soil Recuperation
J. V. dos Santos,a A. S. Mangrich,*,a,b B. F. Pereira,c C. N. Pillon,d E. H. Novotny,e
T. J. Bonagamba,f G. Abbt-Braung and F. H. Frimmelg
aUniversidade Federal do Paraná, CP 19081, 81531-990 Curitiba-PR, Brazil
bInstituto Nacional de Ciência e Tecnologia: Energia and Ambiente, 40170-290 Salvador-BA, Brazil
cEMBRAPA Clima Temperado, 96001-970 Pelotas-RS, Brazil
dEstação Experimental Cascata, EMBRAPA Clima Temperado, 96001-970 Pelotas-RS, Brazil
eEMBRAPA Solos, Jardim Botânico, 22460-000 Rio de Janeiro-RJ, Brazil
fInstituto de Física de São Carlos, Universidade de São Paulo, CP 369, 13560-970 São Carlos-SP, Brazil
gEngler-Bunte-Institut, Universität Karlsruhe (TH), Engler-Bunte-Ring 1, 76131 Karlsruhe, Germany
Neste trabalho foram analisadas amostras de matéria orgânica de solos (MOS) de área de floresta nativa (SFN) e de solos de uma área vizinha, local de mineração de xisto, que vem sendo reabilitada há 30 anos (SFR). As espectroscopias de ressonância paramagnética eletrônica (RPE, banda X) e ressonância magnética nuclear (RMN) de 13C com as amostras no estado sólido foram
utilizadas para avaliar a recuperação do solo reabilitado após a mineração do xisto. Estudos de correlação heteroespectral bidimensional dos resultados obtidos por RPE e RMN 13C foram
utilizados para obter informações sobre a estrutura da matéria orgânica do solo e suas interações com o oxicátion paramagnético residual VO2+. As estruturas orgânicas hidrofílicas, que correlacionaram
positivamente com o oxicátion metálico VO2+, são do tipo ácido urônico, determinadas por
RMN 13C, e negativamente com o sinal do radical livre orgânico (RLO) associado a átomos de
oxigênio (g = 2,0042). As estruturas hidrofóbicas aromáticas se correlacionaram positivamente com o sinal de RPE do RLO associado a átomos de carbono (g = 2,0022). Os dados das duas técnicas espectroscópicas magnéticas aplicadas às amostras de ambos os solos (SFN e SFR) mostram que o processo usado na recuperação dos solos de mineração vem sendo efetivo.
In this work, native forest soil (NFS) organic matter (SOM) sample and SOM samples from a neighboring forest soil area of an oil shale mine which is being rehabilitated for thirty years (RFS) were analyzed. X-band electron paramagnetic resonance (EPR) and solid-state 13C nuclear
magnetic resonance (NMR) spectroscopies were used to evaluate the soil reclamation of the Brazilian oil shale mining process. Two-dimensional heterospectral correlation studies of the results obtained from EPR and 13C NMR were used to obtain information about SOM structures and their
interactions with residual paramagnetic metal ion. The signal of the residual metallic oxycation, VO2+ correlated positively with uronic acid-type hydrophilic organic structures, determined from the 13C NMR spectra, and correlated negatively with the organic free radical (OFR) signal associated
with oxygen atoms (g = 2.0042). The hydrophobic aromatic structures correlate positively with the EPR OFR signal associated with carbon atoms (g = 2.0022). The data from the two spectroscopic magnetic techniques show that the used recuperation process is effective.
Keywords:13C NMR spectroscopy, EPR spectroscopy, soil organic matter, study of mining
soil recuperation, 2D hetero-spectral correlation spectroscopy
Introduction
Following the US, Brazil is the second most important country in oil shale reserves. The biggest Brazilian oil shale
reserve is the Formação Irati (Paraná Bay) that is estimated to contain extractable 700 million barrels of extractable oil, 9 million Mg of light fuel, 25 billion m3 of shale gas, and
started to develop a process called Petrosix® to extract fuel
oil, gas and sulfur from the oil shale.
It is known that the degradation of soils in open sky mining environments is high according to the excavation of large areas, and the movement of huge volumes of solid materials. Most of the activities of mineral extraction involve a loss of soil layers, and consequently the loss of natural organic matter (NOM) and of natural fertility. As the mining area of the SIX lies in the Atlantic Forest, there is also a loss of its typical biodiversity. For the recovery of the mined area, SIX uses techniques that have been developed in house with the support of research institutions including universities. The techniques comprise a topographic reposition using the soil layers from the next mining front and the solid by-products of the SIX process, such as shale powder, dolomitic limestone and, at the bottom of the soil column, retorted shale. At the end, re-vegetation is made with natural species of the region. In addition, fauna re-introduction is systematically done.
The degraded area renovation is considered to be a process of restoration of the ecosystem, so it is important to determine the rate of reclamation of the suitable soil for that. The recovery of degraded areas is called successful when the physical, chemical, biological and mineralogical soil properties present appropriate conditions for the development of plants.¹
In some studies of the soil organic matter (SOM) structure, the metal ions present can affect the results obtained with spectroscopic techniques, such as nuclear magnetic resonance (NMR),2-6 fluorescence4,7,8 and electron
paramagnetic resonance (EPR)4,9-11 spectroscopy. In case
of high metal concentrations (especially paramagnetic ions such as Fe3+) in soil, the recording of good spectra
can be unfeasible or the interpretation is questionable. On the other hand, fluorescence quenching of SOM by paramagnetic metal ions can give valid information on metal complexation reactions.12 More recently, the
pretreatment of soil samples with aqueous solution of 10% HF has been used successfully to prepare SOM samples for analysis by spectroscopic techniques such as EPR and
13C NMR.13,14 The traditional HCl/HF mixture treatment
has to be avoided since HCl (a strong acid) can cause hard hydrolysis reactions in the original SOM. Besides being a weak acid, aqueous HF solution produces the F−anion, which as a hard base ligand preferably breaks chemical bounds of hard acid metal ions15 in oxides and hydroxides
such as Al−O, Fe−O and Si−O, leading to the formation of
the water soluble metal anions, [SiF6]2−, [Al(OH)
3F3]3− and
[Fe(OH)3F3]3−. This treatment with HF solution improves
the resolution of EPR and 13C NMR spectra of SOM
samples by the withdrawal of inorganic matter, mainly
clay minerals, oxide-hydroxide metal ions and other silicon compounds.13,14,16 The remaining paramagnetic metal ions
can be used as spectroscopic (EPR) probes to study the interactions of SOM with inorganic constituents.17-22 In
general, the 13C NMR spectra of the HF extracted SOM
even resemble the ones for water soluble NOM from humic rich lakes.23
2D Hetero-spectral correlation is a method in which two completely different types of spectra obtained from the same set of samples are mathematically correlated. In other words, the Pearson correlation coefficients (R) are calculated for two spectral signals, e.g., 13C NMR and EPR
signals. From the response pattern of the set of samples monitored by two different probes, e.g., 13C nucleus and
paramagnetic probes, under the same source of variation (the variability among the studied samples), a correlation between two spectral signals can be obtained.24
With the presented work, our group seeks to evaluate, in terms of the (SOM) chemical structure, the efficiency of the utilized reclamation process by studying comparatively recovered soils of the mining area and native soils of the neighboring area. For this, native forest soil (NFS) samples and the corresponding, thirty year rehabilitated forest soil (RFS) samples were analyzed,
using X-band EPR and 13C NMR spectroscopies to
determine differences and similarities between them. Also spectroscopic correlation studies among the results
obtained from EPR and 13C NMR spectroscopy were used
to gain information about SOM structure interaction with residual paramagnetic metal ion.4,11,25
Experimental
Soil samples
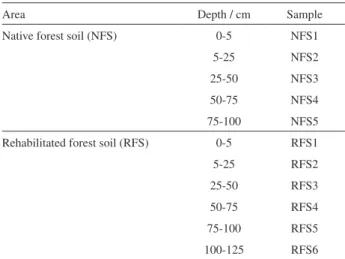
Samples from NFS and RFS were taken at several depths (Table 1), in São Mateus do Sul, Paraná State, Brazil, (25°52’26” S, 50°22’58” W). Approximately 500 g of sample were taken according to the depth.
Hydrofluoric acid treatment of the soil samples
After being strained with a 2 mm sieve, the soil samples were treated with 10% (m/m) HF aqueous solutions according to Dick et al.16. Briefly, 15 g of each soil sample
eight times. The solid residue (concentrated SOM) was washed three times with distilled and deionized water to remove the residual solution, and dried in an oven at 50 ºC.
Soil organic matter analyses
Electron paramagnetic resonance spectroscopy (EPR) All the EPR spectra were acquired at room temperature (ca. 300 K) in a Bruker EMX spectrometer operating in
X-band (9.5 GHz). For the full EPR spectra (∆B = 500 mT),
two scans were accumulated with the following experimental parameters: sweep field of 500 mT, center field of about 330 mT, microwave power of 20 mW and modulation amplitude of 0.5 mT. For the analyses of residual paramagnetic metal ions, without zero-field splitting interaction, five scans were accumulated in a 200 mT sweep field, center field of 347 mT, microwave power of 5 mW and modulation amplitude of 0.2 mT. For the organic free radical (OFR) analysis (OFR spectra), ten scans were accumulated in the gca. 2 region, with the OFR signal
centered in the 5 mT sweep field, the microwave power was 0.2 mW, and the modulation amplitude was 0.1 mT.
The EPR data were submitted to treatment with the
aid of the Win-EPR® computer program, and “weak
pitch” reference of g = 2.0028, supplied by Bruker. SOM free radicals were quantified using the approximation: intensity x ∆B2.16 The area of the EPR peaks were calibrated
with that corresponding to the EPR signal of the “weak pitch” (Bruker) reference of known free radical content.
13C Nuclear magnetic resonance (NMR)
A JACKOBSEN 7 mm magic-angle spinning (MAS) double-resonance probe head was used for variable amplitude cross-polarizations (VACP) experiments at spinning frequencies of 5 kHz using a four pulse total
suppression of spinning sidebands (TOSS). Typical cross-polarization times of 1 ms, acquisition times of 13 ms and recycle delays of 500 ms were used. The cross-polarization time was chosen after variable contact time experiments, and the recycle delays in CP experiments were chosen to be five times longer than the longest
1H spin-lattice relaxation time (T
1H) as determined by
inversion-recovery experiments.26 High power 1H two-pulse
phase modulation (TPPM) decoupling27 of 80 kHz was
applied in all experiments.
Principal component analysis (PCA)
The 13C NMR spectra of the eleven samples were
centered by subtracting the average value of the samples for each data point. By this, the results can be interpreted in terms of deviations from the average. PCA was carried out using The Unscrambler (CAMO Software AS, Oslo, Norway) software. The model validation was carried out using full cross validation. The difference in the variance between the calibration and validation models was less than 5%.
Hetero-spectral correlation analysis
The EPR second derivative spectra of the OFR region (g ca. 2, ∆B = 5 mT) and of the residual paramagnetic metal
ions without zero-field splitting were calculated. These
calculated second derivative EPR spectra and 13C NMR
spectra of the eleven samples were auto-scaled (null mean value and unit variance), by this mode, the scales of the obtained 2D spectra were in Pearson correlation coefficients. To perform this analysis, the freeware software 2DShiga (Shigeaki Morita, Kwansei-Gakuin University, 2004-2005) was used.
Results and Discussion
Electron paramagnetic resonance spectroscopy (EPR)
EPR spectra of the NFS and RFS OM samples, after treatment with 10% aqueous HF solutions, at a sweep range of 500 mT (∆B = 500 mT), are shown in Figures 1a and 1b.
All spectra show a sharp line at the g ca. 2.00 region,
typical for OFR absorption. Spectra for the NFS3 to NFS5 (Figure 1a) and RFS2 to RFS4 (Figure 1b) samples show typical absorption lines of outer sphere Mn2+ ion
complex, [Mn(OH2)6]2+-SOM, with hyperfine interaction,
Aca. 10 mT, and g ca. 2.
The magnitude of the EPR hyperfine A parameter is inversely related to the degree of covalent bonds of Mn2+
ions in their complexes.28 This value of A ca. 10 mT
indicates a more ionic interaction of Mn2+ in the studied
Table 1. Soil samples characterized by area and depth of collection
Area Depth / cm Sample
Native forest soil (NFS) 0-5 NFS1
5-25 NFS2
25-50 NFS3
50-75 NFS4
75-100 NFS5
Rehabilitated forest soil (RFS) 0-5 RFS1
5-25 RFS2
25-50 RFS3
50-75 RFS4
75-100 RFS5
SOM samples. Practically all samples showed evidence of high spin Fe3+ (S = 5/2) complexes in distorted octahedral
and/or tetrahedral, rhombic coordination structure (g = 4.3, B = 150 mT). Those lines are said from Fe3+ absorption in
dilute domains. In general, the studied SOM samples showed a broad line of absorption under the multiplet of Mn2+ lines,
centered at gca. 2.2, (Figures 1a and 1b). Those wide lines
occur due to the presence of paramagnetic metal ions, mainly trivalent iron ion clusters, or in concentrated domains,17-19,29,30
which absorb in that field region. For the NFS samples, the broad EPR Fe3+ lines are even broader for the deeper
layer samples. For the RFS samples, exception is made to the RFS5 and RFS6 samples that have no metal ions EPR signal in the entire spectrum. These samples correspond to the position of the retorted oil shale on the RFS soil column.
Considering this new methodology of complex soil material analyses, special care was observed, for the first time, according to our best knowledge, relative to the type of organic free radicals (OFR) species. Samples with higher concentration of OFR (spin g-1) are RFS5 and RFS6
(Table 2), indicating that the organic matter of samples richer in retorted oil shale shows low paramagnetic metal ion concentration to quenching OFR and possibly a high level of aromatic structures.
13C Nuclear magnetic resonance (NMR)
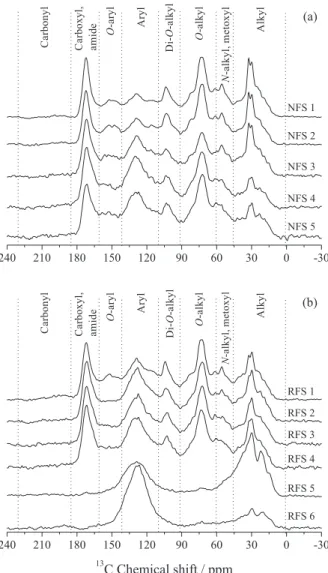
The 13C NMR spectra of the NFS and RFS samples are
shown in Figures 2a and 2b. The spectra show a trend of increased levels of aromatic structures (110-150 ppm) and a decrease of aliphatic structures (0-48 ppm) with soil depth. Samples RFS5 and RFS6 are obvious exceptions, indicating the recalcitrant character of their retorted oil shale origin. These samples also show significantly lower
levels of groups associated with lignin (O-aromatic,
140 to 150 ppm and methoxyl, 55 ppm), carbohydrates (O-alkyl and di-O-alkyl, 72 to 104 ppm) and carboxylic
(160 to 180 ppm).16 Similar to the EPR analyses, those
results indicate a greater contribution of fossil organic matter to the recuperated area.
Principal component analysis (PCA) from 13C NMR spectra
The first principal component (PC1) (Figure 3), calculated by PCA, accounted for 68% of the total variance and is characterized by positive loadings for the signals of alkyl groups (25, 30 and 32 ppm), O-alkyl and
di-O-alkyl (72 to 103 ppm,), methoxyl (55 ppm), N-alkyl
(60 ppm), O-aryl (142-160 ppm) and carboxyl (172 ppm).
The loadings of the PCA are the correlations between the original variables (spectra) and the principal components generated (Figure 3).
Figure 1. EPR spectra, at room temperature, in a field sweep of 500 mT, of (a) native forest soil (NFS) and (b) rehabilitated forest soil (RFS) samples at different depths (assignment see Table 1), after treatment with 10% aqueous HF solution.
Table 2. The number of spin per g and g factor values of the NFS and RFS samples, at different depths, treated with 10% aqueous HF solutions, calculated from the EPR spectra at the 5 mT range sweep of the magnetic field
Area Sample Number of spin
per g (× 1017) g factor
Native forest soil (NFS)
NFS1 1.04 2.0033
NFS2 0.93 2.0032
NFS3 1.00 2.0031
NFS4 1.28 2.0031
NFS5 1.15 2.0032
Oil shale industrialization rehabilitated forest soil (RFS)
RFS1 2.25 2.0031
RFS2 2.55 2.0030
RFS3 1.96 2.0031
RFS4 1.85 2.0032
RFS5 6.45 2.0030
The PC1 differentiated the samples RFS5 and RFS6 from the other ones (PC1 scores, Figure 4) mainly due to their lower content of the cellulose structure associates
(carbohydrates: 103 and 72 ppm - load PC1,) and to a lesser extent to partially oxidized cellulose (glucuronic acid: glucose partially oxidized to carboxylic acid: 172, 103 and 72 ppm) as well as other plant structures, such as lignin
(O-aryl around 155 ppm and methoxyl around 55 ppm);
protein (N-alkyl around 60 ppm); crystalline (32 ppm) and
amorphous (30 ppm) polymethylene and other alkyl groups.
The PC2 scores, that accounted for 17% of the total variance, separated mainly the more superficial (0-25 cm) samples of the native (NFS 1 and 2) from the other samples (Figure 4). These samples presented a lower content of aromatic structures partially oxidized (O-aryl around 160 ppm and carboxyl directly linked to
the aromatic structures around 166 ppm), and increased content of organic structures associated to recent plant material (cellulose/oxidized cellulose, lignin and long chain alkyl, both crystalline and amorphous). The PC1 and PC2 grouping of the deeper native forest samples with the ones from the recovered area, (except the deeper recovered samples RFS 5 and RFS6) indicates that the recovering was prone to reproduce the original soil, at least concerning the soil organic matter composition, except considering the homogenization of the soil profile (Figure 4). The higher content of oxidized aromatic structure can be a desired aspect since it is attributed to this kind of structure an important role to the high fertility and sustainability of this fertility in the “Terra Preta de Índios” soils, a very particular soil found in the Amazon basin.31
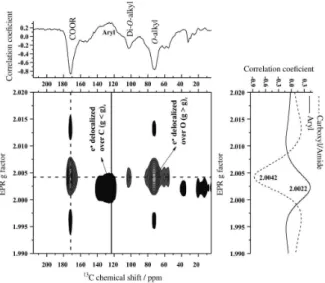
EPR and 13C NMR data correlations study
When correlating the results obtained by 13C NMR
(Figure 5) with the second derivative EPR spectra, it
Figure 2. 13C NMR spectra of (a) native forest soil (NFS) and
(b) rehabilitated forest soil (RFS) samples at different depths (assignment see Table 1), after treatment with 10% aqueous HF solution.
Figure 4. Scores of PCA from 13C NMR-TOSS spectra. PC1 and PC2:
principal components 1 and 2, respectively; NFS #: native forest soil; RFS #: rehabilitated forest soil; # soil depths (see Table 1).
Figure 3. Loadings of PCA from 13C NMR-TOSS spectra. PC1 and PC2:
is possible to observe a negative correlation between perpendicular VO2+ signal and uronic acid structures. and
in this case, the OFR signal presents an inverse correlation with the paramagnetic VO2+,25,26 indicating closer proximity
between VO2+ and the OFR.
The OFR signal is composed of at least two different paramagnetic species (Figure 6), one with g = 2.0042, that presents a negative correlation with the hydrophilic groups and the other with g = 2.0022, that presents a positive correlation with the aryl groups. In the first one,
the spin density is probably more localized on oxygen atoms (half-filled p orbital, g = 2.0042), and in the other, the spin density is probably localized on the carbon atoms (g = 2.0022).32 The negative correlation between the oxygen
delocalized OFR with hydrophilic groups reinforces the hypothesis of paramagnetic suppression.25,26
Conclusions
Independent from the results of techniques applied in this study, it is noted that most of the NFS and RFS samples of the soils down to 75 cm deep showed great similarities. However, the applied characterization techniques also revealed that the sample RFS5 and in particular RFS6 showed significant differences in relation to the soil samples from the NFS area and to the RFS samples of other depths as well.
The sample RFS6, which is composed mainly by retorted shale which is used for rebuilding the soil profile in the depth, is the sample in which the largest differences are observed compared to the other samples both of the NFS and the RFS areas. The RFS5 sample suffers the influence of the RFS6 sample being next to it (∆ = ± 25 cm).
Through the investigation of soil samples from RFS5 and RFS6, treated with aqueous solution of 10% HF followed by EPR and 13C NMR analysis, the influence of the
presence of retorted shale in these samples became evident. In the 13C NMR spectra, peaks of aromatic and alkyl groups
were dominant, indicating a strong contribution of fossil organic matter, present in the retorted shale. It is interesting to note that EPR lines of the OFR associated with oxygen were inversely correlated with the levels of VO2+ ions and
the hydrophilic organic structures, whereas the hydrophobic aromatic structures correlate positively with OFR associated with carbon atoms. This strongly suggests that VO2+ ions might bind to SOM through structures like that
of uronic acids and not only through functional groups like chatecol or salicylic acid as normally accepted.
Acknowledgements
The authors are grateful to the German and Brazilian government agencies, BMBF/IB-DLR, DQ/UFPR, INCT E&A, CNPq, FINEP, and FAPEG for financial support.
References
1. Pietrzykowski, M.; Krzaklewski, W.; Ecol. Eng. 2007, 30, 341. 2. Preston, C. M.; Dudley, R. L.; Fyfe, C. A.; Mathur, S. P.;
Geoderma. 1984, 33, 245.
3. Preston, C. M.; Soil Sci. 1996, 161, 144.
Figure 5. 2D Hetero-spectral 13C NMR and EPR (
∆B = 80 mT, g ca. 2, second derivative mode) correlation spectrum of the studied samples (vertical and horizontal dashed lines) are from carboxyl/amide (COOR) NMR region (172 ppm) and eight perpendicular EPR resonance lines of VO2+ (MI = 7/2), respectively.
Figure 6. 2D Hetero-spectral 13CNMR and OFR region EPR
(∆B = 5 mT and g ca. 2 region, second derivative mode) correlation
4. Novotny, E. H.; Knicker, H.; Colnago, L. A.; Martin-Neto, L.; Org. Geochem. 2006a, 37, 1562.
5. Smernik, R. J.; Oades, J. M.; Geoderma. 1999, 89, 219. 6. Smernik, R. J.; Oades, J. M.; Comm. Soil Sci. Plan. Anal. 2000,
31, 3011.
7. Senesi, N.; Anal. Chim. Acta 1990, 232, 77.
8. Piana, M. J.; Zahir, K. O.; J. Environ. Sci. Heal., Part B. 2000, 35, 87.
9. Jezierski, A.; Czechowski, F.; Jerzykiewcz, M.; Chen, Y.; Drozd, J.; Spectrochim. Acta, Part A 2000a, 56, 379.
10. Jezierski, A.; Czechowski, F.; Jerzykiewcz, M.; Drozd, J.; Appl. Magn. Reson. 2000b, 18, 127.
11. Novotny, E. H.; Martin-Neto, L.; Geoderma. 2002, 106, 305. 12. Tiseanu, C. D.; Kumke, M. U.; Frimmel, F. H.; Klenze, R.;
Kim, J. I.; J. Photochem. Photobiol., A 1998,117,175. 13. Gonçalves, C. N.; Dalmolin, R. S. D.; Dick, D. P.; Knicker, H.;
Klamt, E.; Kögel-Knaber, I.; Geoderma. 2003, 116, 373. 14. Rumpel, C.; Rabia, N.; Derenne, S.; Quenea, K.; Eusterhues, K.;
Kögel-Knaber, I.; Mariotti, A.; Org. Geochem. 2006, 37, 1437. 15. Pearson, R. G.; J. Am. Chem. Soc. 1963, 85, 3533.
16. Dick, D. P.; Gonçalves, C. N.; Dalmolin, R. S. D.; Knicker, H.; Klamt, E.; Kögel-Knaber, I.; Simões, M. L.; Martin-Neto, L.; Geoderma. 2005, 124, 319.
17. Guimarães, E.; Mangrich, A. S.; Machado, V. G.; J. Braz. Chem. Soc. 2001, 12, 734.
18. Lombardi, K. C.; Guimarães, J. L.; Mangrich, A. S.; Mattoso, N.; Abbate, M.; Schreiner, W. H.; Wypych, F.; J. Braz. Chem. Soc.
2002, 13, 270.
19. Lombardi, K. C.; Mangrich, A. S.; Wypych, F.; Rodrigues-Filho, U. P.; Guimarães, J. L.; Schreiner, W. H.; J. Colloid Interface Sci.2006, 295, 130.
20. Budziak, C. R.; Maia, C. M. B. F.; Mangrich, A. S.; Quim. Nova.
2004, 27, 399.
21. Fukamachi, C. R. B.; Wypych, F.; Mangrich, A. S.; J. Colloid Interface Sci. 2007, 313, 537.
22. Maia, C. M. B. F.; Piccolo, A.; Mangrich, A. S.; Chemosphere
2008, 73, 1162.
23. Lankes, U.; Lüdemann, H. D.; Frimmel, F. H.; Water Res. 2008, 42,1051.
24. Jung, Y. M.; Chae, J. B.; Yu, S. C.; Lee, Y. S.; Vib. Spectrosc.
2009, 51, 11.
25. Novotny, E. H.; Knicker, H; Martin-Neto, L.; Azeredo, R. B. V.; Hayes, M. H. B.; Eur. J. Soil Sci. 2008, 59, 439.
26. Novotny, E. H.; Hayes, M. H. B.; De Azevedo, E. R.; Bonagamba, T. J.; Naturwissenschaften2006b, 93, 447. 27. Bennett, A. E.; Rienstra, C. M.; Auger, M.; Lakshimi, K. V.;
Griffin, R. G.; J. Chem. Phys.1995, 103, 6951.
28. Lakatos, B.; Tibai, T.; Meisel, J.; Geoderma. 1977, 19, 319. 29. Schreiner, W. H.; Lombardi, K. C.; De Oliveira, A. J. A.;
Mattoso, N.; Abbate, M.; Wypych, F.; Mangrich, A. S.; J. Mag. Magn. Mater. 2002, 241, 422.
30. Balena, S. P.;Messerschmidt, I.; Tomazoni, J. C.; Guimarães, E.;
Pereira, B. F.; Ponzoni, F. J.;BlumW. E. H.; Mangrich, A. S.; J. Braz. Chem. Soc.2011, 22, 1788.
31. Novotny, E. H.; De Azevedo, E.; Bonagamba, T. J.; Cunha, T. J. F.; Madari, B. E.; Benites, V. M.; Hayes, M. H. B.; Environ. Sci. Technol. 2007, 41, 400.
32. Uesugi, A; Ikeya, M.; Jpn. J. Appl. Phys., Part 1 2001, 40, 2251.
Submitted: October 23, 2012
Published online: February 27, 2013