SOUTHERN HEMISPHERE ATMOSPHERIC BLOCKING DIAGNOSTIC BY ECMWF AND
NCEP/NCAR DATA
MONICA CRISTINA DAMIÃO MENDES, IRACEMA F. A. CAVALCANTI, DIRCEU LUIS HERDIES
Instituto Nacional de Pesquisas Espaciais, Centro de Previsão de Tempo e Estudos Climáticos (INPE/
CPTEC), Cachoeira Paulista, São Paulo, Brazil
monica.damiao@cptec.inpe.br; iracema@cptec.inpe.br; dirceu.herdies@cptec,.inpe.br
Received June 2011 – Accepted October 2011
ABSTRACT
An assessment of blocking episodes over the Southern Hemisphere, selected from the Era-40 and NCEP/NCAR reanalysis are presented in this study. Blocking can be deined by an objective index based on two 500 hPa geopotential height meridional gradients. The seasonal cycle and preferential areas of occurrence are well reproduced by the two data sets. In both reanalysis used in this study, South Paciic and Oceania were the preferred regions for blocking occurrence, followed by the Atlantic Ocean. However the results revealed differences in frequencies of occurrences, which may be related to the choice of assimilation scheme employed to produce the reanalysis data sets. It is important to note that the ERA 40 and NCEP/NCAR reanalysis were produced using consistent models and assimilation schemes throughout the whole reanalyzed period, which are different for each set. Keyword: blocking, reanalysis, extreme events
RESUMO: DIAGNÓSTICO DE BLOQUEIOS ATMOSFÉRICOS NO HEMISFÉRIO SUL COM REANÁLISES DO ECWMF E NCEP/NCAR
Neste artigo é apresentada uma comparação de episódios de bloqueio no Hemisfério Sul, obtidos das reanálises do ERA 40 e NCEP/NCAR. A deinição de bloqueio foi obtida a partir de um índice que se baseia em dois gradientes meridionais da altura geopotencial em 500 hPa. O ciclo sazonal e as áreas preferenciais de ocorrência são bem reproduzidos pelos dois conjuntos de dados. Em ambas as reanálises foi possível notar que o Pacíico Sul e Oceania são as regiões preferenciais de ocorrência de bloqueio, seguido pelo Oceano Atlântico. No entanto, os resultados revelaram diferenças nas frequências de ocorrências, que pode estar relacionada com a assimilação adotada para a produção de conjuntos de dados. É importante notar que os dados do ERA-40 e NCEP/NCAR são produzidos através de modelos consistentes e esquemas de assimilação ao longo do período, que são diferentes para cada conjunto.
Palavras chave: bloqueio, reanálises, eventos extremos
1. INTRODUCTION
Blocking events have large inluence on the weather and climate of some regions, since they are characterized by an abrupt change in the atmospheric low, affecting the normal passage of synoptic systems (Sinclair, 1996, Wiedenmann et al., 2002, Renwick, 2005). During their occurrence, the displacement of low pressure systems is disrupted, due to the presence of a quasi-stationary anticyclone of great magnitude. The movement of this anticyclone is relatively slow, remaining for several days over the same area. In the Southern Hemisphere
(SH), blockings are found preferable over regions of Australia and New Zealand, in central and eastern South Paciic and to the Southeastern of South America, moving slowly eastward, except when duration exceeds 10 days and an westward movement is noted (Lejenas, 1984). SH blocking presents a large seasonal variation, especially over western Paciic and Australian region (Lejenas, 1984), where the highest activity is found during winter and early spring (Marques, 1996; Damião 2007; Damião et al., 2005, 2008).
Figure 1 – Longitudinal distribution of the ive selected areas.
Ruthland and Fuenzelida, 1991) agree that blocking episodes predominantly occur over the Australian-New Zealand sector, followed by the Southeastern Paciic, with a considerably lower number of episodes occurring over the Southern Atlantic and the Indian Oceans. Those earlier studies had also considered the Paciic Ocean as a single sector, however after the work of Sinclair (1996), Marques (1996) and Renwick and Revell (1999), authors began considering to split off the Southern-Paciic Ocean into Southwestern and Southeastern sectors. To advance analysis on this subject, the objective of this article is to calculate a comprehensive 41-yr blocking climatology for the SH comparing information from the European Center for Medium Range Weather Forecasting (ECMWF) reanalysis (ERA40) and the National Centers for Environmental Prediction-National Center for Atmospheric Research (NCEP-NCAR) reanalysis including a blocking intensity analysis as discussed in the methodology. The present research examines intensity and frequency of anticyclone blocking events over the Southern Hemisphere. Firstly, a climatology of blocking episodes for the SH, between 1960 and 2000 based on data from NCEP-NCAR and ECMWF is constructed. Five contiguous areas of blocking activity are then considered: Southeastern Paciic, Southwestern Paciic, South Atlantic, Indian Ocean and Oceania (see Figure 1 on Section 2).
The datasets used in this study and the methodology employed to identify blocking episodes are introduced in Section 2. Section 3 describes the main characteristics of the blocking episodes and its intensity over the SH and presents the results when using the NCEP-NCAR and ECMWF reanalysis. Finally, the conclusions are presented in section 4.
2. DATA AND METHODOLOGY
This study focuses on comparing the total number of blocking events and its duration in days, identiied through daily 500 hPa geopotential heights over the Southern Hemisphere, between the ECMWF 41-year reanalysis (ERA-40) and the NCEP/NCAR reanalysis. On both cases, the blocking detection
and its intensity were obtained over an area comprising 180W-180E; 30S-60S. A modiied Tibaldi index (Damião et al., 2008) was used to construct a blocking climatology for the period of 1960-2000. It is important to note, that the NCEP-NCAR reanalysis has 2.5° latitude by 2.5° longitude spatial resolution, whereas the ECMWF reanalysis has 1.125° latitude by 1.125° longitude spatial resolution. Regriding using the GraDS analysis package was used to change the ECMWF (ERA-40) spatial resolution in latitude, from 1.125° to 2.5 °, in order to maintain the latitude patterns indicated in Equations 1 and 2, i.e., 40°S; 50°S; 55°S and 65°S. The main objectives of this work are fourfold as follows:
a) to develop a comprehensive 41-yr blocking climatology for the SH (Figure 1) using the circulation indices introduced by Tibaldi and Molteni (1990) and Tibaldi et al. (1994) for the NH, and recently adapted for the South Hemisphere by Damião et al. (2008);
b) to obtain an updated climatology of blocking episodes for the Southern Hemisphere, between 1960 and 2000 based on data from NCEP-NCAR and ECMWF (ERA40) reanalysis;
c) to compare blocking episodes over the Southern Hemisphere derived from the two abovementioned reanalysis;
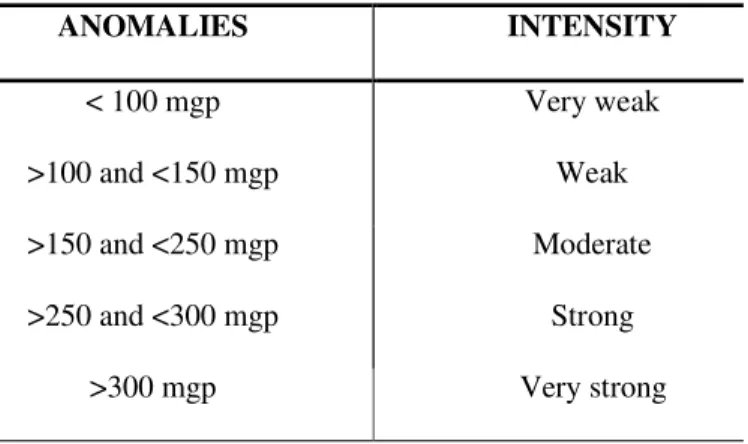
d) to compute a blocking intensity climatology using the criterion presented in Table 1.
ANOMALIES INTENSITY
< 100 mgp Very weak
>100 and <150 mgp Weak
>150 and <250 mgp Moderate
>250 and <300 mgp Strong
>300 mgp Very strong
(
) (
)
(
)
−(
)
= − = , , , , 01 02 Z Z GHGN Z Z GHGS N S φ λ φ λ φ λ φ λ (1) (2) (3) (4)The term “reanalysis” commonly refers to the processing of observational meteorological data by the use of a physical model, whereby the data are made physically consistent and interpolated to a 3-D grid. Recently, many studies showed that ECMWF and NCEP air temperature resemble each other quite well, with respect to a single grid point or spatial pattern, despite ECMWF being considered slightly better than NCEP, especially for variables such as precipitation, temperatures and wind (Bromwich and Fogt, 2004; Inoue and Matsumoto, 2004; Barradas and Nigam, 2005; Viale and Fernandez, 2006; Setzer and Kayano, 2009). This occur partly, due to NCEP’s coarser spatial resolution (T62 Gaussian grid points, about 2.5° latitude and 2.5° longitude) when compared to ECMWF (T156 Gaussian grid points, about 1.125° latitude and 1.125° deg longitude). Using the ECMWF (ERA40) reanalysis (Uppala 2002), a number of researchers (Bromwich and Fogt, 2004; Uppala et al., 2005; Wang et al., 2006) studied the interdecadal variations of the global circulation and the associated climate change. They compared their results with those derived from the NCEP/NCAR reanalysis, concluding that the ERA40 reanalysis results seem to be closer to the observations. It is important to note that the model assimilation systems used in ERA-40 and NCEP/NCAR reanalysis have several differences, in particular, with respect to the spatial resolution and the physical parameterizations (e.g. boundary layer, soil and surface luxes, radiation and clouds). In both cases the model orography uses the mean orography at the respective horizontal scales of about 125 km (ERA-40), and 210 km (NCEP/NCAR). The model used for the ERA-40 reanalysis also includes a parameterization for subgrid orographic variability. Further details about the models and assimilation schemes used for the ERA-40 and NCEP/NCAR reanalysis can be found in Uppala et al. (2005), and Kalnay et al. (1996) respectively.
The NCEP-NCAR reanalysis data were derived from a consistent assimilation and modeling procedure that incorporated all the available observed conditions obtained from conventional and satellite information (Kalnay et al., 1996). The numerical model used had T62 triangular truncation, with spatial resolution of approximately 210 km in the tropics, with 28 vertical levels, ive levels in the boundary layer and seven above 100 hPa. Additionally, the model includes parameterizations of physical processes such as shallow and deep convection, rainfall, radiation (with diurnal cycle) and interaction with clouds, boundary layer physics, surface hydrology (with 12 types of vegetation) and vertical and horizontal turbulent diffusion processes. While the assimilation system has been frozen throughout the whole reanalysis process, the observations database has undergone signiicant changes over the period simulated (White, 2000).
The ERA-40 project consists in a global atmospheric analysis of many conventional observations and satellite data streams for the period from September, 1957 to August, 2002. ERA-40 provides planetary boundary layer and stratospheric ields with higher horizontal and vertical resolutions than its predecessor ERA-15 reanalysis (Uppala et al., 2005). Additionally, ERA-40 introduced the inclusion of satellite data, radiosondes and pilot balloons in the assimilated data. More information about the quality and the assimilation processes involved in this analysis can be found in Kallberg et al. (2004).
The set of blocking diagnostics compiled in this study consists on the number of episodes, duration and location. Our study has been carried out using the “standard” methodology developed by Tibaldi et al. (1994), and recently refined by Damião et al. (2008) for the SH. Thereby, two 500 hPa geopotential height meridional gradients GHGS (south) and GHGN (north), extracted from daily geopotential data, are evaluated for 2.5º latitudes intervals (1.125°) over the entire SH retrieved from the NCEP/NCAR (ECMWF) data.
where
On the above expressions Z (l,f) is 500 hPa height at latitude f and longitude l Following the procedure developed by Tibaldi and Molteni (1990), a given longitude is deined as “blocked” at a speciic instant in time if the following conditions are satisied for at least one value of D:
GHGN > 0 GHGS < -10 m
A blocked sector, on a particular day, is identiied when three or more adjacent longitudes within a pre-deined large area are blocked (Trigo et al., 2004; Damião et al., 2008). This criterion is suficient to deine a local (spatial) blocking pattern. We have also adopted a threshold of ive consecutive blocked days (Trield et al., 1981; Dole, 1986; Tibaldi e Molteni, 1990; D’Andrea et al., 1998) to the circulation constraints deined by Equations 1 and 2, and criteria given by expressions 3 and
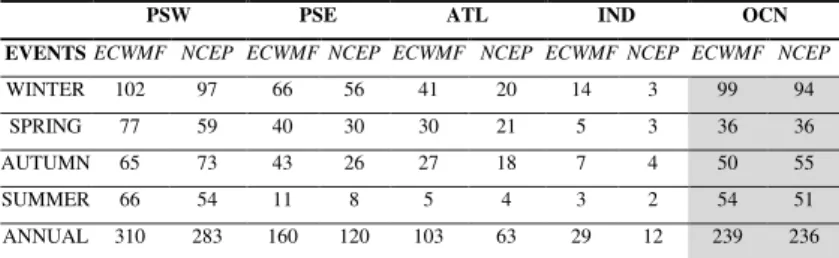
Table 2a- Total of seasonal blocking events, over the ive deined sectors: Southwestern Paciic (PSW), Southeastern Paciic (PSE), South Atlantic (ATL), Indian (IND) and Oceania (OCN).
PSW PSE ATL IND OCN
EVENTS ECWMF NCEP ECWMF NCEP ECWMF NCEP ECWMF NCEP ECWMF NCEP
WINTER 102 97 66 56 41 20 14 3 99 94
SPRING 77 59 40 30 30 21 5 3 36 36 AUTUMN 65 73 43 26 27 18 7 4 50 55 SUMMER 66 54 11 8 5 4 3 2 54 51
ANNUAL 310 283 160 120 103 63 29 12 239 236
Table 2b- Seasonal frequency of blocked days (%), over the ive deined sectors: Southwestern Paciic (PSW), Southeastern Paciic (PSE), South Atlantic (ATL), Indian (IND) and Oceania (OCN).
PSW PSE ATL IND OCN
EVENTS ECWMF NCEP ECWMF NCEP ECWMF NCEP ECWMF NCEP ECWMF NCEP
WINTER 26,37 24,52 15,85 11,90 7,82 3,76 2,00 0,42 21,87 21,47 SPRING 15,34 13,54 7,42 5,32 5,16 4,08 1,00 0,63 7,21 7,05 AUTUMN 15,72 17,41 9,14 5,03 4,98 3,73 1,06 0,55 11,69 9,67 SUMMER 14,66 10,56 2,16 1,59 0,84 0,65 0,67 0,37 10,16 9,86 ANNUAL 18,08 16,57 8,70 5,96 4,75 3,08 1,25 0,49 12,74 12,05
MEAN 18,02 16,50 8,64 6,01 4,70 3,05 1,20 0,51 12,72 12,01
Table 2c- Seasonal mean duration (days) of blocking events, over the ive deined sectors: Southwestern Paciic (PSW), Southeastern Paciic (PSE), South Atlantic (ATL), Indian (IND) and Oceania (OCN).South Atlantic (ATL), Indian (IND) and Oceania (OCN).
PSW PSE ATL IND OCN
EVENTS ECWMF NCEP ECWMF NCEP ECWMF NCEP ECWMF NCEP ECWMF NCEP
WINTER 8 9 7 6 6 5 5 5 6 7
SPRING 6 7 6 6 6 6 7 6 6 6
AUTUMN 7 8 6 6 6 6 5 5 7 6
SUMMER 7 6 6 7 5 5 7 7 6 7
ANNUAL 7 8 6 6 6 6 5 5 6 6
4. The blocking episodes, during the 41-year period (1960 to 2000), were identiied according to the rules established above (Equations 1 and 2) over ive contiguous sectors that cover the entire SH, shown in Figure 1 and listed as follows: (PSW) Southwestern Paciic (180°W to 120°W), (PSE) Southeastern Paciic (120°W to 80°W), (ATL) Southern Atlantic (80°W to 10°E), (IND) Indian (10°E to 100°E) and (OCN) Oceania (100°E to 180°E). These are the same areas analyzed by Damião et al (2008) and also in close agreement with those deined by other authors (Marques, 1996; Sinclair, 1996). Once after the blocking episodes are identiied, the extreme events are obtained based on the intensity of the 500 hPa geopotential anomaly in the center of the anticyclone blocking. The blocking events are considered extreme if the geopotential height anomalies extend from the lower to the higher levels of the atmosphere, with an equivalent barotropic structure following the 500 hPa anomalies shown in Table 1. Cases are selected whenever the 500 hPa geopotential height anomalies in the center of the anticyclone remain relatively constant for at least
5 consecutive days, with intensity classiied as strong or very strong. Is important to note, that the Indian sector shows low activity of the blocking, therefore, we will not discuss this area in the present study.
3. RESULTS
3.1 Seasonal variability
of blocking events lasted for 5 to 6 days for both datasets, and similar duration was also found in the Indian Ocean, although with a reduced number of cases. Over Southern Paciic and Oceania the blocking events duration was of 6 to 8 days. Overall, these results are in agreement with other authors that used similar methodology (Marques and Rao, 1999, 2000 and 2001; Damião et al., 2008) or different deinitions for blocking events (Renwick and Revell, 1999). In general a strong seasonal variation is found for both datasets (Table 2a), where the months of greater blocking occurrence were found during winter and beginning of spring (from June to September), coherently agreeing with previous studies (Marques, 1996; Damiao et al., 2008).
3.2 Standard features of blocking episodes
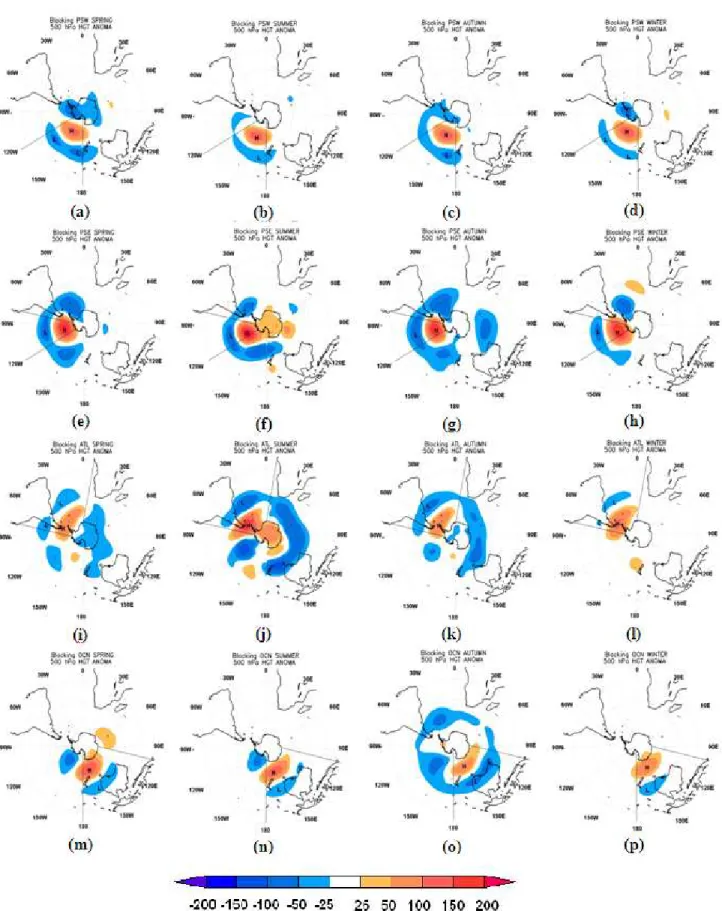
The standard features presented in this section were derived from the ECMWF datasets. They can be compared with NCEP/NCAR analyses made by Damião et al. (2008). The region of maximum blocking activity seems to be associated with the presence of maximum westerlies velocity over the Southern Paciic (polar jet) at high levels (Trenberth, 1984; Trenberth and Mo, 1985). The presence of blocking episodes is well deined, displaying positive anomalies of 500hPa geopotential height associated with a stationary anti-cyclonic blocking centered at about 60°S (Figure 2). Due to their persistence, blocking episodes tend to interrupt the trajectories of transient systems such as cold fronts and extratropical cyclones, favoring adverse meteorological conditions over the adjacent regions. When the transient systems approach the blocking region, they move on to the equatorial lank of the anomalous anticyclone (Figure 2), favoring adverse and persistent weather conditions in the adjacent areas. Blocking events in the Southeastern Paciic have a significant impact over the adjacent continental areas of South America (Figure 2e-2h). The South Atlantic blocking coniguration suggests a displacement of the jet stream northwards favoring persistent synoptic systems over Southern Brazil.
The negative anomalies of the 500 hPa geopotential height observed over South America (Figure 2i-2l), also facilitates the transport of dry and cold air from the pole towards lower latitudes. This pattern also resembles the transpolar index features (Pittock, 1980) which shows opposite signs between the regions south of South America and south of Australia. While the Southwestern Paciic blockings affect only New Zealand, the blocking episodes over Oceania affect both New Zealand and Australia (Figure 2a-2d and 2m-2p).
3.3. Blocking intensity
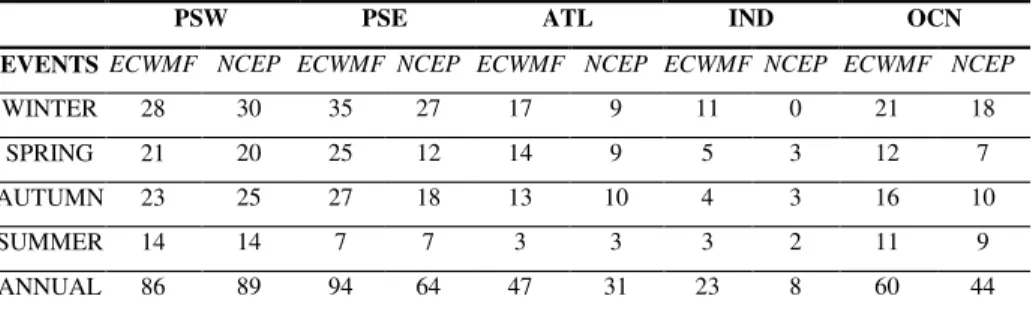
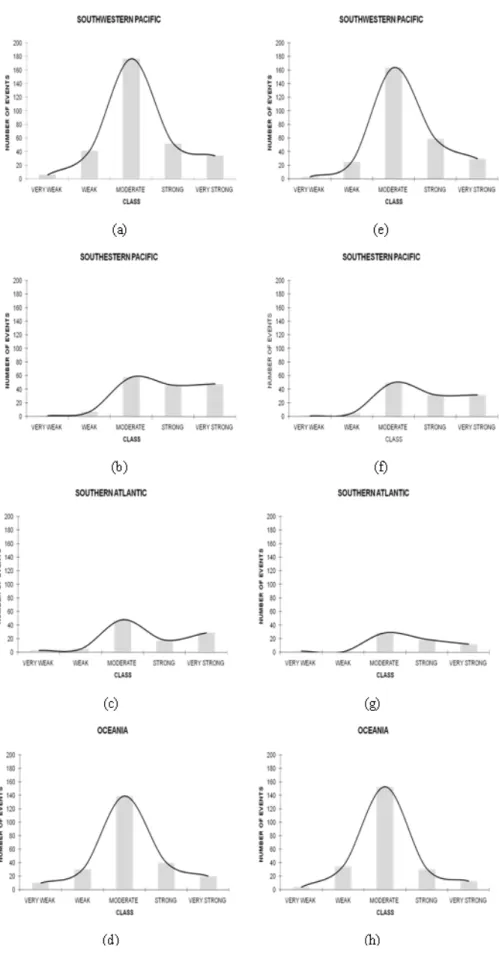
The frequency of blocking events, derived from the ECMWF and NCEP/NCAR reanalysis for the SH, were classiied according to its intensity (very weak, weak, moderate, strong, very strong) as presented in Figure 3. Generally, cases of moderate intensity, ranging between 150 and 250 mpg, are more frequent (Figure 3). The blocking intensity features are similar for Southern Paciic and Oceania for the two data series (Figure 3a-3h). Information from Figure 3 is that there are more “very strong cases” than “very weak cases”. Despite the blocking intensity calculation being different from those obtained from Wiedenmann et al. (2002), the results from this study could be successfully compared with their work. Table 3 shows the number of seasonal blocking events with “strong” and “very strong” intensity based on the ECMWF and NCEP/ NCAR reanalysis. In general, a higher frequency of “strong” and “very strong” blocking events is found in the ECMWF results. This result can also be found in the annual distribution, except to PWS (Table 3).
The number of extreme cases is greater during winter and lesser during summer, for both reanalysis. They are also more frequent over the Paciic Ocean. Both ECMWF and NCEP/NCAR present similar characteristics of the 500 hPa geopotential height over Southern Hemisphere. In particular, for the Southern Hemisphere, the two reanalysis are very similar and represent well the blocking timing and spatial conigurations. Although, the smoothing of ERA-40 ields from
PSW PSE ATL IND OCN
EVENTS ECWMF NCEP ECWMF NCEP ECWMF NCEP ECWMF NCEP ECWMF NCEP
WINTER 28 30 35 27 17 9 11 0 21 18
SPRING 21 20 25 12 14 9 5 3 12 7
AUTUMN 23 25 27 18 13 10 4 3 16 10
SUMMER 14 14 7 7 3 3 3 2 11 9
ANNUAL 86 89 94 64 47 31 23 8 60 44
Table 3 – Seasonal number of the strong/very strong blocking events, over the ive deined sectors: Southwestern Paciic (PSW), Southeastern
Figure 2 - Composites of 500 hPa anomalous geopotential height (shaded, mgp) using ECMWF data, for blocking episodes in the (a, e, i, m) spring,
(b, f, j, n) summer, (c, g, k, o) autumn, (d, h, l, p) winter. Blocking periods over (irst line) Southwestern Paciic, (second line) Southeastern Paciic,
Figure 3- Histogram of the blocking intensity the ECMWF (a, b, c, d) and NCEP (e, f, g, h) for ive areas: (a, e) Southwestern Paciic, (b, f
its original resolution (about 1.125° x 1.125°) to that of NCEP/ NCAR (2.5° x 2.5 °) may ilter out smaller scale systems, impacting on areas where sub-synoptic systems prevail, in the extratropical areas, some differences can be related to the original resolution, but cannot be entirely attributed to the different spatial resolution of the two geopotential ields. One possible explanation for the different blocking frequencies between the two datasets can be associated with short-term luctuations and the assimilation schemes adopted to produce the reanalysis products. Other interesting result refers to the distribution of the histogram: the East Paciic and Atlantic blocking areas don’t have a normal distribution, while the western Paciic sector does. This result may be due to the presence of the continental areas and the wavelength associated. The blocking events, over South Pacific, are associated with wavelength number 2 and 3 (Marques, 1996). Trenberth and Mo (1985) found a higher frequency of blocking in the region of New Zealand and in the Australia region, between August and September.
4. SUMMARY AND CONCLUDING REMARKS
In general, we noticed that the blocking conigurations for the four analyzed regions in both reanalysis (ECMWF and NCEP/NCAR) are similar. Positive anomalies of geopotential height at 500hPa were found in the blocking anticyclone sector, whereas negative anomalies are associated with low-pressure systems (storm-tracks) that occur in the periphery of the blocking area. These results are coherent with those exposed by other authors such as Marques and Rao (1999, 2000), Sinclair (1996) and Wiedenmann et al. (2002). Both sets present a large number of moderate blockings with respect to strong or weak classiication, and also show higher frequency of strong and very strong types during the winter.
There are small discrepancies in the number and frequency of blocking events and days in each dataset (ERA-40 showing larger numbers). The difference between the two sets is larger in PSE blockings, and smaller in the Indian Ocean and Oceania. When comparing the blocking intensity results shown in this study with those published previously by Wiedenmann et al. (2002), who used NCEP/NCAR reanalysis, we conclude that: despite the distinct methodologies, there is reasonable agreement between the results. Nonetheless, results show that the two datasets capture very well the blocking conigurations, but reveal differences in the number of occurrences, which may be related to the assimilation scheme adopted to produce the reanalysis and the resolution of each data series. It is important to note that the ERA-40 and NCEP/NCAR reanalyses were produced by consistent models and assimilation schemes throughout the whole reanalyzed period, which are different for each set.
5. ACKNOWLEDGEMENTS
This work was supported by FAPESP through project named Inluence of Antarctica Oscillation on atmospheric
blocking and perspective scenarios for the future (08/53662-2).
We thank NCEP/NCAR (National Centers for Environmental Prediction and National Centers for Atmospheric Research) and ECMWF (European Centre for Medium Range Weather Forecasts) for providing the reanalysis data. Dr. Iracema F. A. Cavalcanti and Dr. Dirceu L. Herdies also acknowledge CNPq for their research support.
6. REFERENCES
Barradas, A.R., Nigam, S. Warm season rainfall variability over the U.S, Great Plains in observations, NCEP and ERA-40 reanalysis, and NCAR and NASA atmospheric model simulations, Journal Climate, v. 18: 1808 – 1830, 2005. Bromwich, D.H., Fogt, R.L. Strong trends in the skill of the
ERA-40 and NCEP/NCAR Reanalysis in the high and middle latitudes of the Southern Hemisphere: 1958-2001, Journal of Climate, v. 17: 4603-4619, 2004.
Damião, M .C. M. Bloqueios Atmosféricos sobre o Hemisfério Sul: Diagnóstico, Impacto Climático e Mecanismos físicos associados, Tese de Doutoramento, Universidade de Lisboa, 250 pp, 2007.
Damião, M. C. M. et al. Bloqueios atmosféricos de 1960 a 2000 sobre o oceano Pacíico Sul: impactos climáticos e mecanismos físicos associados, Revista Brasileira de Meteorologia, v. 20: 175-190, 2005.
Damião, M. C. M, et al. Blocking Episodes in the Southern Hemisphere: Impact on the Climate of Adjacent Continental Areas, Pure and Applied Geophysics, 165: 1-22, 2008, (DOI 10.1007/s00024-008-0409-4).
D’andrea, et al. Northern Hemisphere atmospheric blocking as simulated by 15 atmospheric general circulation models in the period 1979-1988, Climate Dynamics, v. 14: 385-407, 1998.
Dole, R. M. Persistent anomalies of the extratropical Northern Hemisphere wintertime circulation: structure, Monthly Weather Review, v. 114: 178-207, 1986.
Inoue, T; Matsumoto, J. A comparison of summer sea level pressure over east Eurasia between NCEP/NCAR reanalysis and ERA-40 for the period 1960–1999, Journal of the Meteorological Society of Japan, v. 82, 951–958, 2004. Kalnay, E. et al. The NCEP/NCAR 40-years reanalysis project,
Bulletin of the American Meteorological Society, v. 77: 437-471, 1996.
Kayano, M. T; Kousky, v.. E. Southern hemisphere blocking: a comparison between two indices, Meteorology and Atmospheric Physics, v. 42: 165–170, 1990.
Lejenas, H. Characteristics of Southern Hemisphere blocking as determined from a long time series of observational data, Quarterly Journal of the Royal Meteorological Society, v.110: 967-979, 1984.
Marques, R. F. C. Bloqueio Atmosférico no Hemisfério Sul, Tese de Doutorado, Instituto Nacional de Pesquisas Espaciais, São José dos Campos. Brasil, 1996, INPE-6742-TDI/632. Marques, R. F. C; Rao, V. B. A diagnosis of a long-lasting blocking event over the Southeast Paciic Ocean, Monthly Weather Review, v. 127: 1761-1776, 1999.
Marques, R. F. C; Rao, V. B. Interannual variations of blocking in the Southern Hemisphere and their energetic, Journal of Geophysical Research, v. 105: 4625-4636, 2000.
Marques, R. F. C; Rao, V. B. A Comparison of Atmospheric Blocking over the Southeast and Southwest Paciic Ocean, Journal of the Meteorological Society of Japan, v. 79: 863-874, 2001.
Mo, K.C. Persistent anomalies of the Southern Hemisphere Circulation, In preprints from the irst international conference on Southern Hemisphere Meteorology, São José dos Campos, American Meteorological Society, 70-72, 1983.
Pittock, A. B. Patterns of climatic variation in Argentine and Chile-I: precipitation, 1931-1960, Monthly Weather Review, v. 109, 1347-1361, 1980.
Renwinck, J. A. Persistent positive anomalies in the Southern Hemisphere circulation, Monthly Weather Review, v. 133: 977-988, 2005.
Renwinck, J. A; Revell, M. J. Blocking over the south Paciic and Rossby wave propagation, Monthly Weather Review, v. 127, 1999.
Ruthlant, J; Fuenzalida, H. Synoptic aspects of the central Chile rainfall variability associated with the Southern Oscillation,International Journal of Climatology, v. 11: 63-76, 1991.
Sinclair, M. R. A. Climatology of anticyclones and blocking for the Southern Hemisphere, Monthly Weather Review, v. 124: 245-263, 1996.
Setzer, A.W; Kayano, M. Reanálises para altas latitudes no Hemisfério Sul: uma fonte de interpretações errôneas, Revista Brasileira de Meteorologia, v. 1, p. 00, 2009.
Tibaldi, S; Molteni, F. On the operational predictability of blocking, Tellus, 42A: 343-365. 1990.
Tibaldi, S. et al. Northern and Southern hemisphere seasonal variability of blocking frequency and predictability, Monthly Weather Review, v. 122: 1971-2003, 1994. Trenberth, K. E. Interannual variability of the Southern
Hemisphere Circulation, Representative ness of the year of the Global Weather Experiment, Monthly Weather Review, v. 112: 108-123, 1984.
Trenberth, K. E; Mo, K. C. Blocking in the Southern Hemisphere, Monthly Weather Review, v. 113: 3-21, 1985. Treidl, R. A; Birch, E. C; Sajecki, P. Blocking action in the
Northern Hemisphere: a climatological study, Atmosphere-Ocean, v. 19: 1-23, 1981.
Trigo, R. M. et al. “Winter blocking episodes in the European-Atlantic setor: Climate impacts and associated physical mechanisms in the Reanalysis”, Climate Dynamics, v. 23: 17-28, 2004.
Uppala, S. M. ECMWF reanalysis 1957-2001, ERA-40
Project Report Series 1, ECMWF, Reading, UK, 62
pp, Reading RG2 9AX, 2002.
Uppala, S. M. el at. The ERA-40 re-analysis, Quarterly Journal of the Royal Meteorological Society, v. 131:
2961-3012. DOI: 10.1256/qj.04.176, 2005.
Viale, M;Fernandez, A. E. Comparation of the reanalysis “ERA-40” and the reanalysis “NCEP/NCAR” with the radiosondes over Argentina and Chile, Proceedings of 8 ICSHMO, Foz do Iguaçu, Brazil, April 24-28,
63-69 pp, 2006.
Wang, S. W., et al.: Climatology and Changes of
Extratropical Cyclone Activity: Comparison of ERA-40 with NCEP-NCAR Reanalysis for 1958-2001,
Journal of Climate, v. 13: 3145-3166, 2006.
White, G. Long-term trends in NCEP/NCAR Reanalysis, Proc 2nd Int Conf on Reanalyes, Reading, United Kingdom, World Meteorological Organization, Geneva Switzerland. WCRP-109 (WMO/TD985), 54-57, 2000.