TRENDS IN TEMPERATURE AND GROWING SEASON LENGTH IN IDAHO-USA DURING
THE PAST FEW DECADES
CARLOS ANTONIO COSTA DOS SANTOS
1, TANTRAVAHI VENKATA RAMANA RAO
1,
RICARDO ALVES DE OLINDA
2¹Universidade Federal de Campina Grande, Unidade Acadêmica de Ciências Atmosféricas,
Campina Grande, PB, Brasil
2
Universidade Estadual da Paraíba, Departamento de Estatística, Campina Grande, PB, Brasil
[email protected], [email protected], [email protected], [email protected],
Received July 2013 - Accepted 1 March 2015
ABSTRACT
This study attempts to provide new information on seasonal and annual trends, on a regional scale, using records of daily air temperature over Idaho, USA, through the analysis of the Growing Season Length (GSL), and maximum and minimum air temperature data from multiple stations in the region, as well as, to obtain the temporal correlation between the daily air temperature and Sea Surface Temperature (SST) indices. The analyses were conducted using long-term and high quality data sets for 35 meteorological stations for the period between 1970 and 2006. The results suggest that both daily maximum and minimum temperatures had increasing trends, but the minimum air temperature is increasing faster than the maximum air temperature. On average, the GSL has increased by 7.5 days/ decade during the period 1970–2006, associated with increasing temperatures. Trends in regional air temperature and their indication of climate change are of interest to Idaho and the rest of the world. The trends obtained herein corroborate with the general idea that during the last century the globe has warmed.
Keywords: Climate change; sea surface temperature; global warming; environmental impact; agriculture
RESUMO: TENDÊNCIAS DA TEMPERATURA E COMPRIMENTO DA ESTAÇÃO DE CULTIVO EM IDAHO-EUA DURANTE AS ÚLTIMAS DÉCADAS
Este estudo pretende fornecer novas informações sobre as tendências sazonais e anuais, em uma escala regional, utilizando os registros de temperatura do ar diária sobre Idaho, EUA, através da análise da GSL, e os dados de temperatura do ar máximos e mínimos para várias estações da região, bem como, obter a correlação temporal entre os índices de temperatura do ar diária e temperatura da superfície do mar (TSM). As análises foram realizadas utilizando um conjunto de dados de alta qualidade e de longo prazo para 35 estações meteorológicas no período entre 1970 e 2006. Os resultados sugerem que ambas as temperaturas diárias mínimas e máximas tem demonstrado tendências crescentes, mas a temperatura mínima está aumentando mais rapidamente do que a temperatura máxima. Em média, o Comprimento do Crescimento Sazonal (GSL, sigla em inglês) aumentou em 7,5 dias/década, durante o período de 1970-2006, associado ao aumento das temperaturas do ar. As tendências regionais na temperatura do ar é suas indicações da mudança no clima são de interesse para Idaho e o demais regiões do planeta. As tendências obtidas corroboram a idéia geral de que, durante o século passado, o globo se aqueceu.
1. INTRODUCTION
Studies show increasing evidences of changes in air temperatures and thus the growing season length (GSL) has been extended during the 20th century, beyond doubt, for most of the Northern Hemisphere (Frich et al., 2002; IPCC, 2007; Song et al., 2010). Evidences of the increase in GSL have been noted in the late 20th century through satellite data, and phonological and meteorological observations (Linderholm, 2006). The GSL variability appears as an important indicator of climate change. Some studies show an association between air temperature and variations in the timing and amplitude of the seasonal cycle of atmospheric CO2 and the extension of
the growing season (Keeling et al., 1996). Myneni et al. (1997) showed that increases in the photosynthetic activity of terrestrial vegetation, as seen in satellite data, have also been associated with the lengthening of the growing season.
IPCC (2007) afirms that the projected climate change would further increase GSL. Thus, in some areas, such as high northern latitudes, an increased GSL together with a warmer climate could have a positive effect on crop production and possibly increase the harvests and seasonal yields. It can also create favorable conditions for growing fruits and vegetables (ACIA, 2004; Song et al., 2010).
White et al. (1999) afirm that persistent increases in the GSL may lead to long-term increases in carbon storage, because GSL variability is one of the driving mechanisms behind seasonal and annual luctuations in the uptake of CO2
in northern forests (Barford et al., 2001). However, some studies show that these positive effects may be counteracted by negative effects on ecosystems, such as extension of species range boundaries by establishment of new local populations causing extinction of former populations, increased risk of ozone damages (Karlsson et al., 2007) and progressive decoupling of species interaction (e.g. plants and pollinators) because of out-of-phase phenology (Hughes, 2000; Penuelas and Filella, 2001).
The mountain ranges over the western United States have a marked inluence on the climate of Idaho. Also, the climate features of Idaho are determined by its distance from the Equator, elevation above sea level, and distance from the Paciic Ocean. The economy of Idaho relies heavily on the water supply, of which the majority comes from winter precipitation (Harshburger et al., 2002). Most of Idaho’s winter precipitation is stored as snow at high elevations and contributes to streamlow during the spring season. According to Harshburger et al. (2002) the winter precipitation and consequent spring streamlow have experienced large interannual and decadal variations. Abatzoglou (2011) shows that the climate variability across the Western US is dominated
by a set of spatially ixed, recurrent perturbations to the large-scale low ield spanning decadal (Paciic Decadal Oscillation, PDO), interannual (El Niño-Southern Oscillation, ENSO) and intramonthly (Paciic-North American pattern, PNA) timescales. In order to gain an understanding of Idaho climate, a study using weather station data to analyze the local climate variability of air temperature is warranted to establish which areas of this region are being more affected by the possible global warming.
Studies show increasing evidences of changes in air temperatures and thus the Growing Season Length (GSL; freeze-free period). The spatial variations of the GSL are also considerable in many areas, ranging from approximately 200 days to 125 days. A few high valleys have no month without freezing temperatures and the land is used entirely for grazing (WRCC, 2011). To Robeson (2002) systematic changes and natural variations in GSL have important implications for natural and managed ecosystems, because many plants and insects are sensitive to the duration of the extreme cold events. Idaho has large areas of both irrigated and non-irrigated farmland. At some of the higher elevations in the eastern part of the State, the land is used primarily for livestock ranches and wheat farms. At lower elevations, the principal crops cultivated are: potatoes, beans, sugar beets, alfalfa, onions, lettuce, spring wheat, various seed crops, cherries, prunes, peaches, and apples. All contribute to the area’s agricultural income. Dairy products also constitute an important part of the area’s output (WRCC, 2011). Approximately two million acres of forest lie within the eastern part of the State, mostly in the higher mountainous areas. The southwestern portion of the State has a greater forested area, running into several million acres. The northern part of Idaho, because of its higher annual precipitation, is more thickly forested than the southern portion of the State. Thus, due to the importance of Idaho to the economy of USA (especially, the Northwestern region) and because the climate has strong inluence on its agricultural activities, it is evident the need of information about the extreme climate behavior over Idaho.
2. MATERIAL AND METHODS
2.1 Data and Quality Control
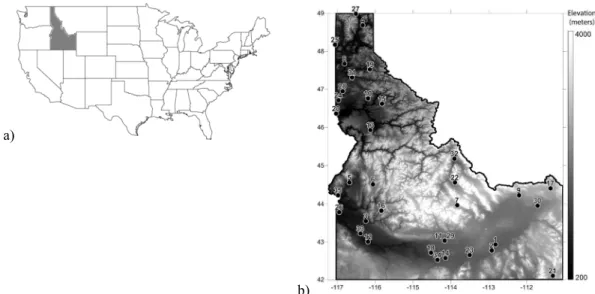
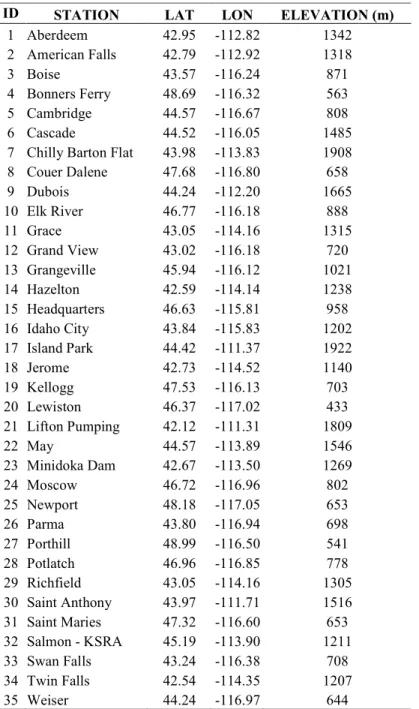
Daily maximum and minimum surface air temperatures data were taken from 35 meteorological (weather) stations across Idaho, USA, between 41 - 49º N latitude and 109 - 118º W longitude for the period between 1970 – 2006. This period has been chosen because it characterizes a fairly long-term dataset for each station. The map of station locations and elevations is shown in Figure 1; the numbers indicating the stations with their names and coordinates is shown in Table 1. The dataset was provided by National Climatic Data Center. The data of SST and its anomalies were provided by National Oceanic & Atmospheric Administration (NOAA) through the website (http://www.esrl.noaa.gov/psd/data/climateindices/).
An exhaustive data quality control was conducted because indices of extremes are sensitive to changes in station location, exposure, equipment, and observer practices (Haylock et al., 2006). Data Quality Control (QC) is a prerequisite for determining climatic indices. The quality control in this study has been done: 1) replacing all missing values (currently coded as -99.9) into an internal format that the software used (RClimdex) recognizes, and 2) Replacing all unreasonable values. Those values include daily maximum air temperature less than daily air minimum temperature. In addition, the QC also identiied outliers in daily maximum and minimum air temperatures. The outliers are daily values outside a range deined by the user. Currently, this range is deined as 4 times standard deviation (sdt) of the value for the day, that is, (mean – 4
x std, mean + 4 x std), where std for the day and 4 is the input from the user (Zhang and Yang, 2004; Vincent et al., 2005). Initially, data from 60 meteorological stations were available, and after the QC, only stations with less than 10% of missing data for a period of at least 30 years were considered, resulting in the 35 weather stations used in this analysis (Table 1).
2.2. Methodology
The RClimdex software developed by Xuebin Zhang and Feng Yang from Canadian Meteorological Service (Zhang and Yang, 2004) was used in this study to obtain the air temperature extremes indices, following methodologies of Zhang et al. (2005) and Haylock et al. (2006). In order to run the RClimdex software, the format of the input data ile has several requirements: 1) ASCII text ile; 2) Column sequence: Year, Month, Day, TMAX, and TMIN. (NOTE: Temperature units = degrees Celsius); 3) the format as described above was space delimited (e.g. each element was separated by one or more spaces); 4) for data records, missing data were coded as -99.9 and data records were in calendar date order (Zhang and Yang 2004). RClimdex provided 10 extreme climate indices, but only four (Tmax, Tmin, DTR and GSL) were chosen for discussion here (Table 2), because they better explain the goals of this study. The resulting series were analyzed through trends. The slopes of the seasonal and decadal trends of the air temperature indices were calculated based on a least square linear itting. Trends were obtained for each index at the 35 locations and the statistical signiicance of the trends were assessed through the Student’s t-test and the number of degrees of freedom was
a)
b)
Table 2 - Deinition of extreme air temperature indices used in this study.
Indices Name Definition Units
Tmax Max Tmax Monthly maximum value of daily maximum temp
ºC
Tmin Min Tmin Monthly minimum value of daily minimum temp
ºC
DTR Diurnal Temperature Range Monthly mean difference between TX and TN
ºC
GSL Growing Season Length Annual (1st Jan to 31st Dec) count between first span of at least 6 days with mean temperature >5 ºC and first span after July 1 of 6 days with mean temperature <5 ºC
Days
ID STATION LAT LON ELEVATION (m)
1 Aberdeem 42.95 -112.82 1342
2 American Falls 42.79 -112.92 1318
3 Boise 43.57 -116.24 871
4 Bonners Ferry 48.69 -116.32 563
5 Cambridge 44.57 -116.67 808
6 Cascade 44.52 -116.05 1485
7 Chilly Barton Flat 43.98 -113.83 1908
8 Couer Dalene 47.68 -116.80 658
9 Dubois 44.24 -112.20 1665
10 Elk River 46.77 -116.18 888
11 Grace 43.05 -114.16 1315
12 Grand View 43.02 -116.18 720
13 Grangeville 45.94 -116.12 1021
14 Hazelton 42.59 -114.14 1238
15 Headquarters 46.63 -115.81 958
16 Idaho City 43.84 -115.83 1202
17 Island Park 44.42 -111.37 1922
18 Jerome 42.73 -114.52 1140
19 Kellogg 47.53 -116.13 703
20 Lewiston 46.37 -117.02 433
21 Lifton Pumping 42.12 -111.31 1809
22 May 44.57 -113.89 1546
23 Minidoka Dam 42.67 -113.50 1269
24 Moscow 46.72 -116.96 802
25 Newport 48.18 -117.05 653
26 Parma 43.80 -116.94 698
27 Porthill 48.99 -116.50 541
28 Potlatch 46.96 -116.85 778
29 Richfield 43.05 -114.16 1305
30 Saint Anthony 43.97 -111.71 1516 31 Saint Maries 47.32 -116.60 653 32 Salmon - KSRA 45.19 -113.90 1211
33 Swan Falls 43.24 -116.38 708
34 Twin Falls 42.54 -114.35 1207
35 Weiser 44.24 -116.97 644
obtained based on the length of the data set, i.e., 37 years for the 1970-2006 (Haylock et al., 2006; Dufek and Ambrizzi, 2008). Monthly values were averaged to obtain seasonal values. Seasons have been considered as follows: winter = December– February; spring = March–May; summer = June–August; and fall = September–November.
Linear trend analyses were performed for the air temperature indices used in this study. The slopes of the linear trends are calculated by least squares itting. Since a normal frequency distribution may not necessarily it very well to indices data, a non-parametric Mann-Kendall test (Sneyers, 1990) is used to identify whether or not trends are signiicant. The method is simple and robust, and it also has the advantage of being able to deal with missing values.
The null hypothesis (H0) states that the deseasonalized data (x1, x2,…, xn) is a sample of n independent and identically distributed random variables. The null hypothesis that standard normal variable (Zc)is not statistically signiicant or has no signiicant trend is accepted if −Z1−p/2 ≤ Zc≤ Z1−p/2, where Z1−p/2
is the standard normal deviate and p is the signiicance level
for the test. Or, Zcis statistically signiicant if Zc < −Z1−p/2 or if Zc > Z1−p/2 (Partal and Kahya, 2006). Kendall’s statistic (S)is
computed as follows:
The variance of S is given by
where, xj, xkare sequential data values; n is the length of the dataset; m is the number of tied groups; and eiis the size of the ith tied group. Zcis obtained as follows:
Positive values of Zcindicate increasing trends while negative Zc shows decreasing trends. When testing either increasing or decreasing monotonic trends at a signiicance level p, the null hypothesis was rejected for absolute value of
Zcgreater than Z1-p/2 (Partal and Kahya, 2006). In this study, signiicance level p of 0.05 is applied.
The spatial distribution of the indices decadal trends was represented using the symbols (▲) for positive trends,
and (▼) for negative trends, statistically signiicant at 95% level, i.e. p<0.05. The representation of the trends which are statistically non-signiicant at the 95% level used the symbols (Δ) for positive trends, and (s) for negative trends.
To verify the correlation between the air temperature indices and SST variables, Spearman correlation coeficient (r) at a signiicance level of 5% (p<0.05) were computed. The Spearman correlation coeficient is a measure of non-parametric correlation. It is different of the Pearson correlation coeficient because does not require the assumption of linearity between variables. Thus, it is not sensitive to asymmetries in the distribution or the presence of outliers, not demanding, that data come from two normal populations. The statistically signiicant tests for correlations were performed using a two-tailed Student’s t test. The degree of freedom was calculated by subtracting the total sample size minus 2.
3. RESULTS
Table 3shows the decadal trends of the extreme indices of air temperature in Idaho for 35 weather stations. The highlighted values represent signiicant level of 5% (p<0.05). The discussions presented in this study are only for those trends that showed signiicant level. The daily maximum temperature (Tmax) index presented 11 stations with positive trends and 3 stations with negative trends, showing a predominant increase in the value of daily maximum temperature in the southern region of Idaho (Figure 2a). The daily minimum temperature (Tmin) index presented predominant positive trends (25 stations), indicating that the minimum temperature is also increasing in this region (Figure 2b). These results show an unfavorable situation because the water to human consumption and agriculture in Idaho is provided by the snow on the mountains and with the air minimum temperature increasing the melting will be accelerated hindering the water management in the State, as well as, if these trends continue, the evapotranspiration rate will increase signiicantly. The increase of the air temperature in the study area was also previously identiied by Karl et al. (1996), Alexander et al. (2006) and Meehl et al. (2009). Sohrabi et al. (2013) remember that one of the important questions is how these trends are going to evolve in the future due to climate change and variability.
In addition, Diurnal Temperature Range(DTR) index shows negative trends at 12 stations and positive trends at 8 stations (Figure 2c), indicating that the monthly mean difference between maximum and minimum temperature is decreasing in the northern part of the studied area. These results are in agreement with the results obtained for Tmax and Tmin indices and are similar to the results obtained by Alexander et al. (2006) and Sohrabi et al. (2013). These results are also in concordance
∑
∑
+ = − = − = n k j k j n k x x S 1 1 1 ) sgn( (1) 18 ) 5 2 )( 1 ( ) 5 2 )( 1 ( )var(
∑
=1+ − − + − = m i i i
i e e
e n n n S (2) ) var( 1 S S
Zc= − (S > 0)
0
=
c
Z (S = 0)
) var( 1 S S Zc +
= (S < 0)
with Folland et al. (2001) showing that the minimum temperature increased faster than the minimum temperature over global land areas since 1950, resulting in a broad decline in the DTR. These changes can be associated with changes in cloud cover, precipitation, soil moisture and atmospheric circulation. Also these indings are in general agreement with a number of recent regional-analyses, which documented increases in maximum and minimum air temperatures and decreases in the DTR during the recent decades as presented in Vose et al. (2005).
Many studies have reported both increases and decreases in the GSL, depending on location and period of record. However, more recent studies suggest that along with increasing temperatures, the GSL has been extended during the 20th century for most of the Northern Hemisphere (Frich
et al., 2002; Robeson, 2002; Menzel et al., 2003; IPCC, 2007). Satellite data and phenological and meteorological observations indicated the lengthening of the growing season, most notably in the late 20th century (Linderholm, 2006). The GSL variability is an important indicator of climate change. Keeling et al. (1996) showed an association between temperature and variations in the timing and amplitude of the seasonal cycle of atmospheric CO2, where an increase in the annual amplitude of the seasonal
CO2 cycle since the early 1960s was linked to a 1-week
extension of the growing season. In addition, increases in the photosynthetic activity of terrestrial vegetation from 1981 and onwards, as seen in satellite data, have also been associated with the lengthening of the growing season (Myneni et al., 1997). In this study, the GSL index has shown increasing trends in almost Table 3 - Decadal trends of the extreme indices of air temperature for Idaho, USA. The highlighted values represent signiicance at 5% level (p<0.05).
STATION Tmax
(ºC/10 yr)
Tmin (ºC/10 yr)
DTR (ºC/10 yr)
GSL (days/10 yr)
Aberdeem 0.60 1.74 0.54 7.02
American Falls -0.46 1.22 0.00 5.12
Boise 0.45 2.57 -0.09 -3.67
Bonners Ferry -0.17 1.16 -0.26 8.47
Cambridge 0.95 1.53 -0.14 4.58
Cascade 0.17 1.23 0.26 -2.63
Chilly Barton Flat 0.86 2.07 0.02 2.01 Couer Dalene -0.75 3.35 -0.77 1.83
Dubois 0.58 1.60 0.37 7.02
Elk River -0.60 1.32 -0.40 5.18
Grace 1.61 1.60 0.68 7.56
Grand View -0.22 1.93 -0.59 -3.90
Grangeville -0.02 1.62 -0.36 8.71
Hazelton 0.59 1.70 -0.15 5.05
Headquarters -0.36 0.92 -0.33 3.75
Idaho City 0.46 0.87 0.22 1.20
Island Park 0.22 2.19 0.24 6.46
Jerome 0.43 1.69 0.24 0.35
Kellogg -0.52 1.43 -0.31 1.53
Lewiston 0.10 1.54 -0.09 0.02
Lifton Pumping 0.65 1.21 0.38 4.45
May 0.27 1.50 0.08 7.13
Minidoka Dam 0.97 1.80 0.44 3.87
Moscow 0.09 1.64 0.24 8.93
Newport -0.07 2.12 -0.07 1.78
Parma 0.10 2.45 -0.25 -2.66
Porthill 0.29 1.61 0.15 6.13
Potlatch 0.17 2.55 -0.25 6.51
Richfield 1.37 1.34 0.01 7.68
Saint Anthony 0.64 2.37 0.43 4.61
Saint Maries -0.67 1.30 -0.53 3.16
Salmon – KSRA -0.32 2.22 -0.41 5.23
Swan Falls 0.30 1.71 -0.19 -3.82
Twin Falls 0.35 1.39 0.09 5.11
the entire State (Figure 2d), except to ive stations located in the southwestern portion of Idaho. These results corroborate with previous studies of Frich et al. (2002), Robeson (2002), Menzel et al. (2003) and IPCC (2007) which identiied an extension of the GSL during the 20th century for most of the Northern Hemisphere. It is interesting to evidence that how the maximum and minimum air temperatures have shown increasing trends, elevated evapotranspiration rate are expected during the growing season. This scenario indicates that the irrigation activities during the growing season will contribute to the water losses (Sohrabi et al., 2013). In some areas, such as high northern latitudes, an increased GSL together with a warmer growing season could have a positive effect on crop production and possibly increase the harvests and seasonal yields. Thus, this
predominant increase of the GSL for Idaho is important for its economy, because longer growing seasons can be particularly beneicial for perennial crops (alfalfa and other hay crops) which are important cultivated crops in the study area. Additionally, persistent increases in the GSL may lead to long-term increases in carbon storage, provided that GSL variability is one of the driving mechanisms behind seasonal and annual luctuations in the uptake of CO2 in northern regions (Barford et al., 2001;
Song et al., 2010).
To assist with the interpretation of igures that involve analyses of temperature extremes indices, the percentage of stations with statistically signiicant and insigniicant trends at the 5% level were calculated and are shown in Table 4. It can be observed that 35.3% in Tmax, and 71.4% in Tmin, indicating an Figure 2 - Spatial distribution of annual temperature extreme trends for Idaho, USA. The symbol (▲) means positive trends, and (▼) means negative
trends, statistically signiicant at 5% level (p<0.05), while the symbols (Δ) means positive trends, and (Δ) means negative trends statistically
non-signiicant. (a) Tmax index, (b) Tmin index, (c) Diurnal Temperature Range (DTR) index and (d) GSL index.
a) b)
a) b)
c) d)
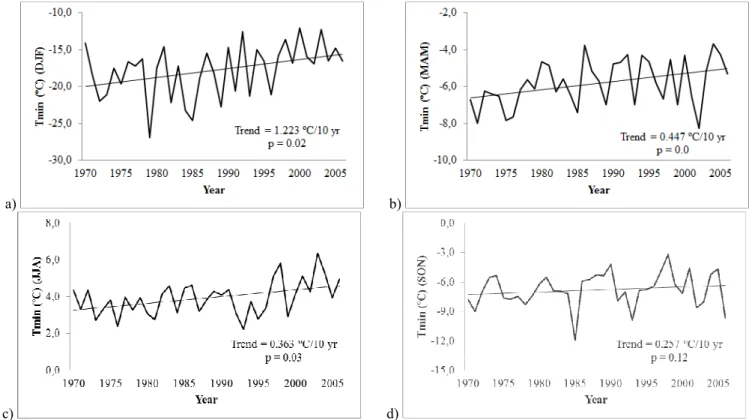
Figure 3 - Temporal distribution of seasonal minimum air temperature (Tmin) for Idaho, USA. (a) DJF (Winter), (b) MAM (Spring), (c) JJA (Summer) and (d) SON (Fall).
Table 4 - The percentage of stations showing signiicant and not signiicant trends at the 5% level for the temperature indices for Idaho, USA.
INDICE
Positive significant trend
(%)
Positive not significant trend
(%)
Negative significant trend
(%)
Negative not significant trend
(%)
Tmin 71.4 28.6 0.0 0.0
Tmax 34.3 34.2 8.6 22.9
DTR 22.9 25.7 34.3 17.1
GSL 28.6 57.1 0.0 14.3
increase of temperature. While there is a signiicant decrease of 34.3% in DTR, indicating a decrease in these indices, consistent with the results previously showed. About 29% of the stations have shown increasing trends in the GSL as observed by Frich et al. (2002), Linderholm (2006) and IPCC (2007).
Figures 3 to 5 show the seasonal behavior of the averaged Tmin (Figure 3), Tmax (Figure 4) and DTR (Figure 5) indices for Idaho and the statistical signiicance of the seasonal trends has been analyzed by using Mann-Kendall test. In Figure 3, the winter, spring and summer seasons presented statistical signiicance at 5% level trends of 1.223 °C/10 year, 0.447 °C/10 year and 0.363 °C/10 year, respectively, and the fall season showed a non-statistical signiicant decadal trend of 0.257 °C/10 year for the minimum air temperature. These results suggest that the minimum air temperature has increased in all the seasons, but the most important Tmin increase was detected in winter.
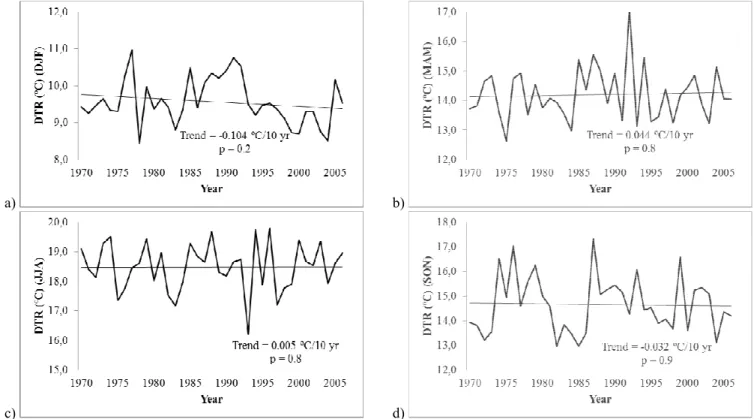
However, according with Figure 4, only the spring has shown statistically signiicant increase in the maximum air temperature evidencing that this parameter presents more spatial variation. No signiicant seasonal trend is observed in Figure 5, i.e. the diurnal temperature range has high spatial variability, due to the behavior of the Tmax.
a) b)
c) d)
Figure 5 - Temporal distribution of seasonal Diurnal Temperature Range (DTR) for Idaho, USA. (a) DJF (Winter), (b) MAM (Spring), (c) JJA (Summer) and (d) SON (Fall).
a) b)
c) d)
western United States is strongly inluenced by such natural climate variations as the ENSO and the PDO and these modes of variability affect strongly the behavior of temperature and hydrological variables. Mote et al. (2005) found that some portion of the changes in snowpack, streamlow timing, and snow/rain partitioning could be explained by luctuations in the PDO.
4. DISCUSSIONS AND CONCLUSIONS
Studies have shown that one of the most important questions regarding extreme events is if their occurrence is increasing or decreasing over time, characterized by the frequency of these events and if they are changing signiicantly. This study presents analyses of the trends in four annual and seasonal extreme indices of air temperature for Idaho, USA. The analyses were conducted using long-term and high quality data sets for 35 meteorological stations for the period between 1970 and 2006.
Our analyses suggest that in the study region, both daily maximum (daytime) and minimum (nighttime) temperatures had increasing trends, but the rates of warming were different, with greater nighttime warming. In other words, most of Idaho has shown that the difference between maximum and minimum air temperatures is decreasing; indicating that the minimum air temperature is increasing faster than the maximum air temperature.
The observed increasing in the GSL may be associated with a possible reduction of frost days as observed by Frich et al. (2002). Provided that the largest changes in minimum air temperatures will occur in mid-to-high northern latitudes in a changing climate, it is expected that the largest changes occur towards an early growing season with an increase in its length in Idaho. It is likely that the present changes in minimum air temperatures (and certainly reduction of frost days) have signiicant effect on the GSL over Idaho.
Our data suggest that, on average, the GSL in Idaho was extended by 7.5 days/decade during the period 1970–2006, associated with increasing temperatures. Provided that an extension of the growing season is accompanied by increased temperatures during the growing season, such an increase may
advance the potential crop production at high latitudes and increase the potential number of harvests and hence seasonal yields for perennial forage crops (ACIA, 2004). For example, yields of corn and soybean are inluenced by short growing seasons. Also, the sowing of crops is occasionally delayed by lower temperatures, so an earlier start of the growing season will favor earlier sowing of crop. It should be noted, that the beneits of a lengthened growing season with higher temperatures may be counteracted by changes in the precipitation patterns, especially in the arid and semi-arid regions of Idaho, where water budget limitations determine the pattern of vegetation response to atmospheric warming.
Agriculture (crop production and livestock) is an important economic activity in Idaho. Crops such as hay, alfalfa, corn, wheat and barley are grown in the arid climate, mostly under irrigation practices. Irrigated agriculture is dependent on winter snowpack accumulation and storage as the main water supply for the summer months. Rapid population growth will exacerbate the pressure on the water resources. Continuing changes in climate will affect water supply and soil moisture availability, making it less feasible to grow crops in certain regions. Increases in extreme events such as loods, droughts and heat waves predicted by the IPCC (2007) will pose further challenges to farmers.
An important effect of increase in temperature, especially in regions where agricultural production is seasonally limited by temperature as in Idaho, can be the soil moisture which inluence crop yields; as well as, the soil moisture can be affected by changes in rainfall patterns, and the extension of the growing season, increase soil evaporation rates and severe droughts (Linderholm, 2006). The analysis has identiied that the air temperature has increased in Idaho during the last 3 decades. The evaluation of the trends of extreme air temperature may help to a better understanding of the possible regional and local scale impacts of climate change on agriculture and human health.
Trends in regional air temperature and their indication of climate change are of interest to Idaho and the rest of the world. The trends obtained herein corroborate the general idea that during the last century the globe has warmed. Additionally, the experience acquired with this study for Idaho, USA, can be extended to other regions. Future research should incorporate
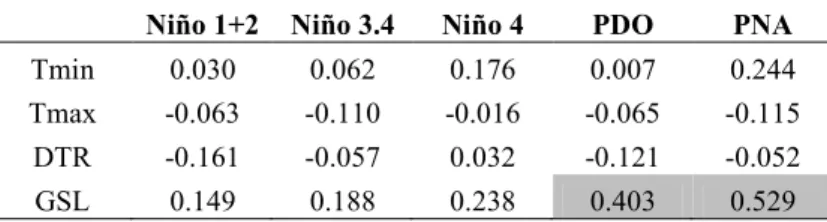
Niño 1+2 Niño 3.4 Niño 4 PDO PNA
Tmin 0.030 0.062 0.176 0.007 0.244
Tmax -0.063 -0.110 -0.016 -0.065 -0.115
DTR -0.161 -0.057 0.032 -0.121 -0.052
GSL 0.149 0.188 0.238 0.403 0.529
Table 5 - Correlation coeficients between air temperature indices and SST anomalies for Idaho, USA for the period of 1970 to 2006. The highlighted
more regional stations in surrounding states, possibly stratifying the analysis by elevation and regional microclimates with a closer look to weather station location and possible urbanization effects (Santos et al., 2011).
5. ACKNOWLEDGEMENTS
The authors are grateful for the National Climatic Data Center of United States for providing the dataset, Dr. Xuebin Zhang and Dr. Feng Yang from Canadian Meteorological Service for providing the RClimdex software.
6. REFERENCES
ABATZOGLOU J. T. Inluence of the PNA on declining mountain snowpack in the Western United States. International Journal of Climatology, v.31, p.1135 – 1142, 2011.
ACIA. Impacts of a Warming Arctic: Arctic Climate Impact Assessment. Cambridge University Press: Cambridge, New York; 140 p., 2004.
ALEXANDER L. V., X. ZHANG, T. C. PETERSON, J. CAESAR, B. GLEASON, A. M. G. KLEIN TANK, M. HAYLOCK, D. COLLINS, B. TREWIN, F. RAHIMZADEH, A. TAGIPOUR, K. R. KUMAR, J. REVADEKAR, G. GRIFFITHS, L. VINCENT, D. B. STEPHENSON, J. BURN, E. AGUILAR, M. BRUNET, M. TAYLOR, M. NEW, P. ZHAI, M. RUSTICUCCI, J. I. VAZQUEZ-AGUIRRE. Global observed changes in daily climate extremes of temperature and precipitation. Journal of Geophysical Research, v.111, D05109, 2006.
BARFORD C. C., S. C. WOFSY, M. L. GOULDEN, J. W. MUNGER, E. H. PYLE, S. P. URBAN-SKI, L. HUTYRA, S. R. SALESKA, D. FITZJARRALD, K. MOORE. Factors controlling long- and short-term sequestration of atmospheric CO2 in a mid-latitude forest. Science, v.294,
p.1688–1691, 2001.
DUFEK A. S.; AMBRIZZI, T. Precipitation variability in São Paulo State, Brazil. Theoretical and Applied Climatology, v.93, p.167-178, 2008.
FOLLAND C. K., T. R. KARL, J. R. CHRISTY, R. A. CLARKE, G. V. GRUZA, J. JOUZEL, M. E. MANN, J. OERLEMANS, M. J. SALINGER, S. W. WANG. Observed climate variability and change. In: ClimateChange 2001: The Scientiic Basis. Contribution of WorkingGroup I to the Third Assessment Report of the IntergovernmentalPanel on
Climate Change. Cambridge University Press, Cambridge,
UK, and New York, USA, 2001.
FRICH P., L. V. ALEXANDER, P. DELLA-MARTA, B. GLEASON, M. HAYLOCK, A. M. G. KLEIN TANK,
T. PETERSON. Observed coherent changes in climatic extremes during the second half of the twentieth century. Climate Research, v.19, p.193–212, 2002.
HARSHBURGER B., H. YE, J. DZIALOSKI. Observational evidence of the inluence of Paciic SSTs on winter precipitation and spring stream discharge in Idaho. Journal of Hydrology, v.264, p.157–169, 2002.
HAYLOCK M. R., T. C. PETERSON, L. M. ALVES, T. AMBRIZZI, Y. M. T. ANUNCIAÇÃO, J. BAEZ, V. R. BARROS, M. A. BERLATO, M. BIDEGAIN, G. CORONEL, V. J. GARCIA, A. M. GRIMM, D. KAROLY, J. A. MARENGO, M. B. MARINO, D. F. MONCUNILL, D. NECHET, J. QUINTANA, E. REBELLO, M. RUSTICUCCI, J. L. SANTOS, I. TREBEJO, L. A. VINCENT. Trends in total and extreme South American rainfall 1960-2000 and links with sea surface temperature. Journal of Climate, v.19, p.1490-1512, 2006.
HUGHES, L. Biological consequences of global warming: is the signal already apparent? Trends in Ecological Evolution, v. 15, p.56–61, 2000.
IPCC. Climate Change 2007 – The Physical Science Basis. Contribution of Working Group I to the Fourth Assessment Report of the IPCC. Cambridge Univ. Press, Cambridge, 2007.
KARL T. R., R. W. KNIGHT, D. R. EASTERLING, R. G. Quayle. Indices of climate change for the United States. Bulletim of American Meteorological Society, v.77, p.279-292, 1996.
KARLSSON, P.E., TANG, L., SUNDBERG, J., CHEN, D., LINDSKOG, A., PLEIJEL, H. Increasing risk for negative ozone impacts on the vegetation in northern Sweden. Environmental Pollution, v.150, p.96–106, 2007.
KEELING C. D., J. F. S. CHIN, T. P. WHORF. Increased activity of northern vegetation inferred from atmospheric CO2 measurements. Nature, v.382, p.146–149, 1996.
LINDERHOLM H. W. Growing season changes in the last century. Agricultural and Forest Meteorology, v.137, p.1–14, 2006.
MEEHL G. A., C. TEBALDI, G. WALTON, D. EASTERLING, L. MCDANIEL. Relative increase of record high maximum temperatures compared to record low minimum temperatures in the U.S. Geophysical Research Letters, v.36, L23701, doi:10.1029/2009GL040736, 2009.
MENZEL A., G. JAKOBI, R. AHAS, H. SCHEIFINGER, N. ESTRELLA. Variations of the climatological growing season (1951-2000) in Germany compared with other countries. International Journal of Climatology, v.23, p.793 – 812, 2003.
America. Bulletin of the American Meteorological Society, v. 86, p.39-49, 2005.
MYNENI R. C., C. D. KEELING, C. J. TUCKER, G. ASRAR, R. R. NEMANI. Increased plant growth in the northern high latitudes from 1981 to 1991. Nature, v.386, p.698–702, 1997.
PARTAL T.; E. KAHYA. Trend analysis in Turkish precipitation data. Hydrological Processes, v.20, p.2011–2026, 2006. PENUELAS, J., FILELLA, I. Responses to a warming world.
Science, v. 294, p.793–794, 2001.
ROBESON S. M. Increasing growing-season length in Illinois during the 20th century. Climatic Change, v.52, p.219-238, 2002.
SANTOS C. A. C., C. M. U. NEALE, T. V. R. RAO, B. B. SILVA. Trends in indices for extremes in daily temperature and precipitation over Utah, USA. International Journal of Climatology, v.31, p.1813 – 1822, 2011.
SNEYERS R. On the Statistical Analysis of Series of Observations. Technical Note No. 143, WMO No. 415 World Meteorological Organization: Geneva. 1990. SOHRABI, M. M., RYU, J. H., ABATZOGLOU, J., TRACY,
J. Climate extreme and its linkage to regional drought over Idaho, USA. Natural Hazards, v.65, p.653–681, 2013. SONG Y., H. W. LINDERHOLM, D. CHEN, A. WALTHER.
Trends of the thermal growing season in China, 1951–2007. International Journal of Climatology, v.30, p.33–43, 2010.
VINCENT L. A., T. C. PETERSON, V. R. BARROS, M. B. MARINO, M. RUSTICUCCI, G. CARRASCO, E. RAMIREZ, L. M. ALVES, T. AMBRIZZI, M. A. BERLATO, A. M. GRIMM, J. A. MARENGO, L. MOLION, D. F. MONCUNILL, E. REBELLO, Y. M. T. ANUNCIAÇÃO, J. QUINTANA, J. L. SANTOS, J. BAEZ, G. CORONEL, J. GARCIA, I. TREBEJO, M. BIDEGAIN, M. R. HAYLOCK, D. KAROLY. Observed trends in indices of daily temperature extremes in South America 1960–2000. Journal of Climate, v.18, p.5011–5023, 2005.
VOSE R. S., D. R. EASTERLING, B. GLEASON. Maximum and Minimum temperature trends for the globe: An update through 2004. Geophysical Research Letters, v.32, L23822, doi:10.1029/2005GL024379, 2005.
WHITE, M.A., RUNNING, S.W., THORNTON, P.E. The impact of growing-season length variability on carbon assimilation and evapotranspiration over 88 years in the eastern US deciduous forest. International Journal of Biometeorology, v.42, p.139–145, 1999.
WRCC. Historical Climate Information. http://www.wrcc.dri. edu/narratives/IDAHO.htm. Accessed 27 July 2011. ZHANG X., G. HEGERL, F. W. ZWIERS, J. KENYON.
Avoiding inhomogeneity in percentile-based indices of temperature extremes. Journal of Climate, v.18, p.1641– 1651, 2005.