Short Report
Printed in Brazil - ©2017 Sociedade Brasileira de Química0103 - 5053 $6.00+0.00*e-mail: [email protected]; [email protected]
Smartphone for Point-of-Care Quantification of Protein by Bradford Assay
Camila L. de Camargo, Marcia B. R. Vicentini, Angelo L. Gobbi, Diego S. T. Martinez* and Renato S. Lima*
Laboratório Nacional de Nanotecnologia, Centro Nacional de Pesquisa em Energia e Materiais, 13083-100 Campinas-SP, Brazil
We address in this paper a powerful point-of-care platform to conduct the Bradford assay. Our method was based on smartphone for colorimetric quantification of total protein in human blood plasma, presenting low cost, simplicity, portability, autonomy and ability for remote transmission of the data. Other advantage concerns the high number of smartphone’s users worldwide. This feature contributes for the application of the method by non-specialist people. The interferences from external light were successfully solved by illuminating the samples with a straightforward negatoscope. Our method generated a satisfactory exactness, with accuracy percentages ranging from 87.2 to 99.1%.
Keywords: rapid test, albumin, human plasma, colorimetry, negatoscope
Introduction
Bradford assay is one of the most usual methods applied for determining protein in solution.1-4 This method
was proposed by Marion M. Bradford in 19765 and relies
on the interaction of Comassie Brilliant Blue G-250 dye with the protein. After a short-time incubation, the anionic product of such reaction is optically monitored at 595 nm.6 The advantages of the Bradford assay are that its routine is user-friendly, fast, reproducible, sensitive and selective to the target molecule.7,8 Conversely, some pharmaceutical excipients interfere on the response of this approach even at low contents. In this case, the precipitation of the protein with sucrose showed to be an efficient alternative.9 Other bottleneck concerns the poor portability and relatively high cost (ca. US$ 10,000.00) of the spectrophotometer applied in the Bradford assays. These features undermine the compatibility of the method toward point-of-care (POC) analyses.10
POC platforms present low cost and high portability, robustness and simplicity. Accordingly, such technologies bypass the necessity for specialized personal and
allow in situ measurements even at resource-limited
environments, presenting key social and economic implications. Such methods have been recently used at diverse applications.11-16 The POC technology is the
major segment of the global in vitro diagnostics market.11 Nonetheless, despite the advantages of these methods, only a few commercial executions had been observed because of the production cost of such analytical platforms. Such drawback inhibits the creation of profitable businesses.17
We address herein a POC platform for performing the Bradford assay using smartphone-based optical detection. The smartphones have been widely used to the development of POC analytical tools for different colorimetric quantitative analyses, including immunoassays, biochemical and healthcare experiments.18-22 These applications are possible because the smartphones present the two functional components necessary for accomplishing optical detection: source (light-emitting diode, LED, white light from flash)
and radiation detector (digital camera).23 This camera
smartphone-based technologies by non-specialist operators, a striking feature within POC philosophy and that helps the science teaching in schools and universities. In fact, the smartphones maximize the social, economic and scientific implications of the POC assays.
Experimental
Bovine serum albumin (BSA), phosphate buffered saline (PBS) and Bradford reagent were purchased from Sigma-Aldrich. Plasma samples (originated from blood O+) were provided by blood center from Universidade
Estadual de Campinas (Brazil) and stored at –20 °C.
For analysis, these samples were heated to 4 °C and centrifuged at 10.000 rpm for 15 min. Afterwards, the supernatants were collected and then diluted 1:100 v/v ratio in PBS. The preparation of the solutions and the accomplishment of the Bradford assays were performed according to the official protocol.
Commercial spectrophotometer was supplied by Thermo Scientific Multiskan. We used the smartphone Sony, model Xperia Z3, which integrates a camera with resolution equal to 20.7 MP. The negatoscope was purchased from Arktus with LED-emitting white light. This instrument contains pieces in acrylonitrile butadiene styrene (ABS) and acrylic and operates from 50 up to 60 Hz in frequency and 100 mA of current. Their dimensions are 0.39 × 0.08 × 0.325 cm with weight equal to 1.086 kg. The wavelengths of the LED-emitting white light were measured through a miniaturized spectrometer of the Ocean Optics, model USB2000+. Finally, 96-well plates composed of high-transparence polystyrene were acquired from Kasvi, model K30-5096P.
Different color models (red, green, blue (RGB); hue, saturation, value (HSV); CIE and cyan, magenta, yellow, black (CYMK)) and mathematical relationships were evaluated to attain a linear fitting between the photos from the smartphone and the concentrations of protein (BSA). The values of H (hue) from the HSV color model generated the best linear fitting. Accordingly, such parameter was adopted for calculating the analytical response as discussed next.
We deployed a homemade Android app in Java programming language for accomplishing two steps in the smartphone: construction of the analytical curve from standards of protein and application to real samples. More specifically, when the images were captured by the smartphone, their parameters of RGB were directly converted in values of hue. Then, the analytical signal (Sa) was calculated in agreement with the following relationship:
(1)
where Hs and Hb are the values of hue for sample and blank, respectively. The equations related to the accomplishment of the analytical curves and their parameters are illustrated in Supplementary Information section. Concerning the step of application to the samples, the concentrations of protein (C) were calculated from the data of the regression straight equation related to the analytical curve, namely: linear coefficient (a) and analytical sensitivity (angular coefficient, S). This equation was used as:
(2)
One video showing the analytical routine applied to quantify total protein by Bradford assay using smartphone is presented in Supplementary Information section. Simply, the users insert some parameters (number of standards, concentration of such standards and number of samples) and then manually align the smartphone’s camera to the solutions in the 96-well plate. When the photos to the standards are completed, the analytical curve graph and
some parameters (coefficient of determination, R2, and
limits of detection, LOD, and quantification, LOQ) are shown at the smartphone’s display. Subsequently, a table with the protein concentrations is illustrated once the photos of the samples are taken off.
The photos from smartphone presented resolution of three pixels and a delay between them of 3 s. The smartphone is not able to simultaneously focus on all of the plate wells because of the curvature of the camera lens. Accordingly, each photo was recorded on a matrix of 2 × 3 (column, line). This procedure ensured good levels of precision. Six values of H (signals) were produced, thus covering two BSA standards or samples (separated by columns) in a single photo with measurements in triplicate (n = 3). The entire experiment (considering the construction of the analytical curve and the application to the real samples) lasted approximately 3 min only.
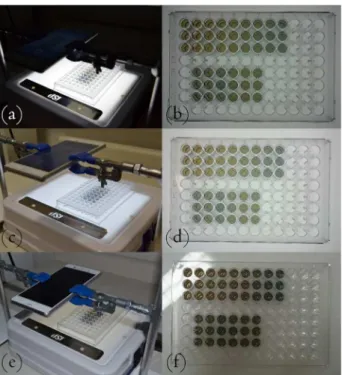
plate, and negatoscope were left under room light exposure. Finally, the light of the negatoscope was turned off whereas the smartphone and plate were kept at room light in condition C (Figures 1e and 1f). Herein, the effects from external radiation on the responses were observed as illustrated in Figure 1f. In all of these three conditions, the smartphone was held by claws at approximately 10 cm from the 96-well plate to obtain good precision and repeatability.
Results and Discussion
In relation to the negatoscope, the wavelengths of the LED-emitting white light ranged from roughly 400 up to 700 nm as exhibited in Figure 2. Analytical curves for BSA standards and some parameters (R2, analytical sensitivity, S, and LOD) obtained by the commercial spectrophotometer and smartphone are depicted in Figures 3a and 3d, respectively.
The concentrations of BSA ranged from 0.2 up to 0.8 mg mL-1 (Figure 3a). Concerning the data for smartphone, two linear ranges (0.2 to 0.8 and 0.4 to 0.8 mg mL-1) were tested for conditions A (Figure 3b) and B (Figure 3c) to investigate the method accuracy. In condition C (Figure 3d), the linear range was short with fitting between 0.5 and
0.8 mg mL-1 BSA only. The spectrophotometer generated
best linearity (R2 > 0.99) and detectability compared with smartphone. Herein, the linear fitting in condition A
was better (R2 ca. 0.99) than in B (R2 ca. 0.96). Despite the tests in C had a short linear range, the quality of
the fitting was satisfactory as well with R2 ca. 0.99.
In terms of detectability, the LOD was 6.4 µg mL-1 for the conventional analysis whereas the values for smartphone
changed from 30.0 to 106.0 µg mL-1 (considering both
the wide and short linear ranges). The more sensitive smartphone-based tests were reached at room light with illumination of the samples by negatoscope (condition B).
The smartphone in conditions A and B was successfully applied to the determination of total protein in six samples of human blood plasma. This step was intended to assess the accuracy of our method. Tables with the resulting data are shown in Supplementary Information section. Assuming the concentrations of BSA determined by the spectrophotometer as reference values, the condition C did not create accurate data likely because the interference from external light. By contrast, the levels of accuracy (global averages for analyses in three days) for A and B ranged from 87.2 to 99.1% as displayed in Figure 4. These values mathematically express the recovery of the protein contents from the data attained by the commercial spectrophotometer. The short linear range lead to biggest accuracies, whose global average was 94.1%. In addition, the most data obtained by the smartphone were in agreement with those achieved by the conventional method according to Student’s t-tests at 95 and 99% confidence level (see Supplementary Information section). From these data, we can state that the negatoscope effectively suppressed the interferences from the external light over the smartphone signals.
Finally, we investigated the robustness level of the deployed POC platform (conditions A and B) by conducting analytical curves and application (to same samples; solutions were freshly prepared) in three days. Variations
Figure 2. Spectrum for the LED-emitting white light from negatoscope.
in the parameters of the analytical curve (linear coefficient and S) and in the concentrations found for proteins in human plasma samples were assessed (n = 3). As expected, these parameters changed with relative standard deviations of up to –29.1%. Nonetheless, the contents calculated for BSA were in accordance (see confidence intervals in Figure 4) with the data of the spectrophotometer. Therefore, a new analytical curve should be achieved before each application as happens with the commercial spectrophotometer and the most instrumental analytical methods.
Conclusions
An attractive POC method for performing the Bradford assay is reported herein. Our approach relies on smartphone for colorimetric detection of proteins, thus presenting low cost, simplicity, portability, autonomy, and ability for remotely transmitting the data of the analysis. Other advantage is the high number of smartphone’s users worldwide. Such feature contributes to the employment of this technology by non-specialist people and to the science teaching in schools and universities. The commercial
Figure 3. Analytical curves for standards of BSA. (a) Data recorded with commercial spectrophotometer (a) and smartphone using the conditions: (b) A; (c) B; (d) C. All of these data were recorded in a single day, whereas the confidence intervals were calculated for α = 0.05 and n = 3. Inset in (d): photo of the samples (in plastic bags) that were investigated herein. The ranges I and II refers to the wide and short linear ranges, respectively, as discussed in the text.
Figure 4. Determination of total proteins in human blood plasmas. Accuracy data for A and B using the wide (on left) and short (on right) linear ranges according to the Figure 3. These data are averages related to three days of analysis. Herein, the confidence intervals were calculated for α = 0.05 and n = 18.
performance as well, especially when taking up the goals of a POC platform as aforementioned. Our objective herein is not developing a method to substitute the commercial instrument, but proposing an analytical platform with complementary advantages to the spectrophotometer by taking up the aforementioned features. For instance, our platform costs approximately US$ 700.00 taking into account the average prices for smartphone and negatoscope. This value is significantly lower than that of the spectrophotometer (ca. US$ 10,000.00).
The use of the negatoscope to illuminate the 96-well plates was a low cost (ca. US$ 50.00), straightforward, and efficient alternative to suppress the interferences from external light. In this case, the precision and linear range were similar to those observed for the tests with smartphone and negatoscope protected from any external radiation. Both these conditions produced high-accuracy data. The linear range for smartphone was shorter (0.2 and 0.4 to
0.8 mg mL-1) than that for the measurements with the
spectrophotometer (approximately 0.1 to 1.1 mg mL-1).8 Nonetheless, we believe this aspect is not critical because the sample dilution is a step usually required in the total protein determinations. Lastly, it is worthwhile to underline that the negatoscope does not damage the portability (the dimensions of the negatoscope were previously highlighted) and the autonomy of the developed analytical platform. This latter is true because simple electric piles can be used for charging the negatoscope for some hours.
Supplementary Information
Supplementary data are available free of charge at http://jbcs.sbq.org.br as PDF file.
A video showing the analytical routine of the smartphone-based method is available at the Supplementary Information and the link: https://www.youtube.com/ watch?v=hK84Z1DkIiY.
Acknowledgments
The authors would like to thank Gustavo M. Moreno from Centro Nacional de Pesquisa em Energia e Materiais (Campinas-SP, Brazil) for taking the photos.
References
1. Wenrich, B. R.; Trumbo, T. A.; Anal. Biochem. 2012, 428, 93. 2. Silva, M. A. O.; Arruda, M. A. Z.; Anal. Biochem. 2006, 351,
155.
3. Brady, P. N.; Macnaughtan, M. A.; Anal. Biochem. 2015, 491, 43.
4. Jones, C. G.; Hare, J. D.; Compton, S. J.; J. Chem. Ecol. 1989,
15, 979.
5. Bradfor, M. M.; Anal. Biochem. 1976, 72, 248.
6. Zaia, D. A. M.; Zaia, C. T. B. V.; Lichtig, J.; Quim. Nova 1998,
21, 787.
7. Sedmak, J. J.; Grossberg, S. E.; Anal. Biochem. 1977, 79, 544. 8. Martinez, D. S. T.; Paula, A. J. L.; Fonseca, C.; Luna, L. A. V.; Silveira, C. P.; Durán, N.; Alves, O. L.; Eur. J. Inorg. Chem.
2015, 27, 4595.
9. Cheng, Y.; Wei, H.; Sun, R.; Tian, Z.; Zheng, X.; Anal. Biochem.
2016, 494, 37.
10. Lima, R. S.; Shiroma, L. Y.; Teixeira, A. V. N. C.; Toledo, J. R.; Couto, B. C.; Carvalho, R. M.; Carrilho, E.; Kubota, L. T.; Gobbi, A. L.; Anal. Chem. 2014, 86, 9082.
11. Yetisen, A. K.; Akram, M. S.; Lowe, C. R.; Lab Chip 2013, 13, 2210.
12. Gubala, V.; Harris, L. F.; Ricco, A. J.; Tan, M. X.; Williams, D. E.; Anal. Chem. 2012, 84, 487.
13. Drain, P. K.; Hyle, E. P.; Noubady, F.; Freedberg, K. A.; Wilson, D.; Bishai, W. R.; Rodriguez, W.; Bassett, I. V.; Lancet Infect. Dis. 2014, 14, 239.
14. Weaver, W.; Kittur, H.; Dhar, M.; Carlo, D. D.; Lab Chip 2014,
14, 1962.
15. Zhu, H.; Isikman, S. O.; Mundanyali, O.; Greenbaum, A.; Ozcan, A.; Lab Chip 2013, 13, 51.
16. Rozand, C.; Eur. J. Clin. Microbiol. Infect. Dis. 2014, 33, 147. 17. Tantra, R.; van Heeren, H.; Lab Chip 2013, 13, 2199. 18. Su, K.; Zou, Q.; Zhou, J.; Zou, L.; Li, H.; Wang, T.; Hu, N.;
Wang, P.; Sens. Actuators, B 2015, 216, 134.
19. Vashist, S. K.; van Oordt, T.; Schneider, E. M.; Zengerle, R.; von Stetten, F.; Luong, J. H. T.; Biosens. Bioelectron. 2015, 67, 248.
20. Wu, Y.; Boonloed, A.; Sleszynsky, N.; Koesdjojo, M.; Armstrong, C.; Bracha, S.; Remcho, V. T.; Clin. Chim. Acta
2015, 448, 133.
21. Barbosa, A. I.; Gehlot, P.; Sildapra, K.; Edwards, A. D.; Reis, N. M.; Biosens. Bioelectron. 2015, 70, 5.
22. Vashist, S. K.; Schneider, E. M.; Zengerle, R.; von Stetten, F.; Luong, J. H. T.; Biosens. Bioelectron. 2015, 66, 169. 23. Shen, L.; Hagen, J. A.; Papautsky, I.; Lab Chip 2012, 12, 4240. 24. Zhang, D.; Liu, Q.; Biosens. Bioelectron. 2016, 75, 273. 25.
http://www.statista.com/statistics/330695/number-of-smartphone-users-worldwide/ accessed in July 2016. 26.
http://www.emarketer.com/Article/2-Billion-Consumers-Worldwide-Smartphones-by-2016/1011694M accessed in July 2016.
Submitted: April 23, 2016 Published online: July 19, 2016