High Temperature Raman Spectra of L-Leucine Crystals
P. F. Fac¸anha Filho, P. T. C. Freire, K. C. V. Lima, J. Mendes Filho, F. E. A. Melo, Departamento de F´ısica, Universidade Federal do Cear´a,
Campus do Pici, C.P. 6030 Fortaleza, CE, 60455-760, Brazil
and P. S. Pizani
Departamento de F´ısica, Universidade Federal de S˜ao Carlos, S˜ao Carlos, SP, 13565-905, Brazil
Received on 30 October, 2007
Single crystal samples of L-leucine, C6H13NO2, a fundamental aliphatic amino acid of the human body, have been studied by Raman spectroscopy at temperatures from 300 to 430 K over the spectral range from 50 to 3100 cm−1. A tentative assignment of all bands is given. For high temperatures, several modifications on the Raman
spectra were observed at about 353 K, giving evidence that the L-leucine crystal undergoes a structural phase transition. An interpretation for this phase transition in terms of group theory analysis is given.
Keywords: Leucine; Amino acid; Raman spectroscopy
I. INTRODUCTION
There has been a great deal of interest in the vibrational and structural characterization of amino acid crystals under extreme conditions in the last years. This interest has been fu-eled by the possibility of using them in technological devices, mainly in those cases where amino acid crystallizes together with other inorganic molecules, as occurs for L-arginine phos-phate, which presents a high non-linear coefficient and can be used as a non-linear material involving several applications [1, 2]. Additionally, there are other aspects related to physical be-havior that can be observed easily by vibrational and structural investigations. One of these aspects deals with the correlation among packing of molecules, the density and the stability of a certain crystal structure. For example, it is known that L-serine crystal is more dense than DL-L-serine, but the L-form undergoes a structural phase transition at lower pressure [3, 4]. In other words, the expected role played by the packing of molecules in the crystal is not so important, being more im-portant for the problem the hydrogen bond interactions of the molecules.
Among the proteic amino acids the simplest are the aliphatic ones, compressing glycine (non-chiral), L-alanine, L-isoleucine, L-valine and L-leucine. For the first three amino acids previous investigations do not shown any structural phase transition under temperature changes [5 – 8], although a study involving birrefrigence and light depolarization mea-surements have shown some symmetry breaking around 220 K for L-alanine [9]. It is also important to state that differ-ently from the temperature change experiments, there is evi-dence that L-alanine undergoes a structural phase transition at about 2.2 GPa under high pressure conditions [10]. For the other two aliphatic amino acid crystals the picture is as fol-lows. A temperature investigation on L-valine crystal using Raman spectroscopy technique showed that the material un-dergoes a phase transition between 100 and 120 K [11]. For L-leucine crystal, to the best of our knowledge, only Boygeard have published a work reporting properties of L-leucine crys-tal at high temperatures [12]. In such a work it was presented evidence of a phase transition at 80 oC through differential
scanning calorimetry measurements and two unpolarized Ra-man spectra (at 300 and 360 K) on L-leucine performed in the limited spectral range between 100 and 1700 cm−1.
The objective of this work is three-fold: (i) to present the Raman spectra of L-leucine crystal through the entire spec-tral range of the normal modes, 50 – 3200 cm−1, and give a
tentative assignment of them; (ii) to present the temperature evolution of the Raman spectra of L-leucine crystal, giving particular attention to the changes which were associated to a structural phase transition undergone by the material; (iii) to give a tentative interpretation for the occurrence of this phase transition in terms of group theory analysis.
II. EXPERIMENTAL
Single crystals of L-leucine were grown from aqueous so-lution containing powder from Sigma by the slow evapora-tion method at controlled temperature. They were obtained as colorless tiny platelets, similarly with L-valine [11] and L-isoleucine [8] crystals. As occurs for L-isoleucine crys-tal, the large face (001) of the crystal is perpendicular to the c-axis and this was defined as the z-axis through X-ray dif-fraction. The smaller faces have indices (100) and (110); the axis perpendicular to the (100) face is the x-axis in our exper-iments. The backscattering light was analyzed using a Jobin Yvon Triplemate 64000 micro-Raman system equipped with an N2-cooled CCD detector. The slits were set for a 2 cm−1
spectral resolution. The excitation source for the Raman ex-periments was 514.5 nm radiation from an argon ion laser. In order to obtain high temperature a Linkan TS1500 micro fur-nace was utilized. The experiments were accomplished with heating of the sample and no crystal cracking was observed at the transition temperature.
III. RESULTS AND DISCUSSION
the P21 space group, β= 86.2o. The conformations of the two leucine molecules are similar but not identical to each other and to that in DL-leucine. According to Harding and Howieson [13], the carboxyl and amino groups are hydrogen bonded in a double layer very like that in other non-polar L-amino acids (for example, L-valine [11] and L-isoleucine [8]). In terms of the irreducible representations (IRep) of the C2 factor group, the normal modes are decomposed asΓ= 132 A + 132 B, and because there are two acoustic modes at the B IRep and one at the A IRep, the optical modes areΓop= 131
A + 130 B.
700 600 500 400 300 200 100
67 1 671 87 46 0 53 6 40 6 33 2 17 5 536 46 0 445 405 352 33 2 28 8 245 205 18 5 17 5 12 5 110 72 87 65 Z(XX)Z Z(YY)Z Raman intens ity
Wavenumber /cm-1
L-Leucine
FIG. 1: Raman spectra of L-leucine crystal in the 50 – 700 cm−1
spectral region in the z(yy)z and z(xx)z scattering geometries. Inset: Molecular structure of L-leucine.
Figure 1 presents the Raman spectra of L-leucine crystals for two scattering geometries, z(yy)z and z(xx)z, in the spec-tral region 50 – 700 cm−1. The axes were defined according
to the following convention: the z-axis was that perpendicular to the plane of the platelet and the y-axis was defined as the axis coincident with the longest dimension of the crystal; the x-axis was defined perpendicular to the y- and z-axes. In gen-eral terms, the bands observed with wavenumber lower than 150 cm−1 are associated to the lattice modes of the crystal
(lat.) and they can give interesting insights about the stability of the structure under changes of thermodynamic parameter as temperature and pressure. The band at 175 cm−1is tentatively
associated to a torsion of CO−
2 unit,τ(CO−2), and bands at 185 and 205 cm−1, for the z(yy)z geometry, can be associated to
torsions of CH,τ(CH) [8]. In the L-leucine spectrum in the z(xx)z scattering geometry it is observed two bands at 245 and 288 cm−1that can be associated with out-of-plane vibration of
CH,γ(CH), and CH3torsion,τ(CH3), respectively [14]. The low intense band at 332 cm−1is tentatively assigned as a NCC
deformation,δ(NCC) [11], while the bands at 352, 406, 445 and 460 cm−1are assigned as skeletal structure deformations, δ(skel.) [14]. Finally, in the spectra of L-leucine presented in Fig. 1 it is observed an intense band at 536 cm−1which is
associated with the rocking of CO−
2 unit, r(CO−2)[8, 14]. It is
interesting to note that the bands at 185, 205 and 445 cm−1are
not observed in the spectrum of the z(xx)z scattering geome-try. Also, in other spectral regions (see following figures) it is possible to observe that some bands are absent in the spectrum of one of the scattering geometries. This occurs because the orientation of the molecule allows that vibrations associated with molecular fragments could contribute with some Raman bands to a certain scattering geometry, while for others, such contribution is irrelevant.
1200 1100 1000 900 800 700
L-Leucine 12 40 11 87 11 88 11 75 11 77 11 49 11 30 11 31 108 2 103 2 10 33 100 4 96 5 94 7 9 26 91 9 84 9 83 8 10 83 96 5 94 7 92 6 91 9 84 9 838 77 7 Z(XX)Z Z(YY)Z R a man intensit y
Wavenumber / cm-1
FIG. 2: Raman spectra of L-leucine crystal in the 700 – 1270 cm−1
spectral region in the z(yy)z and z(xx)z scattering geometries.
Figure 2 presents the Raman spectra of L-leucine in the spectral region 700 – 1270 cm−1. The band at 777 cm−1
is associated to a CO−
2 deformation, δ(CO−2)[14]. The two bands at 838 and 849 cm−1present an inversion of intensity
for the two scattering geometries; they are assigned as out-of-plane vibration of CO−
2,γ(CO−2), and rocking of CH3, r(CH3) [8]. The 900 – 1100 cm−1spectral region is characterized by
bands associated to several CC and CN stretching vibrations, ν(CC) andν(CN) [8, 11]. The band observed at 1131 cm−1is
assigned as rocking of NH+3 unit, r(NH+3), as well as the dou-blet at 1177 and 1187 cm−1 (in the z(xx)z scattering
geom-etry) [11]. The band at 1240 cm−1is tentatively assigned as
torsion of CH2,τ(CH2)[8].
The Raman spectra of L-leucine crystal in the 1280 – 1700 cm−1spectral region is presented in Fig. 3. This is a rich
re-gion, where many bands are observed, in particular, for the z(yy)z scattering geometry. Most of the bands in the region 1300 – 1375 cm−1are assigned as deformations of CH unit, δ(CH) [8, 12]. Bands at 1391 and 1411 cm−1are associated
to symmetric bending of CH3,δS(CH3), and peaks at 1458
and 1475 cm−1are associated to asymmetric bending of CH3, δa(CH3). In the z(yy)z scattering geometry the bands
ob-served at 1560, 1585 and 1626 cm−1are associated to
stretch-ing vibrations of CO−
2,νCO−2), and, possibly, to bending vi-bration of NH+3,δ(NH+3)[8, 11, 12]. It is worthwhile to men-tion a particular remark related to the 1550 – 1650 cm−1
scat-1700 1600 1500 1400 1300 L-Leucine 1 626 1585 1560 1516 14 75 1 475 1467 1467 14 58 1458 144 4 144
1 1411
1 411 1391 139 0 137 5 1349 134 6 136 5 13 54 1343 132 4 13 24 1 318 1318 1300 Z(XX)Z Z(YY)Z 1502 1 300 R a m a n in te n s it y
Wavenumber / cm-1
FIG. 3: Raman spectra of L-leucine crystal in the 1280 – 1700 cm−1
spectral region in the z(yy)z and z(xx)z scattering geometries.
tering geometry it is very clear that the band at 1626 cm−1
has an intensity greater than the band at 1585 cm−1which is
greater than the peak at 1560 cm−1. The observation of the
same spectral region in L-valine [8] and L-isoleucine [11] re-veals the same relationship of intensities for the three peaks. Additionally, the Raman spectrum of L-leucine presents no peak in this region for the z(xx)z scattering geometry; the same is true for L-valine [8] and L-isoleucine [11].
3100 3000 2900 2800
2 906 297 1 2 971 28 99 290 0 2 871 28 71 2 990 L-Leucine 29 06 29 28 29 41 295 9 2 990 29 60 29 39 292 7 Z(XX)Z Z(YY)Z Raman intensity
Wavenumber / cm-1
FIG. 4: Raman spectra of L-leucine crystal in the 2800 – 3100 cm−1
spectral region in the z(yy)z and z(xx)z scattering geometries.
Figure 4 presents the Raman spectra of L-leucine crystal for two scattering geometries in the 2800 – 3100 cm−1spectral
region. Bands due to the stretching vibrations of methylene, methyne and ammonium groups are expected to be observed in this high wavenumber region. However, as it is well known, the bands associated to the stretching vibrations of the NH3 group present low intensity in the Raman spectrum. In
gen-eral, the other bands appear with wavenumbers very similar to those of L-isoleucine crystal; the tentative assignment of these bands is given in Table 1. A final observation is that no band was observed for wavenumber higher than 3100 cm−1,
indicating that the crystal has grown as an anidrous form; in fact, when OH stretching vibrations are present, a large band centered at∼3400 cm−1is observed.
IV. HIGH-TEMPERATURE RAMAN SPECTRA
The interest in the study of the vibrational properties of organic and semi-organic (an organic molecule with a non-organic one, such as HCl or H2O) substances varying tem-perature has grown in the last years mainly because of the possibility to shed light on the question of hydrogen bonds [15] and to help on the understanding of the phenomenon of polymorphism, mainly related to pharmaceuticals, pigments, and optical materials, among others [16]. Amino acid crys-tals, in particular, due to the fact that they are structures kept together through hydrogen and van der Waals bonds are ex-pected to be unstable under great temperature variations. This is true, for example, for L-valine crystals that under low-temperature conditions undergo a phase transitiona at about 100 K [11]. For L-isoleucine crystals, another aliphatic pro-teic amino acid, the same temperature changes verified in the L-valine experiment (20 – 300 K) do not affect the stabil-ity of the structure [8]. L-alanine crystal, the smallest chiral aliphatic amino acid, when submitted to the same tempera-ture conditions, seems to maintain the orthorhombic room-temperature structure, although the existence of a strong dy-namic Jahn-Teller effect originated from the NH+3 charge-lattice coupling would explain a previouly misterious charge-lattice instability at∼250 K [9]. Also, recently it was discovered that when L-alanine is fully deuterated, a structural phase tran-sition is observed for temperature lower than 200 K [17].
In this section we discuss the effect of high temperature (T
>297 K) on the Raman spectra of L-leucine crystal. Fig. 5
shows the temperature evolution of the Raman spectra for all spectral regions in the z(yy)z scattering geometry. In order to facilitate the discussion we divided the spectra into four regions (Figs. 5(a) – 5(d)). Fig. 5(a) presents the bands ap-pearing in the high-wavenumber region. The Raman spectra in this region show little changes, being observed only slight variations in the intensity of the bands. In fact, increasing tem-perature the two main effects on the CH2and CH3stretching region are: (i) a band at 2990 cm−1, initially well separated
from the most intense bands of lower wavenumber decreases intensity and appears as a shoulder of the bands of 2960/ 2971 cm−1; (ii) bands at 2927 and 2939 cm−1, which are seen as a
band with large linewidth in the room temperature spectrum, begins to be observed as distinct bands in the spectrum at 323 K. For higher temperatures the two bands are clearly observed as separated ones.
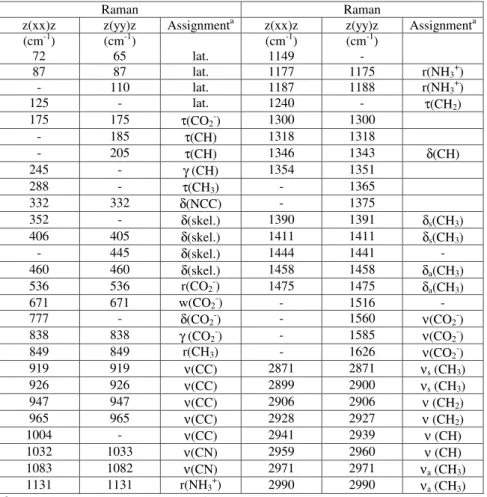
TABLE 1: Experimental wavenumbers from the Raman spectra of L-leucine crystal at room temperature and a tentative assignment of the modes.
Raman Raman
z(xx)z z(yy)z Assignmenta z(xx)z z(yy)z Assignmenta (cm-1) (cm-1) (cm-1) (cm-1)
72 65 lat. 1149 -
87 87 lat. 1177 1175 r(NH3+)
- 110 lat. 1187 1188 r(NH3+)
125 - lat. 1240 - τ(CH2)
175 175 τ(CO2-) 1300 1300
- 185 τ(CH) 1318 1318
- 205 τ(CH) 1346 1343 δ(CH)
245 - γ (CH) 1354 1351
288 - τ(CH3) - 1365
332 332 δ(NCC) - 1375
352 - δ(skel.) 1390 1391 δs(CH3)
406 405 δ(skel.) 1411 1411 δs(CH3)
- 445 δ(skel.) 1444 1441 -
460 460 δ(skel.) 1458 1458 δa(CH3)
536 536 r(CO2-) 1475 1475 δa(CH3)
671 671 w(CO2-) - 1516 -
777 - δ(CO2-) - 1560 ν(CO2-)
838 838 γ (CO2-) - 1585 ν(CO2-)
849 849 r(CH3) - 1626 ν(CO2-)
919 919 ν(CC) 2871 2871 νs(CH3)
926 926 ν(CC) 2899 2900 νs(CH3)
947 947 ν(CC) 2906 2906 ν (CH2)
965 965 ν(CC) 2928 2927 ν (CH2)
1004 - ν(CC) 2941 2939 ν (CH)
1032 1033 ν(CN) 2959 2960 ν (CH)
1083 1082 ν(CN) 2971 2971 νa(CH3)
1131 1131 r(NH3+) 2990 2990 νa(CH3) a
lat., lattice vibration; τ, torsion; δ, bending; r, rocking; w, wagging; γ, out-of-plane vibration;ν, stretching; skel., skeletal vibration; s, symmetric; a, asymmetric.
geometry in the spectral region 1280 – 1750 cm−1. Here,
sev-eral aspects can be cited. First, most of the bands decrease intensity as occurs for the band observed at 1300 cm−1in the
spectrum of room temperature. However, for the doublet 1318 and 1324 cm−1an interesting effect is observed: by increasing
temperature the low-intensity band at 1324 cm−1decreases
in-tensity in such a way that in the spectra of 323 – 343 K it is observed only as a shoulder of the other band. In the spectrum taken at 353 K the band originally at 1324 cm−1is not
visi-ble and, at the same time, the neighboring band (originally at 1318 cm−1)seems to increase intensity relatively to the other
bands of the spectrum. A possible explanation for this not conventional fact is that starting from the 353 K, the doublet becomes degenerated.
The low-intensity bands observed in the room temperature spectrum at 1365 and at 1441 cm−1are seen only as shoulders
of the intense neighboring bands (at 1343 and 1458 cm−1,
re-spectively) when the sample is heated up to 393 K. Another observation in the spectra of Fig. 5(b) refers to the bands be-tween 1550 and 1650 cm−1. The band observed originally at
1560 cm−1has its intensity vanishing for T =353 K. Also, the
bands at 1585 and 1626 cm−1change intensities when
temper-ature varies from 297 to 413 K, similarly to what occurs with low-wavenumber bands of L-valine crystal at low tempera-ture [11] and with low-wavenumber bands of L-alanine crystal at high pressure conditions [10]. While for low-wavenumber peaks, which are associated to lattice modes of amino acid molecule, the change of intensities are ascribed to a mutual molecular reorientation in the lattice, for these modes of high-wavenumber we believe that the relative change of intensities could be attributed to coupling of internal modes with modes of low energy or to different temperature variation of intensi-ties, giving rise to an apparent exchange of intensities.
Figure 5(c) shows the temperature evolution of the Raman spectra of L-leucine crystal for the z(yy)z scattering geome-try in the spectral region 700 – 1250 cm−1. One interesting
aspect is worth mentioning. A band at∼810 cm−1 begins to be observed when temperature reaches 353 K, i.e., at room temperature there is no band between 700 and 830 cm−1and
at that temperature a band appears. Also interesting is the fact that at room temperature it is observed a doublet at 919 and 926 cm−1; when the sample is heated the bands lose intensity
1200 1100 1000 900 800 700 3200 3100 3000 2900 2800 2700
700 600 500 400 300 200 100 1700 1600 1500 1400 1300
(b)
(d)
(c)
(a)
R
am
an
in
te
n
sity
297 K
313 K
323 K
333 K 343 K
413 K 403 K 393 K 383 K 373 K 363 K 353 K
z(yy)z
Wavenumber / cm-1 413 K
403 K 393 K 383 K 373 K 363 K 297 K 313 K
323 K 333 K 343 K
z(yy)z
353 K
Ram
an
i
n
ten
sity
Wavenumber / cm-1
z(yy)z
403 K 393 K 383 K 373 K 363 K
413 K 313 K
323 K
333 K 343 K 297 K
353 K
Ram
an
in
ten
sity
Wavenumber / cm-1
z(yy)z
413 K 403 K 393 K 383 K 373 K 353 K 363 K 343 K 323 K 333 K 313 K 297 K
Ra
m
an in
te
n
sity
Wavenumber / cm-1
FIG. 5: Raman spectra of L-leucine crystal in the 50 – 3200 cm−1spectral region in the z(yy)z scattering geometry for several temperatures.
the doublet originates one only band.
Figure 5(d) presents the Raman spectra of L-leucine crys-tals for the z(yy)z scattering geometry in the region 50 – 700 cm−1for several temperatures. In the region 300 – 700 cm−1
it is observed that all bands decrease intensities and their linewidths increase, as one expects. Bands at 175, 185 and 205 cm−1(marked by three down arrows), associated to
tor-sional modes, are well visible in the spectrum at room temper-ature but, when tempertemper-ature is increased, one observes that the band originally at 185 cm−1decreases intensity in such a way
that at 353 K only two bands are present (they are marked by two arrows). The two bands remain up to the highest temper-ature of the experiments.
The region of the external modes (wavenumbers up to∼ 150 cm−1), in particular, deserves special attention. We have
shown that at∼353 K a series of changes appears in the in-ternal modes region of L-leucine crystal. This can be an indi-cation that some change in the structure is taking place at that temperature, although other phenomena can explain changes in bands associated to internal mode vibrations. One of the most known examples is related to L-alanine crystal where the splitting of the NH+3 torsional mode is observed at∼220 K, but being associated to small distortions of the NH+3 group, not to a structural phase transition [6]. On the contrary, tau-rine crystal is an example where changes in bands associated to internal modes (e.g. torsional vibration of CSH moiety) are effectively related to a structural modification [18]. For L-leucine crystal one observes that at T = 297 K three different bands (up to 150 cm−1)are present in the spectrum. When
energy is such that at the highest temperature they appear as a large band. The most important effect, however, is observed for the band at 110 cm−1, also marked by an arrow: its
in-tensity continuously decreases and at about 353 K it goes to zero. The vanishing of this band associated to a lattice vibra-tion can in a straightforward way be interpreted as a structural phase transition undergone by L-leucine crystal at 353 K.
y
k
ik
sk
ik
sy
⊗
z
z
k
fL.O
T.O.
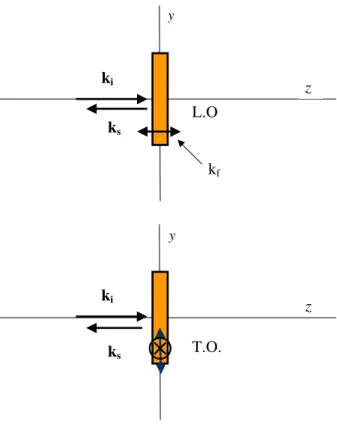
FIG. 6: Representations of the L-leucine crystal in the yz plane;ki,
ksand kf stand, respectively, for the wave vector of incident and
scattered lights and for the wave vector of the phonons. The upper representation corresponds to the C2symmetry of the room temper-ature phase: the polarization of the phonon is in the same direction ofkf. The lower representation corresponds to the Cssymmetry of
the high temperature phase:kf is in the z direction (not represented,
for simplicity) and polarizations are in the x and y directions.
A possible interpretation for this phase transition is given as follows: at room temperature the crystal belongs to a C2 symmetry and above 353 K the crystal belongs to a Cs
sym-metry. In this way, when the temperature is increased close to the phase transition, longitudinal optical (LO) modes be-gin to decrease intensity and in the new phase the intensity goes to zero. This explains the disappearance of modes of low energy, as well as, those around 920 cm−1. Fig. 6 shows
a representation of the crystal in the yz plane for the room temperature phase (upper) and for the high temperature phase (lower) with the wave vectors for the incident (ki)and
scat-tered (ks)lights and the wave vector for the phonons (kf).
The incident and scattered lights are in the z direction and the phonons involved are in the same direction. Through the char-acter table of C2group (Ref. [19]) it is clear that only phonons with z-polarization are allowed and, as a consequence, the modes involved in the scattering process at room temperature are LO. Above 353 K (supposing the new symmetry being Cs)the phonons propagating in the z-direction are polarized
in the x and y directions [19] and, consequently, the phonons involved in the scattering process are transversal optical (TO) modes.
As pointed out in Ref. [20], the molecules of L-leucine in the unit cell are organized in layers parallel to thebcface of the crystal. These layers present two kinds of interactions: on one side they interact via hydrogen bonds and on the other side they interact through the methyl groups of the leucine side chains. Because we have observed changes in the low-wavenumber region, it is possible that the phase transition in-volves the rupture of one hydrogen bond among the three pos-sibilities of H bonds on amino N atoms with different mole-cules. The understanding of this dynamics which must be achieved by other measurements (X-ray and neutron diffrac-tions) will be important to shed light on the interactions of al-ternating polypeptides that have similar organization to those of L-leucine molecules in their crystalline structure.
V. CONCLUSIONS
Raman spectra of L-leucine crystal were investigated for the interval 50 – 3100 cm−1 (for wavenumbers higher than
3100 cm−1and up to 3600 cm−1no band was observed) and
a tentative assignment of the modes was given. The tempera-ture evolution of the Raman spectra showed a series of mod-ifications in the internal mode region at about 353 K. In this same temperature changes in the external mode region fur-nished evidence for a structural phase transition undergone by L-leucine crystal. A change of symmetry from the C2to the Cspoint group through the appearance of TO modes at high
temperatures is suggested to explain the mechanism of the phase transition. This physical observation puts L-leucine in the same class of L-valine crystal among the aliphatic amino acid crystals which present at least one type of structural change. In another class it is possible to find L-alanine [6], D-alanine [21], D-valine [22] and L-isoleucine [8], which are stable under a very large range of temperature (at least for low-temperature conditions).
VI. ACKNOWLEDGEMENTS
We thank Dr. J. Ramos Gonc¸alves for a critical reading of the manuscript. Financial support from FUNCAP and CNPq is gratefully acknowledged.
[1] S.B. Monaco, L.E. Davis, S.P. Velsko, F.T. Wang, D. Eimerl, and A. Zalkin, J. Cryst. Growth85, 252 (1987).
Kennedy, IEEE J. Quantum Electron.25, 179 (1989).
[3] E.N. Kolesnik, S.V. Goryainov, and E.V. Boldyreva, Dokl. Phys. Chem.404, 169 (2005).
[4] S.A. Moggach, D.R. Allan, C.A. Morrison, S. Parsons, and L. Sawyer, Acta Crystallogr. B61, 58 (2005).
[5] C. Murli, S. Thomas, S. Venkateswaran, and S.M. Sharma, Physica B.364, 233 (2005).
[6] M. Barthes, H.N. Bordallo, F. D´enoyer, J.-E. Lorenzo, J. Zac-caro, A. Robert, and F. Zontone, Eur. Phys. J. B37, 375 (2004). [7] M.S. Lehmann, T.F. Koetzle, and W.C. Hamilton, J. Am.
Chem. Soc. 94, 2657 (1972).
[8] F.M. Almeida, P.T.C. Freire, R.J.C. Lima, C.M.R. Rem´edios, J. Mendes, and F.E.A. Melo, J. Raman Spectrosc. 37, 1296 (2006).
[9] M. Barthes, A.F. Vik, A. Spire, H.N. Bordallo, and J. Eckert, J. Phys. Chem. A106, 5230 (2002).
[10] A.M.R. Teixeira, P.T.C. Freire, A.J.D. Moreno, J.M. Sasaki, A.P. Ayala, J. Mendes, and F.E.A. Melo, Solid State Commun. 116, 405 (2000).
[11] J.A. Lima, P.T.C. Freire, R.J.C. Lima, A.J.D. Moreno, J. Mendes, and F.E.A. Melo, J. Raman Spectrosc. 36, 1076 (2005).
[12] D. Bougeard, Ber. Bunsen-Ges. Phys. Chem, Chem. Phys.87, 279 (1983).
[13] M.M. Harding, R.M. Howieson, Acta Cryst. B32, 633 (1976). [14] A. Pawlukojc, J. Leciejewicz, and I. Natkaniec, Spectroc. Acta
A52, 29 (1996).
[15] G.A. Jeffrey, An Introduction to Hydrogen Bonding, Oxford University Press, New York, 1997.
[16] J. Bernstein,Polymorphism in Molecular Crystals,Oxford Uni-versity Press, Oxford, 2002.
[17] J.M. Souza, P.T.C. Freire, H.N. Bordallo, and D.N. Argyriou, J. Phys. Chem. B111, 5034 (2007).
[18] R.J.C. Lima, P.T.C. Freire, J.M.Sasaki, F.E.A. Melo, J. Mendes, and R.L. Moreira, J. Raman Spectrosc.32, 751 (2001). [19] D.L. Rousseau, R.P. Bauman, and S.P.S. Porto, J. Raman
Spec-trosc.10, 253 (1981).
[20] M. Coll, X. Solans, M. Font-Altaba, and J.A. Subirana, Acta Cryst.C42, 599 (1986).
[21] C.C. Wilson, D. Myles, M. Ghosh, L.N. Johnson, and W. Wang, New J. Chem.29, 1318 (2005)