Effect of Nd
3+Concentration on the Physical and Absorption Properties
of Sodium-Lead-Borate Glasses
S. Mohan∗,a, K. S. Thindb, and G. Sharmab
aLecturer in Physics, BBK DAV College for Women, Amritsar, India bDepartment of Physics, Guru Nanak Dev University, Amritsar, India
Received on 20 October, 2007
The effect of increasing the rare earth ion concentration on the physical and spectroscopic properties of Nd3+doped sodium-lead-borate glasses have been studied for the compositions (10-x) Na2O–30PbO–60B2O3– xNd2O3, where x = 1.00, 1.25, 1.50, 1.75 and 2.00 mol %. Optical band gaps, cut-off wavelengths and various spectroscopic parameters (E1,E2,E3, F2, F4, F6andξ4f)have been determined from the room temperature absorption spectra. Judd-Ofelt theory has been employed to determine the intensity parametersΩ2, Ω4 and Ω6which in turn are used to evaluate radiative transition probability (A), branching ratio (β) and radiative life-time (τR)for the fluorescent level4F3/2. TheΩ2parameter and hence the non-symmetric component of electric field acting on Nd3+ion is found to be highest for glass with 1.75 mol% of Nd
2O3. Because of the poor resolu-tion of hypersensitive transiresolu-tion, the covalency of the Nd-O bond has been characterized by the relative intensity of4I9/2→4F7/2,4S3/2. The highest covalency has been predicted for glass with 2 mol% Nd2O3. The radiative properties are found to improve with an increase in concentration of Nd2O3for the present study.
Keywords: Optical materials; Glasses; Optical properties; Judd-Ofelt theory
I. INTRODUCTION
Physical and spectroscopic properties of silicate, borate and phosphate glasses doped with various rare earth (RE3+)ions
have been extensively investigated in the past, and many tech-nological and commercial applications have been realized [1-4]. Neodymium has been most widely studied as doping agent and has come out to be most applicable for laser action, since neodymium lasers can operate with high efficiency, even at room temperature.
Since, a maximum laser output requires an optimum con-centration of Nd3+it becomes important to study the spectro-scopic properties as a function of concentration of rare earth ions. Both higher and lower concentrations lead to lower laser efficiencies. The lower efficiencies at higher concentrations are due to nonradiative self-quenching process.
Borate glass is a particularly suitable optical material be-cause of its high transparency, low melting point, high ther-mal stability, different coordination numbers, and good sol-ubility of rare-earth ions [5–6]. Further, heavy metal oxide glasses have reduced phonon energy. Thus, the incorporation of heavy metal oxides such as PbO or Bi2O3into the borate
glass matrix leads to an increase in its quantum efficiency of luminescence from the excited states of rare-earth ions. Fur-ther, RE-doped alkali borate glasses are interesting for study-ing effects of alkali ions on the glass formstudy-ing network, partic-ularly around the rare-earth ions. It is well established that the addition of an alkali oxide has a strong influence on the boron coordination and the structural groups, depending on the type and concentration of the alkali oxide [7].
Saisudha et al. [8] have investigated the effect of the lead borate matrix on the optical properties of the Nd3+ions. Large stimulated emission cross sections have been reported [9] stressing the suitability of different Nd3+ doped lead borate and bismuth borate glasses for laser action. Studies of NMR and fluorescence of Nd3+doped binary alkali borate glasses
have also been published [10, 11]. However, to the best of our knowledge, rare earth doped alkali lead borate glasses have not been studied in any great detail. Motivated by these considerations we have prepared sodium-lead borate glasses doped with Nd3+, and studied the effects of the Nd3+ concen-tration on physical and spectroscopic properties.
II. EXPERIMENTAL
A series of Nd3+doped sodium-lead-borate glasses of the type (10-x) Na2O–30PbO–60B2O3–xNd2O3, where x = 0.5,
1.0, 1.5 and 2 mol % were prepared by the melt quench-ing technique. Appropriate amounts of the raw materials, Na2CO3, PbO, B2O3and Nd2O3of 99.9 % purity, were
thor-oughly mixed and ground in an agate mortar in 20 g batches. The prepared batches were heated in a silica crucible at 450– 500oC for 2 hours to ensure decarbonisation of the sodium carbonate. The temperature was then raised and maintained at 1000oC for about one hour. The mixture was occasion-ally stirred to ensure homogeneous mixing of all constituents and to obtain bubble-free samples. Finally, the mixture was poured into a preheated brass mould and annealed near the glass transition temperature in order to eliminate internal me-chanical stress. Samples of good optical quality were selected and sliced, grinded and polished in order to study their spec-troscopic properties. The chemical compositions of the sam-ples are summarized in Table 1.
By applying Archimedes principle, the densities of the pre-pared samples were measured with benzene as the immersion liquid. The density was calculated using the formula:
ρ= Wa Wa−Wb
×ρb (1)
TABLE I: Chemical composition of glasses
Composition in mol % Glass
Na2O PbO B2O3 Nd2O3
NPBN1 9.00 30 60 1.00
NPBN2 8.75 30 60 1.25
NPBN3 8.50 30 60 1.50
NPBN4 8.25 30 60 1.75
NPBN5 8.00 30 60 2.00
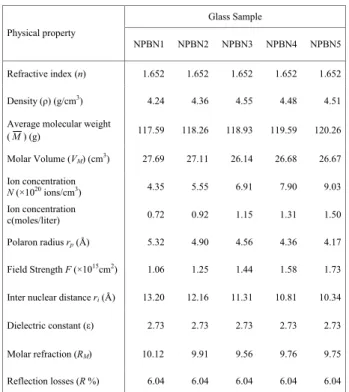
TABLE II: Physical properties of sodium-lead-borate glasses con-taining varying amounts of Nd3+ions.
Glass Sample Physical property
NPBN1 NPBN2 NPBN3 NPBN4 NPBN5
Refractive index (n) 1.652 1.652 1.652 1.652 1.652
Density (*) (g/cm3) 4.24 4.36 4.55 4.48 4.51
Average molecular weight
(M) (g) 117.59 118.26 118.93 119.59 120.26
Molar Volume (VM) (cm3) 27.69 27.11 26.14 26.68 26.67
Ion concentration
N (×1020 ions/cm3) 4.35 5.55 6.91 7.90 9.03 Ion concentration
c(moles/liter) 0.72 0.92 1.15 1.31 1.50
Polaron radius rp (Å) 5.32 4.90 4.56 4.36 4.17
Field Strength F (×1015cm2) 1.06 1.25 1.44 1.58 1.73
Inter nuclear distance ri (Å) 13.20 12.16 11.31 10.81 10.34
Dielectric constant (+) 2.73 2.73 2.73 2.73 2.73
Molar refraction (RM) 10.12 9.91 9.56 9.76 9.75
Reflection losses (R %) 6.04 6.04 6.04 6.04 6.04
ρbis the density of benzene. All weight measurements were made using a Dhona single pan balance.
The refractive index was measured at a temperature of 30 oC, with an Abbe refractometer using mono-bromonaphthalene as adhesive coating. Optical absorption spectra were recorded at room temperature using a spec-trophotometer (Shimadzu), working in the UV-visible range.
III. RESULTS AND DISCUSSION
A. Physical properties
The physical properties provide an insight into the atomic arrangements in a glass network. The concentration of the rare-earth ions is an important parameter, which affects the laser gain of the host material. The number density N of the
laser-active ions i.e. the number of ions per cubic centimeter can be evaluated using the relation [12]
N(ions/cm3) =xρN¯A
M (2)
whereρis the density of the glass,NAis the Avagadro’s num-ber, x is the mole fraction of rare earth oxide and ¯Mis the average molecular weight of the glass.
Some other physical properties which include molar vol-ume (VM), polaron radius (rp), internuclear distance (ri), field Strength (F), dielectric constant (ε) and molar refraction (RM) were determined from the density, average molecular weight, refractive index and concentration of the rare-earth ions, us-ing standard formulae [12]. All the above mentioned physical properties are listed in Table 2.
The density is found to increase with the increase in con-centration of Nd3+ ions upto 1.5 mol% of Nd2O3. It then
decreases for 1.75 mol% and then again shows an increase for higher concentration of Nd2O3. A possible reason of
decrease in density could be the formation of non-bridging oxygen (NBO’s) atoms around 1.75 mol% concentration of neodymium oxide. The clustering of rare earth ions can be one of the factors which contribute to the variation in den-sity at higher concentrations. The behavior of molar volume mainly depends upon the density of glasses and as expected in the present case, it follows a trend opposite to density. The variation of density and molar volume with concentration of Nd2O3is presented in Fig. 1.
FIG. 1: Variation of density and molar volume with the concentration of Nd2O3.
The polaron radius is found to decrease with the increase in neodymium oxide content. This result agrees with the litera-ture [13]. The internuclear distance for rare earth ions shows an expected decrease on increasing Nd2O3content. The molar
B. Energy band gap and cut-off wavelength
Optical absorption spectrum of Nd3+doped
sodium-lead-borate glass in the wavelength range 400–950 nm is shown in Fig. 2. This sample contains 1 mol% Nd2O3. Spectra of
other samples are similar in shape with small differences in absorbance.
FIG. 2: Room temperature absorption spectra of sodium-lead-borate glass containing 1mol% of Nd2O3.
Optical band gaps for direct and indirect transitions have been obtained following Mott and Davis [14], using the equa-tion
~ωα(ω) =B[~ω−E0]n (3)
whereBis a constant,αis the absorption coefficient,ωis the angular frequency and values of n are1/2and 2 for direct and
indirect transitions respectively.
To calculate the width of the energy tail,∆E, of the density of states, the model proposed by Urbach [15] and Tauc [16] is followed. The following relation has been used to determine the width of the energy tail:
ln(α) =C+~ω
∆E (4)
whereCis a constant.
Values of direct and indirect mobility gap, width of mobil-ity tail and the cut-off wavelength for the present glass system are presented in Table 3. The indirect and direct mobility gap both show a maximum for 2 mol% and a minimum for 1mol% concentration of Nd2O3. The direct mobility gap shows an
increase upto 1.5 mol%, decreases for 1.75 mol% and then again shows an increase. The indirect mobility gap does not follow a uniform variation. The variations of cut-off wave-length agree with the trend followed by direct mobility gap. The cut-off wavelength for various concentrations of Nd3+in sodium-lead-borate glasses is presented in Fig. 3.
TABLE III: Optical band gaps, width of tail and cut-off wavelength for glasses.
Glass Sample Parameter
NPBN1 NPBN2 NPBN3 NPBN4 NPBN5
Indirect mobility gap
Eind (eV) 3.14 3.23 3.21 3.24 3.37
Direct mobility gap
Edir (eV) 3.32 3.40 3.44 3.42 3.50
Width of tail
(&E) (eV) 0.19 0.15 0.15 0.08 0.06
Cut-off Wavelength
(nm) 373 368 362 363 361
FIG. 3: Cut-off wavelength for sodium-lead-borate glasses contain-ing varycontain-ing amounts of Nd2O3.
C. Absorption spectroscopic parameters
A comparison of the optical absorption spectra of the present glass series with the standard wavelength chart of Nd3+ [17], result in the identification of following spectro-scopic transitions:
4F
3/2, 4F5/2+2H9/2, 4S3/2 +4F7/2, 4F9/2, 2H11/2, 4G5/2
+2G
7/2, 2K13/2+4G7/2, 4G9/2,2D3/2, 4G11/2, 2P1/2 ← 4I
9/2.
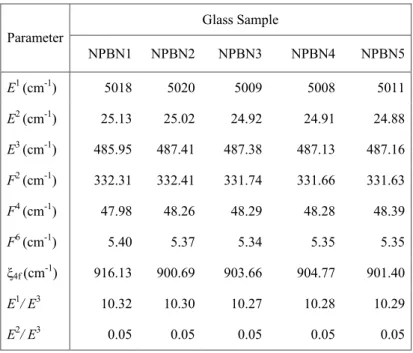
limits. These energy values are presented in Table 4. The spectroscopic parameters along with hydrogenic ratiosE1/E3 andE2/E3 determined for different concentrations of Nd3+
are presented in Table 5. The, hydrogenic ratios which in-dicate the radial properties of Nd3+, are approximately the same for all compositions, indicating that the radial properties of Nd3+remain unperturbed with the change in rare earth ion concentration.
D. Spectral intensities and Judd-Ofelt parameters
The intensity of an absorption band can be expressed in terms of the ‘oscillator strength’. The experimental oscillator strength (fmeas)of the absorption transitions has been deter-mined using [19]
fmeas=4.32×10⁻⁹ Z
ε(ν)dν, (5) where ε(ν) = OD/ct is the molar extinction coefficient at mean energy ν(cm−1), with OD being the optical density, cbeing the molar concentration of the rare-earth ions, andtis the optical length of the glass. The intensities for all absorp-tion bands observed in the present case have been evaluated using the area method.
According to Judd-Ofelt theory [20, 21] the oscillator strength of a transition between the initial ground stateJ man-ifold|(S;L)Jiand a finalJ′manifold|(S′;L′)J′ican be calcu-lated by the relation:
fcal(aJ,bJ′) = 8π
2mcν
3h(2J+1)
·(n2+2)2
9n Sed+nSmd
¸
, (6)
where (2J+1) is the degeneracy of the ground stateof the Nd3+ ions,nis the refractive index of the medium,mis the mass of the electron, andνis the mean energy of the transition,Sed is the electric dipole line strength andSmdis the magnetic dipole line strength. The latter can be neglected in comparison toSed, since in the present case for Nd3+ion, the bands produced by the magnetic dipole mechanism have very low spectral inten-sity compared to that of the electric dipole bands.Sed is given by
Sed£
(S,L)J:(S′,L′)J′¤
=
∑
λ=2,4,6
Ωλ
¯ ¯ ¯ D
(S,L)J
° ° °U
(λ)°° °(S
′,L′)J′E¯¯ ¯ 2 (7) where ¯ ¯ ¯ D
(S,L)J
° ° °U
(λ)°° °(S
′,L′)J′E¯ ¯ ¯ 2
(8) represents the reduced matrix elements of a unit tensor op-erator evaluated in the intermediate coupling approximation. Since these reduced matrix elements are host invariant, we have used the values reported by Carnall et al. [22]. The val-ues of experimental and theoretical oscillator strengths along
with their rms deviations are presented in Table 6. The smaller rms deviations indicate good agreement between the exper-imental and calculated oscillator strengths which shows the validity of Judd-Ofelt theory.
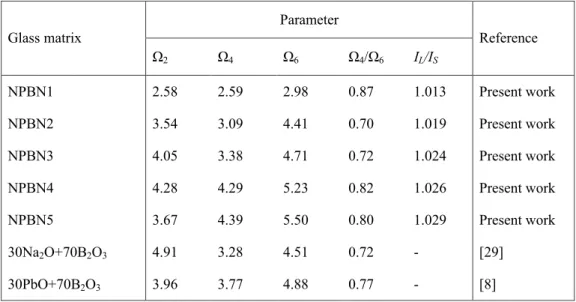
Substituting the oscillator strengths calculated from the ab-sorption spectra for fcal, and using the values of reduced matrix elements and other parameters, the Judd-Ofelt inten-sity parameters Ωλ(λ=2,4,6)have been determined by least squares method. These parameters along with the intensity pa-rameters of some related borate glasses [29, 8] are presented in Table 7. The table also includes the spectroscopic quality factor (Ω4/Ω6), which determines the lasing efficiency of the
host.
The position, intensity and shape of certain electric dipole transitions of rare earth ions are found to be very sensitive to the environment of the rare earth ion. Such transitions are termed as hypersensitive transitions by Jorgensen and Judd [23]. These transitions are found to obey the selection rule ∆J≤2,∆L≤2 and∆S=0 [23]. These transitions are associated with a very large value of the reduced matrix element°°U2
° ° 2
; hence hypersensitivity is much related with theΩ2parameter.
For Nd3+ion,4I9/2→ 4G5/2+2G7/2is the
hypersensi-tive transition since it obeys the required selection rule. As observed from Table, the intensity of hypersensitive transition shows a maximum for 1.75 mol% and a minimum for glass containing 1 mol % of Nd2O3. This indicates that the
non-symmetric component of electric field acting on Nd3+ion is low for glass containing 1 mol% and high for 1.75 mol% of Nd2O3. The possible reason could be the formation of NBO’s
around 1.75 mol% concentration of Nd2O3as discussed in
ex-plaining the density of the present glass system. The creation of non-bridging oxygen from bridging oxygen increases the asymmetry of the bond to the neighboring network cation. A decrease in intensity of hypersensitive transition for 2 mol% Nd2O3glass can be because of clustering of rare earth ions
for higher concentrations. The values ofΩ2are found to be
proportional to the intensities of the hypersensitive transition, in accordance with the theory [24].
Krupke [25] pointed out that the transition intensities of
4I
9/2→ 4G5/2+2G7/2and4I9/2→4F7/2,4S3/2 are
deter-mined mainly byΩ2andΩ6respectively. The Stark splitting
due to the crystal field splits these transitions in the absorption spectra into two peaks. The peak intensity ratio of the longer (IL)and shorter (IS)wavelength components are designated as IL/IS.
In the present case the Stark splitting of the hypersensitive transition4I
9/2→ 4G5/2+2G7/2is poorly resolved. Thus,
the Ω2 parameter is dominated by the crystal-field
parame-ters rather than the covalency parameparame-ters. Consequently, no conclusion can be drawn for the covalency of the Nd–O bond using this parameter.
Hence a variation of the spectral profile of the transition
4I
9/2→4F7/2,4S3/2is investigated. This variation is presented
in Fig. 4. A higher value of intensity ratioIL/ISand intensity parameterΩ6indicates a higher covalency of the Nd-O bond
for glass containing 2 mol% of Nd2O3. A lowest covalency is
TABLE IV: Theoretically calculated and experimentally observed energy levels (cm–1)for various concentrations of Nd3+ions in sodium lead borate glasses.
NPBN1 NPBN2 NPBN3 NPBN4 NPBN5 Levels
Eexp Eth Eexp Eth Eexp Eth Eexp Eth Eexp Eth
4F
3/2 11429 11381 11429 11394 11416 11388 11429 11395 11416 11391
4F
5/2+2H9/2 12439 12470 12438 12460 12438 12456 12438 12467 12438 12464
4S
3/2 +4F7/2 13495 13482 13477 13458 13477 13456 13477 13468 13477 13467
4F
9/2 14706 14824 14684 14775 14684 14773 14684 14785 14684 14786
2H
11/2 16026 16011 15949 15955 15949 15956 15949 15955 15949 15959
4G
5/2 +2G7/2 17123 17177 17123 17183 17123 17188 17123 17187 17123 17189
2K
13/2+4G7/2 19011 18935 19011 18925 19011 18918 19011 18913 19011 18912
4G
9/2 19493 19540 19493 19508 19493 19508 19493 19521 19493 19520
2D
3/2+ 2G9/2 21142 21268 21142 21253 21097 21227 21097 21227 21097 21225
4G
11/2 21739 21637 21645 21584 21645 21582 21692 21602 21692 21601
2P
1/2 23256 23168 23256 23138 23202 23113 23202 23115 23202 23115
rms
deviation ±95 ±95 ±92 ±96 ±86
TABLE V: Spectroscopic parameters of Nd3+in sodium-lead-borate glasses.
Glass Sample Parameter
NPBN1 NPBN2 NPBN3 NPBN4 NPBN5
E1 (cm-1) 5018 5020 5009 5008 5011
E2 (cm-1) 25.13 25.02 24.92 24.91 24.88
E3 (cm-1) 485.95 487.41 487.38 487.13 487.16
F2 (cm-1) 332.31 332.41 331.74 331.66 331.63
F4 (cm-1) 47.98 48.26 48.29 48.28 48.39
F6 (cm-1) 5.40 5.37 5.34 5.35 5.35
!4f (cm-1) 916.13 900.69 903.66 904.77 901.40
E1/ E3 10.32 10.30 10.27 10.28 10.29
TABLE VI: Experimental and calculated oscillator strengths of Nd3+doped sodium lead borate glasses.
NPBN1 NPBN2 NPBN3 NPBN4 NPBN5 Transitions
from ground
state 4I9/2# fexp fcal fexp fcal fexp fcal fexp fcal fexp fcal
4
F3/2 1.32 1.40 1.72 1.76 2.16 1.93 2.24 2.35 2.30 2.44
4
F5/2+2H9/2 4.71 4.44 6.34 6.19 6.74 6.86 7.98 7.64 8.16 8.01
4
S3/2 +4F7/2 4.38 4.57 6.59 6.68 7.53 7.43 7.75 7.98 8.23 8.36
4
F9/2 0.51 0.38 0.48 0.54 0.70 0.60 0.68 0.66 0.58 0.61
2
H11/2 - - 0.14 0.14 0.14 0.15 0.25 0.17 0.20 0.18
4
G5/2 +2G7/2 11.69 11.67 15.25 15.26 17.21 17.19 19.30 19.28 18.31 18.32
2
K13/2+4G7/2 2.36 2.91 3.29 3.82 3.51 4.24 4.10 4.89 4.03 4.31
4
G9/2 1.40 0.86 2.02 1.13 2.3 1.25 2.36 1.45 2.49 1.62
2
D3/2+ 2G9/2 0.48 0.63 0.70 0.84 0.70 0.93 0.89 1.08 0.91 1.11
4
G11/2 0.23 0.14 0.49 0.19 0.52 0.21 0.51 0.24 0.61 0.24
2
P1/2 0.24 0.35 0.34 0.42 0.41 0.46 0.55 0.58 0.49 0.63
rms deviation ±0.37 ±0.39 ±0.48 ±0.46 ±0.37
TABLE VII: Judd-Ofelt intensity parameters of sodium lead borate glasses doped with various concentrations of Nd3+ions. Parameter
Glass matrix
"2 "4 "6 "4/"6 IL/IS
Reference
NPBN1 2.58 2.59 2.98 0.87 1.013 Present work
NPBN2 3.54 3.09 4.41 0.70 1.019 Present work
NPBN3 4.05 3.38 4.71 0.72 1.024 Present work
NPBN4 4.28 4.29 5.23 0.82 1.026 Present work
NPBN5 3.67 4.39 5.50 0.80 1.029 Present work
30Na2O+70B2O3 4.91 3.28 4.51 0.72 - [29]
30PbO+70B2O3 3.96 3.77 4.88 0.77 - [8]
E. Radiative properties
TheΩλvalues obtained from the absorption measurements have been used to calculate the radiative transition probabil-ity, branching ratios and radiative lifetime of the excited state
4F 3/2.
The radiative transition probabilityA(aJ,bJ′)for the
emis-sion from initial stateaJto a final statebJ′ for an electric di-pole emission has been determined using the relation [26]
A(aJ,bJ′) = 64π
4e2
3hλ3
o(2J+1)
n(n2+2)2
TABLE VIII: Radiative transition probability (A), total transition probability (AT), radiative lifetime (τR)and branching ratio (βR)for the excited4F3/2of Nd3+ion in sodium lead borate glasses.
NPBN1 NPBN2 NPBN3 NPBN4 NPBN5 Borate
Glass [30]
Lead Borate [8] Transitions
from
4
F3/2# A(s-1) !R A(s-1) !R A(s-1) !R A(s-1) !R A(s-1) !R !R !R
4I
15/2 10 0.005 15 0.005 17 0.005 18 0.005 19 0.005 0.005 0.005
4I
13/2 197 0.097 291 0.106 324 0.107 345 0.100 363 0.101 0.009 0.101
4
I11/2 975 0.483 1388 0.506 1541 0.508 1691 0.490 1770 0.492 0.490 0.506
4
I9/2 835 0.414 1047 0.382 1151 0.379 1398 0.405 1442 0.401 0.420 0.388
AT (s-1) 2016 2742 3033 3452 3594 2386 3273
"R(µs) 496 365 330 290 278 419 306
NPBN1 NPBN2 NPBN3 NPBN4 NPBN5
R
elativ
e o
p
tical
d
en
sit
y
725 730 735 740 745 750 755 760 765 Wavelength (nm)
FIG. 4: Spectral profile of the transition4I9/2→4F7/2, 4S3/2 for various concentrations of Nd2O3in sodium-lead-borate glasses.
∑
λ=2,4,6
Ωλ
¯ ¯ ¯ D
(S,L)J°° °U
(λ)°° °(S
′,L′)J′E¯¯ ¯ 2
(9)
whereλois the peak wavelength of the emission bands. The total radiative emission probability AT(aJ)of an ex-cited state is given by the sum of the A(aJ,bJ′)terms cal-culated over all the terminal statesb.
AT(aJ) =
∑
bJ′A(aJ,bJ′) (10)
The fluorescence branching ratioβR has been determined
using:
βR=
A(aJ,bJ′) AT(aJ)
(11)
The radiative lifetimeτRof the emission state is given as
τR= 1 AT(aJ)
(12)
Radiative transition probability (A), total transition proba-bility (AT), radiative lifetime (τR)and branching ratio (βR)for the excited4F
3/2are summarized in Table 8. A comparison
of (βR)with vitreous borate [30] and lead borate [8] glasses has been made in the same table. The Ω2 parameter
be-comes independent in characterizing the fluorescence proper-ties of4F3/2 → 4IJtransitions because the values of ten-sor operator°°U2
° ° 2
are zero for all these transitions. Hence, the radiative properties depend onΩ4andΩ6parameters
be-cause of the triangle rule |J−J′| ≤λ≤ |J+J′| [27]. The
4F
3/2 → 4I11/2transition is the potential lasing transition
(λ=1.06µm) for Nd3+ion. The radiative transition probabil-ity is found to increase with increase in content of Nd2O3.
It shows a maximum for NPBN5 i.e. the glass containing 2 mol% concentration of Nd2O3. The radiative lifetime is
inversely proportional to the linear combination of Ω4 and
IV. CONCLUSIONS
We have determined physical and spectroscopic properties for sodium-lead-borate glasses doped with varying amounts of Nd3+. Density measurements predict the formation of non-bridging oxygen atoms around 1.75 mol% concentration of Nd2O3. The indirect and direct mobility gap both show a
maximum for 2 mol% and a minimum for 1mol% concentra-tion of Nd2O3. Absorption spectra have been analyzed using
the Judd-Ofelt theory. TheΩ2parameter and hence the
non-symmetric component of electric field acting on Nd3+ion is found to be highest for 1.75 mol% of Nd2O3. The position
and shape of the hypersensitive transition does not change
ap-preciably. Therefore, the covalency of the Nd-O bond has been determined from the spectral profile of the4I9/2→4F
7/2, 4S
3/2 transition. A higher value of intensity ratioIL/IS and intensity parameterΩ6indicates highest covalency of the
Nd-O bond for glass containing 2 mol% of Nd2O3. The
spec-troscopic quality factorX=Ω4/Ω6is found to be 2–3 times
larger than that of the standard laser host for Nd3+, namely YAG withX=0.3. A maximum of radiative transition prob-ability and a minimum of radiative lifetime are observed for glass containing 2 mol% of Nd2O3. The variation of the
spec-troscopic properties suggests that it is possible to enhance the lasing properties of Nd3+ in sodium-lead-borate glasses by varying the concentration of the rare-earth ions.
[1] Y. Nageno, H. Takebe, and K. Morinaga, J. Am. Ceram. Soc.
76, 3081 (1993).
[2] A. R. Devi, C. K. Jayasankar, Mater. Chem. Phys. 42, 106 (1995).
[3] V. Mehta, G. Aka, A. L. Dawar, and A. Mansingh, Opt. Mater.
12, 53 (1999).
[4] E. Pecoraco, J. A. Sampaio, L. A. O. Nunes, S. Gama, and M. L. Baesso, J. Non-Cryst. Solids.277, 7 (2000).
[5] N. Soga, K. Hirao, M. Yoshimoto, and H. Yamamoto, J. Appl. Phys.63, 4451 (1988).
[6] S. M. Kaczmarek, Opt. Mat.19, 189 (2002).
[7] J. Zhong and P. J. Bray, Change in boron coordination in alkali borate glasses and mixed alkali effects, as elucidated by NMR, J. Non-Cryst. Solids111, 67 (1989).
[8] M. B. Saisudha, J. Ramakrishna, Phys. Rev. B53, 6186 (1996). [9] M. B. Saisudha, K. S. R. K. Rao, H. L. Bhat, and J.
Ramakr-ishna, J. Appl. Phys.80, 4845 (1996).
[10] S. Mukhopadhyay, K. P. Ramesh, R. Kannan, and J. Ramakr-ishna, Phys. Rev. B70, 224202 (2004).
[11] Y. C. Ratnakaram, R. P. S. Chakradhar, K. P. Ramesh, J. L. Rao, and J. Ramakrishna, J. Phys. Cond. Matt.15, 6715 (2003). [12] A. S. Rao, Y. N. Ahammed, R. R. Reddy, and T. V. R. Rao, Opt.
Mater.10, 245 (1998).
[13] A. S. Budi, R. Hussin, and M. R. Sahar, Electrical properties of neodymium phosphate glass semiconductor electronics, Pro-ceedings ICSE,19, 247 (2002).
[14] N. F. Mott, E. A. Davis,Electronic processes in non-crystalline
materials, Clarendon Press (1979). [15] F. Urbach, Phys. Rev.92, 1324 (1953). [16] J. Tauc, J. Non-Cryst. Solids149, 97 (1987).
[17] G. H. Dieke,Spectra and Energy Levels of Rare Earth Ions in Crystals, Interscience, New York (1968).
[18] E. Y. Wong, J. Chem. Phys.35, 544 (1961).
[19] Y. C. Ratnakaram, A. Vishwanadha Reddy, J. Non-Cryst. Solids
277, 142 (2000).
[20] B. R. Judd, Phys. Rev.127, 750 (1962). [21] G. S. Ofelt, J. Chem. Phys.37, 511 (1962).
[22] W. T. Carnall, P. R. Fields, and K. Rajnak, J. Chem. Phys.49, 4424 (1968).
[23] C. K. Jorgensen, B. R. Judd, Mol. Phys.8, 281 (1964). [24] R. D. Peacock,Structure and Bonding,vol. 22, Springer, Berlin,
(1975).
[25] W. F. Krupke, Phys. Rev.145, 325 (1966).
[26] D. C. Brown, High Peak Power Nd: Glass Laser Systems, Springer, Berlin, (1981).
[27] Y. C. Ratnakaram, N. Sudharani, J. Phys. Chem. Solids59, 215 (1998).
[28] M. J. Weber, J. D. Meyers, and D. H. Blackburn, J. Appl. Phys.
52, 2944 (1981).
[29] H. Takebe, K. Morinaga, and T. Izumitani, J. Non-Cryst. Solids,
178, 58 (1994).