Article
Printed in Brazil - ©2012 Sociedade Brasileira de Química0103 - 5053 $6.00+0.00
A
*e-mail: [email protected]
Lodenafil Carbonate Tablets: Optimization and Validation of a
Capillary Zone Electrophoresis Method
Cristiane F. Codevilla,* Pâmela Cristina L. Ferreira, Maximiliano S. Sangoi, Pedro Eduardo Fröehlich and Ana Maria Bergold
Faculdade de Farmácia, Universidade Federal do Rio Grande do Sul, 90610-000 Porto Alegre-RS, Brazil
Um método simples de eletroforese capilar de zona (CZE) foi desenvolvido e validado para análise de carbonato de lodenafila em comprimidos. A metodologia de superfície de resposta foi utilizada para a otimização do pH, concentração do tampão, voltagem e temperatura. O método utilizou como eletrólito, tampão borato 50 mmol L-1, pH 10, voltagem de 15 kV. A separação foi
efetuada em capilar de sílica fundida mantida a 32,5 oC e o comprimento de onda de detecção foi
de 214 nm. O método foi validado, demonstrando especificidade, linearidade (r = 0,9995), precisão (desvio padrão relativo inferior a 2%) e exatidão (99,95%). O método demonstrou ser robusto, através de avaliação por planejamento fatorial fracionário. O método CZE proposto foi aplicado com sucesso para a análise quantitativa de carbonato de lodenafila em comprimidos e os resultados, comparados com os métodos por cromatografia líquida de alta eficiência e espectrofotometria no ultravioleta, não apresentaram diferença significativa.
A simple capillary zone electrophoresis (CZE) method was developed and validated for the analysis of lodenafil carbonate in tablets. Response surface methodology was used for optimization of the pH and concentration of the buffer, applied voltage and temperature. The method employed 50 mmol L-1 borate buffer at pH 10 as background electrolyte with an applied voltage of 15 kV.
The separation was carried out in a fused-silica capillary maintained at 32.5 oC and the detection
wavelength was 214 nm. The method was validated showing specificity, linearity (r = 0.9995), precision (relative standard deviation less than 2%) and accuracy (99.95%). The method proved to be robust by a fractional factorial design evaluation. The proposed CZE method was successfully applied for the quantitative analysis of lodenafil carbonate in tablets and the results compared to the high performance liquid chromatography and ultraviolet spectrophotometric methods, showed non-significant differences.
Keywords: capillary zone electrophoresis, experimental design, lodenafil carbonate, optimization, validation
Introduction
Capillary electrophoresis (CE) has become one of the most advanced separation techniques for pharmaceutical analysis, although quality control analysis of pharmaceuticals currently is performed predominantly
with high-performance liquid chromatography (HPLC).1,2
It has been proven that CE is a useful and reliable alternative and a complementary technique to HPLC in many areas, including the determination of the active pharmaceutical ingredients, drug related impurities, enantiomeric separations, identity confirmation and
stoichiometry determination.3-6 CE has many advantages
such as high efficiency, high resolution, rapid analysis and
low consumption of sample and reagents.7,8
The optimization of separation with CE is complex and difficult, because a high number of parameters, such as temperature, pH, voltage and buffer composition affect the separation. Rather than following the conventional monovariate approach used to adjust the parameters, thus involving a large number of independent analyses, one could advantageously replace the procedure by statistically designed experimental protocols, in which several factors are simultaneously varied. The use of an experimental design can be extremely beneficial in developing capillary
Response surface methodology is a collection of statistical and mathematical techniques useful for developing, improving and optimizing processes, interpreting the relationships between the responses and factor effects and simultaneously optimizing the levels of
variables to achieve the best system performance.10,11
Erectile dysfunction (ED) is defined by the National Institutes of Health as the inability to achieve and maintain
an erection sufficient for satisfactory sexual intercourse.12
ED is not a life-threatening disorder, but it influences the patient’s daily routine, social interactions, well-being and
quality of life.13 It may often be the first manifestation of
important systemic (in advancing age) or relational (in younger age) pathologies and it is considered a possible marker of clinically undiagnosed disease, thus representing
the ‘tip of the iceberg’ of a systemic vascular disorder.14,15
In 1998, a new class of drugs, the phosphodiesterase type 5 inhibitors (PDE5 inhibitors) was introduced. The PDE5 inhibitors have revolutionized the way in which
men with ED can be treated.16,17 The advent of these highly
efficacious and relatively safe compounds had a profound
impact on the diagnosis and treatment of ED.18
Lodenafil
(bis-(2-{4-[4-ethoxy-3-(1-methyl-7-oxo-3-propyl-6,7-dihydro-1H-pyrazolo
[4,3-d]pyrimidin-5-yl)-benzenesulfonyl]piperazin-1-yl}-ethyl) carbonate (Figure 1) is a PDE5 inhibitor developed in Brazil, which is a dimer formed by two lodenafil molecules linked by a carbonate bridge. Lodenafil carbonate (LOC) is a product that after
ingestion delivers the active compound lodenafil.19,20
Little has been published until now concerning the
detection of LOC in pharmaceutical preparations21,22
and biological samples.19 These studies involve UV
spectrophotometric and HPLC method for the determination of LOC.
This work proposes the development, optimization and validation of a capillary zone electrophoresis
(CZE) method for the determination of LOC in tablets, establishing a comparison with the validated HPLC and UV spectrophotometric methods.
Experimental
Chemicals and reagents
LOC (lodenafil carbonate) used as reference substance was kin dly supplied by Cristália Produtos Químicos Farmacêuticos LTDA (São Paulo, Brazil) and nimesulide reference standard, used as internal standard (IS), was purchased from United States Pharmacopeia (USP,
Rockville, USA). The tablets of Helleva® (Cristália
Produtos Químicos Farmacêuticos LTDA, São Paulo,
Brazil) containing LOC (80 mg per tablet, excipients:
calcium phosphate dibasic dihydrate, povidone, lactose, colloidal silicon dioxide, sodium croscarmellose, microcrystalline cellulose and magnesium stearate) were obtained commercially. All chemicals used were of pharmaceutical or special analytical grade. Throughout the study, water was obtained from a Milli-Q system from Millipore (Bedford, USA). Before analysis, all the solutions
were filtered through 0.22µm Millex filter (Millipore).
Apparatus and electrophoretic conditions
CZE (capillary zone electrophoresis) experiments
were performed on an Agilent 3DCE apparatus (Agilent
Technologies, Waldbronn, Germany) equipped with an autosampler, a photodiode array (PDA) detector, and power supply able to deliver up to 30 kV. CE ChemStation software was used for instrument control, data acquisition and analysis.
Electrophoretic separations were carried out with a fused-silica capillary with 50 µm i.d. and 48.5 cm of total
length (effective length 40 cm), thermostatized at 32.5 oC,
and with detection set at 214 nm using a PDA detector. Hydrodynamic injection of sample was performed at 50 mbar for 5 s and a constant voltage of 15 kV was applied during the analysis. At the beginning of each working
day, the capillary was rinsed sequentially with 0.1 mol L-1
sodium hydroxide for 15 min, followed by water for 15 min, and then with running electrolyte solution for 15 min. To achieve high migration time reproducibility between
injections, the capillary was conditioned with 0.1 mol L-1
Background electrolyte solution preparation
The optimized background electrolyte (BGE) solution
used in this analysis was 50 mmol L-1 boric acid at pH 10.
To prepare this solution 0.154 g of boric acid was diluted with 40 mL of water. The pH was adjusted to 10 by adding
0.1 mol L-1 sodium hydroxide and the volume completed
to 50 mL with ultrapure water. The solution was daily prepared and filtered.
Preparation of reference substance solutions
Standard stock solution of LOC was prepared by accurately weighing 10 mg of LOC transferred to a 100 mL
volumetric flask with 0.1 mol L-1 sodium hydroxide
(100 µg mL-1). A standard stock solution of nimesulide
(1 mg mL-1) was prepared in methanol. All solutions were
stored at 2-8 oC, protected from light and diluted daily to
an appropriate concentration with background electrolyte solution.
Sample preparation
Twenty tablets of Helleva® were finely powdered. A
weighed portion of the powder, equivalent to 10 mg of LOC was transferred to a 100 mL volumetric flask. With the addition of 50 mL of sodium hydroxide, the mixture was sonicated for 10 min, and filtered. The sample stock solution prepared with the final concentration of
100 µg mL-1 of LOC was stored at 2-8 oC, protected from
light and diluted daily to an appropriate concentration with BGE.
Statistical software and design of experiment for method optimization
All the experimental designs, graphical and statistical analysis of the data were performed by Minitab 14 (Minitab Inc, State College, PA, USA) data analysis software system.
Factorial designs are the most useful schemes for the optimization of variables with a limited number of experiments. A variety of factorial designs are available to accomplish this task. The most successful and best among them is the central composite design, which is accomplished by adding two experimental points along each coordinate axis at opposite sides of the origin and at a distance equal to the semi-diagonal of the hyper cube of the
factorial design and new extreme values (α; low and high)
for each factor added in this design. This first experimental design was carried out to optimize the electrophoretic conditions with high sensitivity, efficiency and short run
time. A second order polynomial was used to fit the data. Treatment allocation with their respective experimental values is shown in Table 1.
Validation
To demonstrate the suitability of this method for pharmaceutical quality control, it was validated with respect to specificity, linearity, precision, accuracy, and robustness, according to the International Conference on Harmonisation (ICH) recommendations, at the optimized
operating conditions.23
Specificity
The specificity of the method was investigated by analyzing a placebo solution containing all the tablet components except LOC. In addition, the specificity was assessed by observing potential interferences between LOC and degradation products obtained, when standard solutions of LOC were stressed by acidic, basic, oxidative
and UV light conditions. Solutions of LOC in 1.0 mol L-1
hydrochloric acid and 1.0 mol L-1 sodium hydroxide
were exposed at 60 ºC for 5 h. Oxidative degradation was induced by storing the solutions in 0.1% potassium permanganate at room temperature for 15 min, protected from light. Photolytic studies were done by exposing the sample solution to a 254 nm UV lamp for 15 min, in a photostability chamber. The samples were analyzed against a freshly prepared control sample (with no degradation treatment).
Linearity
Linearity was tested on three different days at 7
concentration levels of LOC (20-80 µg mL-1) and spiked
with a constant concentration of nimesulide (50 µg mL-1)
used as internal standard. Each concentration level was injected in triplicate. The peak area ratio of LOC reference substance to the IS, against the respective reference concentrations, was used for plotting the graph, and the linearity was evaluated by the least square regression analysis.
Table 1. Nominal values corresponding to −1, 0, +1, −α and +α of central composite design for method optimization
CE factor −α − 1 0 + 1 + α
pH borate buffer 9.2 9.6 10.0 10.4 10.8
Borate buffer / (mmol L-1) 40 45 50 55 60
Capillary temperature / °C 27.5 30 32.5 35 37.5
Voltage / kV 7.5 10 12.5 15 17.5
Precision
The precision expressed as the relative standard deviation of peak area measurements was evaluated under repeatability and intermediate precision conditions. For repeatability studies, six replicate experiments were carried out on the same day. The intermediate precision was performed by comparing the results of the assay on 3 different days.
Accuracy
The accuracy of the developed method was evaluated by a recovery test. The sample solutions were fortified with three known concentrations of reference standard corresponding to 75, 100 and 125% of the sample
concentration (50 µg mL-1).
Robustness
In order to study the simultaneous variation of the factors in the considered responses, a multivariate approach using design of experiments is recommended in
robustness testing. The procedure selected was a 2-level 24-1
fractional factorial design performed by the selection of four factors, studied at two levels (high and low): borate
buffer concentration (48; 52 mmol L-1), pH borate buffer
(9.8; 10.2), capillary temperature (31; 34 ºC), and voltage (13; 17 kV). The ranges examined were small deviations from the method settings. A center point with the optimized conditions was also added to the factorial design (nine experiments). The response is the percentage of LOC in the tablets (relative to their label claimed concentration) obtained by the comparison with the reference solution in each experiment. All experiments were performed in randomized order to minimize the effects of uncontrolled factors that may introduce a bias into the response. The statistical analyses of the data were performed by the MINITAB 14 (Minitab Inc, State College, PA, USA) data analysis software.
Results and Discussion
The optimization of a CZE separation condition is a critical step, since the wide array of variables, such as applied voltage, buffer composition and temperature, can influence
the separation efficiency, migration time and resolution.24
Central composite designs are by far the most widely used methods for the optimization of CZE separations since they offer the possibility of evaluating the curvature of the data
and fitting the experimental points to response surfaces.25
The CZE method parameters for determination of the LOC were optimized to obtain the best efficiency, symmetry and resolution within the minimum analysis time. The
optimization procedure was comprised of two steps: initial experiments and experimental design.
The aim of the initial experiments was to establish the basic analytical requirements (pH range, type of buffer) of the method. Some buffer systems containing sodium phosphate, sodium citrate, sodium acetate, sodium tetraborate, ammonium acetate or boric acid were investigated in the pH range from 5-10 at different
concentrations (10-50 mmol L-1). The use of borate buffer
at a concentration of 50 mmol L-1 with pH value around
10 (at a temperature of 32.5 ºC, 12.5 kV) resulted in high sensitivity and good peak symmetry of LOC.
After a small number of runs and the selection of basic electrophoretic conditions, a central composite design was applied to optimize the main variables that could influence the LOC analyses by CZE: pH borate buffer, borate buffer concentration, capillary temperature and voltage. A response surface methodology was carried out to obtain more information and to investigate the behavior of the response around the nominal values of the factors. Response
surface methodology has the following advantages: (i) to
allow a complete study where all interaction effects are
estimated, and (ii) to give an accurate description of an
experimental region around a center of interest with validity
of interpolation.26,27 The criterion to select the optimum
values for the studied variables was based on obtaining a maximum for a multiple response function established, since LOC were easily separated from degradation products showing adequate efficiency (number of theoretical plates), tailing factor and short analysis time. Experiments were performed according to the experimental plan determined by Minitab software. Significant changes in migration time and tailing factor were observed for all the combinations, implying that these variables significantly affected the electrophoretic pattern.
From the optimization procedure, pH, buffer concentration and separation voltage were found significant
on efficiency with optimum values of 50 mmol L-1 borate
buffer at pH 10 with an applied voltage of 15 kV and capillary temperature of 32.5 ºC. Under these conditions, efficiencies higher than 80000, good symmetry (around 1.0) and lower migration time (approximately 4 min) were achieved. Some of the estimated response surfaces from which the above mentioned optimum values have been obtained are shown in Figure 2.
Method validation
Specificity
potentially interfering sample components or degradation products. The specificity was evaluated by stressing the analyte under acidic, basic, oxidative and photolytic conditions. Chromatographic runs of a placebo solution were also performed. Figure 3 shows that the acidic, basic and oxidative conditions resulted in a decreased area without any additional peak, indicating that the degradation products (DP) were not detected by UV or the degradation products did not migrate in the CZE method. The photolytic condition exhibited a significant decrease of the area, and two additional peaks were detected at 5.8 and 6.3 min (Figure 3). In all cases the purity of LOC was assessed with the PDA detector, demonstrating that the proposed method is specific for the analysis. The chromatographic run of a placebo solution showed no interference of the excipients with the elution of LOC.
Linearity
Linearity was investigated in the concentration range of
20-80 µg mL-1 for LOC, and 50 µg mL-1 of nimesulide was
added as IS in all cases. The linearity curve was defined by the equation of y = 0.019x + 0.038, where y is the peak area ratio of LOC to IS, and x is the concentration of LOC
expressed in µg mL-1. The correlation coefficient was
0.9995. The validity of the assay was verified by means of analysis of variance (ANOVA), which demonstrated significant linear regression (p < 0.05) and no significant linearity deviation (p > 0.05). The limit of detection (LOD) was based on the standard deviation of the response and the slope of the constructed calibration curve, as described in
International Conference on Harmonization guidelines.23
The LOD achieved was 1.36 µg mL-1.
Precision
The precision of the method for LOC determination was evaluated using the results obtained over 1 day of operation under the same conditions (intra-assay) and for 3 days (inter-assay). The results expressed as the relative standard deviation (RSD %) are given in Table 2, and indicate that the method has repeatability and intermediate precision.
Accuracy
A LOC sample solution was fortified with three solutions at known concentrations and at three different levels. The recovery of added standard was determined in triplicate analysis and the results are shown in Table 3.
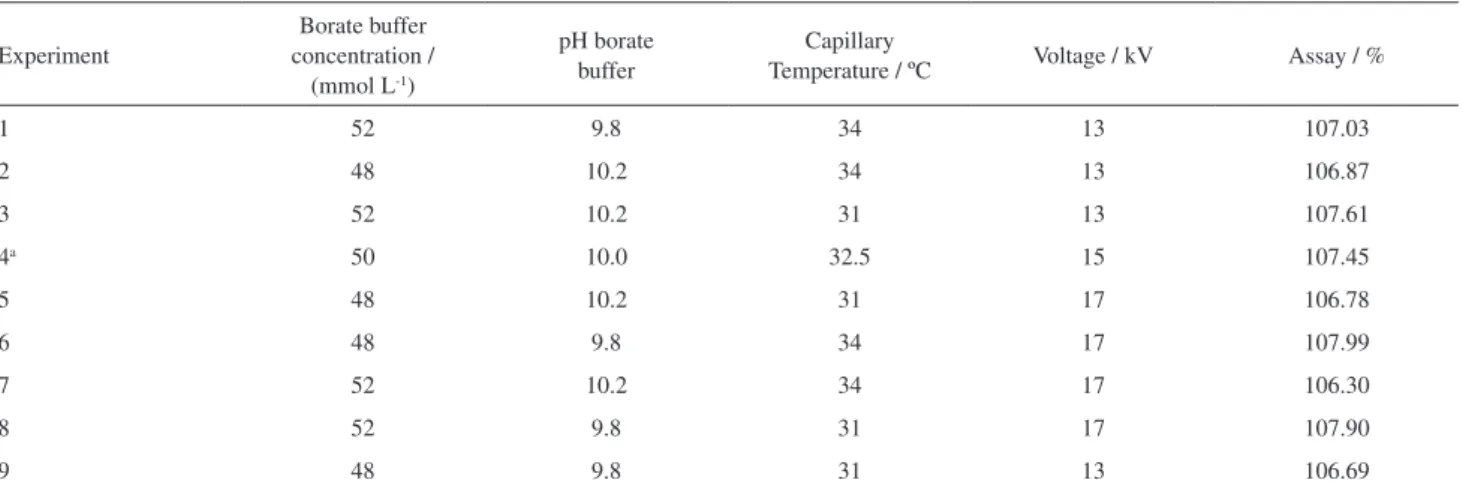
Robustness
The susceptibility to change of the analytical method developed was tested in order to evaluate the robustness.
For this purpose a 2-level 24-1 fractional factorial design was
employed. The experimental plan and the corresponding responses are summarized in Table 4.
The significance of the effects was evaluated by a Pareto chart of the standardized effects and normal probability plot of the residuals. The Pareto graph (Figure 4a) consists of bars with a length proportional to the absolute value of the estimated effect, divided by the pseudo standard error
defined by Lenth (Lenth’s PSE).28 Codes A, B, C, and D
correspond to the borate buffer concentration, pH borate buffer, capillary temperature and voltage, respectively. The combination of two codes indicates the interaction effect between the two variables. The bars were displayed based on the size of the effect, with the largest effect at the top.
The chart includes a vertical line at the critical t-value for
α equal 0.05. Effects in which the bars are smaller than the
critical t-value were not considered significant and did not
affect the response variables. Figure 4b presents the normal probability plot of residuals for LOC. At the studied ranges, the effects of the factors were not statistically significant
(α = 0.05) for the response studied, assay (%). Therefore,
there were no significant changes in the assay regarding the percentage of LOC contents in the modifications made under the experimental conditions showing the robustness of the developed method.
Comparison between the CZE method, UV-spectro-photometric method and HPLC method
The results obtained from the CZE method were compared statistically with the HPLC and UV
spectrophotometricmethod published previously,21,22 and
no evidence of significant difference was observed. The
calculated F-value (Fcalculated = 1.73987) was found to
be less than the critical F-value (Fcritical = 3.35413) at
5% of significance level. Thus, the proposed method is appropriate for the determination of LOC in tablets and can be used in routine quality control.
Table 2. Method repeatability/intermediate precision for lodenafil carbonate
Sample
Label claim / %
Day 1 Day 2 Day 3
1 105.8 105.9 106.5
2 105.4 105.4 106.9
3 108.8 104.0 105.6
4 107.8 109.1 104.7
5 104.6 108.5 105.8
6 107.4 106.4 107.5
Mean (6) 106.6 108.0 106.0
% RSD 1.65 1.32 1.34
Mean (18) 106.5
% RSD 1.4
Table 3. Accuracy data
Concentration / %
Amount added concentrationa /
(µg mL-1)
Amount found concentrationa /
(µg mL-1)
Recovery / %
70 12.5 12.42 99.4
100 25 25.17 100.7
125 37.5 37.42 99.8
aEach value corresponds to the mean of three determinations.
Figure 3. CZE electropherograms of LOC (50 µg mL−1) and nimesulide
(50 µg mL−1): (a) LOC reference substance, (b) LOC after acidic
Conclusions
In this study, a capillary zone electrophoresis method for quality control of LOC was developed. The method was optimized by using response surface methodology, which made it possible to achieve good efficiency, high sensitivity
and short analysis time. The method was validated following ICH guidelines and showed sufficient linearity, accuracy, precision, specificity and robustness. Compared with the validated HPLC and UV spectrophotometric methods, the CZE method has some advantages including the use of smaller amounts of sample and reagents and the employment of an aqueous system rather than the potentially toxic organic solvents. Thus, this method is a suitable alternative for routine quality control of LOC in pharmaceutical formulations.
Acknowledgments
The authors wish to thank the Cristália Laboratories (Brazil) for the supply of the reference substance and the CNPq for the financial support.
References
1. Zhang, Q.; Li, Y. F.; Huang,C. Z.; Talanta2008, 76, 44. 2. Ruiz, T. P.; Lozano, C. M.; Sanz, A.; Bravo, E.; J. Pharm.
Biomed. Anal.2004, 34, 891.
3. Boone, C. M.; Waterval, J. C. M.; Lingeman, H.; Ensing, K.; Underberg, W. J. M.; J. Pharm. Biomed. Anal.1999, 20, 831. 4. Altria, K. D.; Elder, D.; J. Chromatogr., A2004, 1023, 1. 5. Morzunova, T. G.; Pharm. Chem. J.2006, 40, 158. 6. Suntornsuk, L.; Anal. Bioanal. Chem.2010, 398, 29. 7. Holland, L. A.; Chetwyn, N. P.; Perkins, M. D.; Lunte, S. M.;
Pharm. Res.1997, 14, 372.
8. Yang, X. J.; Chen, Z. G.; Liu, C.; Li, O. L.; Talanta2010, 82, 1935.
9. Mamani, M. C. V.; Farfan, J. A.; Reyes, F. G. R.; Silva, J. A. F.; Ratha, S.; Talanta2008, 76, 1006.
10. Bas, D.; Boyac, I. H.; J. Food Eng.2007, 78, 836.
Table 4. Selected 2-level 24-1 fractional factorial design for the robustness testing of lodenafil carbonate
Experiment
Borate buffer concentration /
(mmol L-1)
pH borate buffer
Capillary
Temperature / ºC Voltage / kV Assay / %
1 52 9.8 34 13 107.03
2 48 10.2 34 13 106.87
3 52 10.2 31 13 107.61
4a 50 10.0 32.5 15 107.45
5 48 10.2 31 17 106.78
6 48 9.8 34 17 107.99
7 52 10.2 34 17 106.30
8 52 9.8 31 17 107.90
9 48 9.8 31 13 106.69
aOptimized conditions.
Figure 4. Pareto charts (a) and normal probability plot (b) representing the effects of the variables and their interactions on the LOC assay for the robustness test using the fractional factorial design 2-level 24-1 (nine
11. Palabiyik, I. M.; Onur, F.; Anal. Sci.2010, 26, 853.
12. NIH Consensus Conference; JAMA, J. Am. Med. Assoc.1993, 270, 83.
13. Albersen, M.; Mwamukonda, K. B.; Shindel, A. W.; Lue, T. F.; Med. Clin. North Am.2011, 95, 201.
14. Aytac, I. A.; Mckinlay, J. B.; Krane, R. J.; BJU Int.1999, 84, 50.
15. Berookhim, B. M.; Bar-Chama, N.; Med. Clin. North Am.2011, 95, 213.
16. Brock, G.; Eur. Urol. Suppl.2002, 1, 12. 17. Eardley, I.; J. Mens HealthGend2006, 3, 323. 18. Gooren, L.; J. Mens Health2008, 5, 163.
19. Toque, H.; Teixeira, C. E.; Lorenzetti, R.; Okuyama, C. E.; Antunes, E.; De Nucci, G.; Eur. J. Pharmacol.2008, 591, 189. 20. Glina, S.; Toscano, I.; Gomatzky, C.; Góes, P. M; Nardozza Jr., A.;
Claro, J. F. A.; Pagani, E.; J. Sex. Med.2009, 6, 553.
21. Codevilla, C. F.; Lemos, A. M.; Delgado, L. S.; Rolim, C. M. B.; Adams, A. I. H.; Bergold, A. M.; J. Chromatogr. Sci.2011, 49, 502.
22. Codevilla, C. F.; Castilhos, T. S.; Fröehlich, P. E.; Bergold, A. M.; J. Pharm. Res.2011, 4, 2368.
23. International Conference on Harmonization; ICH Q2 (R1): Validation of Analytical Procedures-Text and Methodology, Geneva, Switzerland, 2005.
24. Gong, W. J.; Zhang, Y. P.; Choi, S. H.; Zhang, Y. J.; Lee, K. P.; Microchim. Acta2007, 156, 327.
25. Sentellas, S.; Saurina, J.; J. Sep. Sci.2003, 26, 875. 26. Fabre, H.; J. Pharm. Biomed. Anal.1996, 14, 1125. 27. Lin, D. K. J.; J. Qual. Technol.1999, 31, 61. 28. Lenth, R. V.; Technometrics1989, 31, 469.
Submitted: July 4, 2012