Article
J. Braz. Chem. Soc., Vol. 28, No. 11, 2045-2053, 2017. Printed in Brazil - ©2017 Sociedade Brasileira de Química 0103 - 5053 $6.00+0.00
*e-mail: [email protected]
DLLME-GC/ECD Method for the Residual Analysis of Parathion-Methyl and its
Application in the Study of the UV-Photodegradation Process
Gustavo G. Pimenta,a Maria E. L. R. de Queiroz,*,a Raquel P. D. Victor,a,b Luiz M. Noronha,a Antônio A. Neves,a André F. de Oliveiraa and Fernanda F. Helenoc
aDepartamento de Química, Universidade Federal de Viçosa, 36570-900 Viçosa-MG, Brazil
bInstituto Federal do Espírito Santo (IFES), 29106-010 Vila Velha-ES, Brazil
cDepartamento de Engenharia Agrícola, Universidade Federal de Viçosa, 36570-900 Viçosa-MG, Brazil
A new method has been developed to determine trace levels of organophosphorus pesticide parathion-methyl in water samples by using dispersive liquid-liquid microextraction (DLLME), followed by gas chromatograph coupled with electron capture detector (GC/ECD) analysis. The optimized and validated method showed high extraction recovery (101.1%), high enrichment factor (57.3), low limits of detection and quantification, 0.083 and 0.250 µg L-1, respectively. The
established DLLME-GC/ECD method has been successfully applied for the evaluation of the photodegradation of the parathion-methyl by UV254nm radiation in different conditions of pH and
temperature. The parathion-methyl photodegradation at pH 3 and 35 °C achieved > 99.5% after 120 min of exposition. For this condition, it was observed the kinetic rate of 0.0515 min-1, the
quantum yield of 1.22 × 10⁻⁵ mol Einstein-1 and a half-life time of 13.46 min. All experimental
conditions tested proved to be strongly influenced by pH and temperature. The application of the optimized process in distilled and drinking water spiked with parathion-methyl provided residues of this pesticide at levels below the maximum permitted by Brazilian legislation, which is 9.0 µg L-1.
Keywords: pesticide, dispersive liquid-liquid microextraction, gas chromatography, UV radiation, degradation
Introduction
Organophosphates (OPs) are used as pesticides in different cultures due to its efficiency in pests
control.1 Parathion-methyl (O,O-dimethyl-O-4-nitrophenyl
phosphorothioate) is an insecticide and acaricide from OPs class. Because it is classified as extremely dangerous, it has been banned or had its restricted use in many developed countries like Japan, USA and Australia. In spite, it is still used in cultures of rice, garlic, wheat, beans in many other
developing countries including Brazil.2 The yearly
large-scale use of parathion-methyl, as well as low decomposition rates in the environment cause the accumulation of these compounds in soils, from which they are subsequently
washed out to enter groundwater and rivers.3
Many techniques have been investigated to eliminate this waste and other pesticides in the environment, such as photo-Fenton process, homogeneous and heterogeneous
photocatalysis, nanofiltration and photodegradation.4 The
photodegradation has proven to be an important process of destruction of organic micro-pollutants in water and wastewater. In photodegradation, photo-oxidation reactions occur due to the excitation of electrons of the organic substance through absorption of radiant energy. UV radiation can initiate numerous chemical reactions, such
as hydrolysis, oxidation and photolysis.5
At first, if the molecule of organic pollutant absorb energy emitted by the light photons, links can therefore
be cleaved.6 The equations 1 and 2 represent the basic
mechanism of photodecomposition reactions of organic pollutants. Equation 1 represents the photochemical excitation due to radiation of UV absorption at the
maximum wavelength (hνmax) by the pollutant and
equation 2 shows the photo-excited molecule becoming reaction product or intermediaries who can participate in
subsequent reactions.5,7-9
(2)
The most effective region of the electromagnetic spectrum for degradation of organic pollutants lies in
the UV-C near 254 nm.10 The germicidal low pressure
(LP) mercury lamps are the most common sources of ultraviolet radiation. These lamps emit 80 to 90% of the energy at a wavelength of 253.4 nm and can be considered
monochromatic.11
Typically the photobleaching studies are evaluated in terms of their kinetic behavior, but the efficiency of photodecomposition reactions can also be measured by
the quantum yield (Φλ), which expresses the number of
photons required to degrade certain amount of organic
contaminant.6 On molar basis, Φ
λ is given in mol Einstein-1, where 1 Einstein is equal to 1 mol of photon, according to the equation 3.
(3)
The number of moles of photons required for the reaction can be measured by actinometry. The actinometry allows the determination of the photons flow in a specific geometry and in a well-defined spectral domain; therefore, the most favorable case is when the incident light is monochromatic. In absolute actinometric measurements a physical device (such as a photomultiplier or a photodiode, e.g.) converts the energy or the number of incident photons in measurable electrical signal. However, the most commonly utilized method is based on a chemical actinometer; a reference substance undergoing a photochemical reaction whose yield is already known, calibrated against a physical device, well
studied actinometers or calorimetric methods.12
The ferrioxalate chemical actinometer is the most reliable and practical actinometer to UV and visible light up to 500 nm and was initially proposed by Hatchard
and Parker.13 Under the excitation light, the potassium
ferrioxalate decomposes according to equations 4, 5 and 6.
(4)
(5)
(6)
The quantity of ferrous ions formed during a period of irradiation is monitored by conversion to the colored
tris-phenanthroline complex (o-phenanthroline iron(II),
ε = 11.100 L mol-1 cm-1 at λmax = 510 nm). By this relation,
it can be determined the number of moles of effective
photons in the production of photochemical changes.12
Bhattacharjee and Shah14 and Teixeira and Jardim15
have suggested that the photolysis is influenced by several factors and should be highlighted the pH of the medium, the concentration of organic contaminants, light sources characteristics and the operating system, geometry and hydrodynamic parameters of the reactor, temperature,
among others. Khaleel et al.16 showed the importance
of assessing these parameters to examine the influence of the variation of the initial concentration, solution pH, and temperature on the photolysis of the antidepressant desipramine. Although the pH has shown a significant impact on the degradation rate, the temperature, contrary to expectations, showed no significant effect in the study.
Among some advantages of photolysis, Domènech et al.17
emphasize the increasing reaction rate compared with other techniques in the absence of light, the system flexibility by allowing the use of a variety of combined oxidants and the fact that this process does not require drastic pH changes.
For the determination of pesticides in water by gas chromatography methods, several simultaneous extraction and pre-concentration of the residues have been proposed. Among them, the dispersive liquid-liquid microextraction (DLLME) has shown powerful and can be applied appropriately to quantify the residual compound by gas chromatography (GC) or by high-performance liquid chromatography (HPLC). In DLLME, a mixture composite of an extraction solvent and of a dispersive solvent is rapidly injected into an aqueous solution containing the analyte of interest to form a cloudy solution. This solution is homogenized and then, centrifuged to separate the phases. Consecutively, the sedimented organic phase is removed and injected into
the analytical instrument for quantitation.18
This research applied a chemometric experimental design to optimize DLLME- gas chromatography-electron capture method to analyze the residue of parathion-methyl and evaluate its UV-photodegradation at different conditions of pH and temperature.
Experimental
Reagents and solutions
Parathion-methyl (C8H10NO5PS, 99.0%) was obtained
from Chem Service (West Chester, PA, USA) and
bifenthrin (C23H22ClF3O2, 92.2%), used as internal standard
(IS), was obtained from FMC (FMC Brasil, Campinas,
SP, Brazil). Toluene 99.5% HPLC grade (Vetec, Rio de
acetonitrile 99.9% HPLC grade (Sigma-Aldrich, São Paulo, SP, Brazil) as dispersive solvent.
Stock solutions of parathion-methyl were prepared
in acetonitrile 99.9% HPLC grade (Sigma-Aldrich, São
Paulo, SP, Brazil) in the concentration of 35.0 mg L-1 and
bifenthrin in the concentration of 1000.0 mg L-1. From
these pesticide standard solutions, work solutions were
prepared in the concentrations of 100.0 µg L-1 in distilled
water of parathion-methyl and the IS in acetonitrile at the
concentration 13.2 mg L-1. These solutions were stored in
a freezer at −20 ± 2 °C.
Instrumentation
The identification and quantification were performed
in a gas chromatograph (Shimadzu GC 2014) equipped
with an electron capture detector (GC/ECD) and a split/ splitless injection system with auto-injector (AOC-20i). The separation was performed using a capillary column
ZB-5 (Zebron), stationary phase of 5% phenyl and 95%
dimethylpolysiloxane (30 m × 0.25 mm i.d. and 0.10 µm of
stationary film thickness). Nitrogen (99.999% purity) was
used as carrier gas at a flow rate of 1.2 mL min-1 and the
injection of 1.0 µL of sample was carried out in the split mode in the ratio 1:5. The temperatures of the injector and detector were 280 and 300 °C, respectively. The column was initially set at 180 °C for 0.22 min, and heated at a
rate of 20 °C min-1 to 205 °C and held at this temperature
for 0.5 min. After, it was heated at 5 °C min-1 to 217 °C
and then, heated at 30 °C min-1 to 290 °C, maintaining
at this temperature for 1.2 min. The total analysis time was 8 min.
The determination of the quantum yield in photolytic reactions was performed using a UV-Visible
spectrophotometer (Cintra C-20). It was also used:
analytical balance (Sartorius EP 221S), centrifugal
(Quimis Q222-T28), pH meter (Digimed DM-20),
magnetic stirrer (Nova Ética 114) and a thermostatic bath
(Tecnal TE-184).
Chromatographic analysis
The identification of analytes, parathion-methyl and bifenthrin (IS), was conducted by comparing the retention
time (Rt) of the chromatographic peaks of pesticides
standard solutions with the Rt of pesticides contained in the
extracts of the samples. The quantification of pesticides was performed by internal standardization method with matrix-matched. The extracts were fortified with 1.0 µL of the work
solution of IS 13.2 mg L-1 getting a final concentration of
200.0 µg L-1.
DLLME procedure
For optimization of the extraction method it was used
a full factorial design 23. The tests were performed in
duplicate at 25 ± 2 °C and the variables evaluated were:
ionic strength ([KCl] in mol L-1); vortexing time (s); amount
of extraction solvent (µL) (Table S1, Supplementary Information section).
The results were based on the effects of the factorial
design at a confidence level of 95% (α = 0.05) using the
Statistica 12 software (StatSoft Corp., Tulsa, USA). The
evaluation was conducted from the extraction efficiency (E).
The adapted DLLME extraction method18,19 consists of
extracting the interest analyte in water samples (5.0 mL) free or fortified with parathion-methyl at concentration level
of 5.0 µg L-1 adding 600.0 µL of dispersing and extraction
solvents mixture, acetonitrile:toluene (5:1). This mixture was rapidly injected into the sample by a microsyringe of 1000.0 µL. The resulting cloudy solution was vortex shaken for 30 seconds followed by centrifugation at 6,000 rpm for 5.0 min. The extract located in the supernatant (around 65.0 µL) was collected with an automatic pipette of 100.0 µL and transferred to a vial provided with an insert of 150 µL. This extract was fortified with 1.0 µL of work
solution of IS at 13.2 mg L-1 and then, injected into the
GC/ECD to obtain the chromatographic responses.
Method validation
The method validation of DLLME-GC/ECD was carried out following the procedures adopted by our
group,20,21 which are based on established criteria
by leading regulatory agencies in Brazil: Agência Nacional de Vigilância Sanitária (ANVISA) through the
Resolution No. 899/03,22 Instituto Nacional de Metrologia,
Normalização e Qualidade Industrial (INMETRO)23 through
the guide document DOQ-CCGRE-008/2007, Ministério da
Agricultura, Pecuária e Abastecimento (MAPA)24 through
the Validation Guide and Analytical Quality Control and by the Analytical Quality Assurance Manual of the Ministry of Agriculture, Livestock and Supply.
UV-photodegradation process
The irradiation experiments were conducted in batch in an aluminum cylindrical reactor with a total volume of
700.0 mL and surface area of 147.4 cm2. The reactor was
placed in a timber chamber of 60 × 55 × 40 cm size which
with parathion-methyl at concentration level of 50.0 µg L-1
were introduced into the reactor and submitted to UV irradiation, under magnetic stirring, for 180 min. Samples of 5.0 mL were collected every 30 min and were submitted to optimized and validated method (DLLME-GC/ECD) to determine the residual amount of parathion-methyl. The experiments as well as the chromatographic injections were performed in duplicate.
The medium temperature was monitored using a digital thermometer and kept constant through a handmade heat exchanger connected to a thermostatic bath. A TUV
Sylvania 15 W germicidal lamp was used as UV radiation
source. For the determination of the quantum yield of the photolytic reactions, the average intensity of ultraviolet
radiation (Einstein min-1) was measured by a chemical
actinometer of potassium ferrioxalate proposed initially
by Hatchard and Parker.13
The UV-photodegradation assays were performed to achieve parathion-methyl degradation as a function of pH (3, 7 and 11) and temperature (15, 25 and 35 °C). To modify the pH of the reaction medium, appropriate quantities
of nitric acid solution 1.0 mol L-1 or sodium hydroxide
1.0 mol L-1 were added.
The optimized degradation procedure was applied in drinking water samples collected after conventional treatment in a treatment plant (WTP, Viçosa, Brazil) and spiked with known concentrations of pesticides.
Results and Discussion
Optimization of the DLLME-GC/ECD method
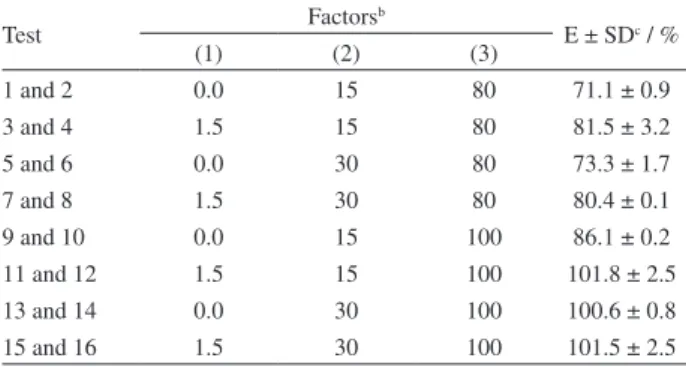
The Table 1 shows the results of the factorial design
23 for the DLLME-GC/ECD method optimization. The
term E is defined as the percentage of the total amount, by
weight, of the analyte extracted to the organic phase; mi
(0.025 µg) corresponds to the initial amount of analyte in
the aqueous phase and morg corresponds to the amount of
extracted analyte. The extraction efficiency was calculated according to equation 7.
(7)
where Corg is the analyte concentration in the organic
phase, Ci is the initial concentration of the analyte in the
sample, Vorg is the volume of organic phase recovered after
extraction and Vaq is the volume of the sample solution.
The Corg was obtained by linear equation of the
calibration graph constructed from the direct injections of standard solutions of parathion-methyl prepared in toluene
at the range 100.0-1000.0 µg L-1. The injections were in
triplicate. The equation of the linear regression curve was y = 1,391.8x + 200,167.0, with determination coefficient
(R2) equal to 0.995.
The Figure 1 shows the Pareto chart with the effects of the factors on extraction efficiency.
Analyzing the main effects of the factors studied in extraction efficiency (E) (Figure 1), it was found that the volume of extraction solvent has significant influence
(p < 0.05), with high volume of extractor solvent (3)
the value of E increased. It was also found that the ionic strength and the vortex time influenced significantly the
extraction efficiency (p < 0.05), because the higher values
for these factors shown best results for E.
The Table 1 shows the conditions of the tests 11 to 16 offered the best experimental results for extraction
Figure 1. Pareto chart with the effects of the factors ionic strength (1), agitation time vortex (2) and volume of solvent extractor (3) on the extraction efficiency (E) of parathion-methyl.
Table 1. Results of the full 23 factorial design for DLLMEa optimization
based on the effects of the factors in extraction efficiency (E) of parathion-methyl in distilled water
Test Factorsb E ± SDc / %
(1) (2) (3)
1 and 2 0.0 15 80 71.1 ± 0.9
3 and 4 1.5 15 80 81.5 ± 3.2
5 and 6 0.0 30 80 73.3 ± 1.7
7 and 8 1.5 30 80 80.4 ± 0.1
9 and 10 0.0 15 100 86.1 ± 0.2
11 and 12 1.5 15 100 101.8 ± 2.5
13 and 14 0.0 30 100 100.6 ± 0.8
15 and 16 1.5 30 100 101.5 ± 2.5
aOther extraction conditions: sample volume 5.0 mL of water; volume
of dispersive solvent 500.0 µL; centrifugation at 6,000 rpm for 5.0 min; T = 25 ± 2 °C; concentration of parathion-methyl equal to 5.0 µg L-1; b(1) ionic strength (in mol L-1); (2) vortex time (in s); (3) amount of
efficiency. However, fixing up the vortex time at 30 s (tests 13 to 16) it was found that the variation of the ionic strength has little influence in the extraction efficiency, once values close to 100% were obtained without any salt addition. Therefore, the experimental condition of tests 13 and 14 (Table 1) was selected as optimal parameters for the method application, since it offered high extraction efficiency (100.6 ± 0.8%), analytical and operational simplicity and rapidity. Then, the optimal condition for extraction of parathion-methyl in aqueous samples by DLLME was: add in 5.0 mL of water sample, without changing the ionic strength, the extractive mixture containing 500.0 µL of dispersive solvent (acetonitrile) and 100 µL of extractor solvent (toluene) and vortexing for 30 s.
The method also showed an enrichment factor (EF) of
57.3 ± 1.5 and relative standard deviation (RSD) of 2.6%.
EF was calculated as the ratio of the analyte concentration
in the organic phase (Corg) and the initial concentration of
the analyte in the sample (Ci).
DLLME-GC/ECD method validation
All calibration curves used in the validation step were built from the internal standardization method with matrix-matched blank samples, and the extraction procedure was performed in triplicate for each concentration level with two injections for each replicate. Statistical tests were
performed using software Statistica® 12 (StatSoft Corp.,
Tulsa, USA) at a 95% confidence level.
The selectivity of the method was evaluated by comparing the chromatographic responses obtained after submitting samples of distilled water, free and spiked with the pesticide under study, the method of DLLME-GC/ECD optimized. It was not detected any interference in the times of retention of parathion-methyl and IS (Figure S1, Supplementary Information section).
The limits of detection (LOD) and quantification (LOQ)
were calculated according to Ribani et al.25 and MAPA24
(equations 8 and 9).
(8)
(9)
where s is the estimated standard deviation of analytical
response of the matrix blank in the characteristic Rt of
parathion-methyl, S is the slope of the calibration curve. The values obtained are presented in Table 2.
It was found that both LOD and LOQ are below the maximum contaminant level (MCL) recommended by the
Ministry of Health26 which is 9.0 µg L-1.
The linearity of the method was evaluated analyzing the extracts obtained by spiking distilled water samples at
concentrations levels of 0.25-60.0 µg L-1 (8 points). The
linear regression curve was obtained for y = 0.215x + 0.774 and the correlation coefficient (r) equal to 0.996. According to this parameter, the curve was linear in the concentration levels evaluated, once its value is above the minimum
values recommended by ANVISA22 (0.99) and INMETRO23
(0.90). The selected working range was 0.25 to 20.0 µg L-1,
because the most of the measurements performed on the degradation experiments were contemplated in this range.
To evaluate the accuracy of the proposed method, distilled water samples were spiked with
parathion-methyl in four concentration levels: 1 × LOQ, 2 × LOQ,
40 × LOQ and 80 × LOQ (0.25, 0.50, 10.0 and 20.0 µg L-1,
respectively) and submitted to extraction procedure.
Recovery factors (ƒrec× 100) obtained are shown in Table 3.
It was found that the method provides results with high level of agreement with those regarded as real, since the
ƒrec values for all concentration levels are within the range
recommended by the MAPA,24 that is 50-120% for 1 and
2 × LOQ, and 80-110% for 40 and 80 × LOQ.
The precision was evaluated in terms of repeatability and intermediate precision in the same concentration levels used to determine the accuracy. It was found that the method is accurate, since the RSD values for all concentration levels are below the recommended by the
MAPA24 that is 23% for 1 and 2 × LOQ and 13% for 40
and 80 × LOQ (Table 3).
UV-photodegradation of parathion-methyl
The DLLME-GC/ECD optimized and validated method
Table 2. Estimated standard deviation of the matrix blank (s), the slope of the calibration curve (S), limits of detection (LOD) and quantification (LOQ) to the method
Pesticide sa Sb Linear range / (µg L-1) LOD / (µg L-1) LOQ / (µg L-1)
Parathion-methyl 0.018 0.707 0.25-60.0 0.083 0.250
aAverage of 7 reps of water samples free of pesticide submitted to DLLME-GC/ECD optimized method; banalytical curve obtained by spiking water samples
with parathion-methyl at final concentrations of 0.1 to 0.5 µg L-1 (5 points); y = 0.707x + 0.040; R2 = 0.998 and residues standard deviation (s
was used to monitoring the photodegradation of
parathion-methyl through UV254nm radiation.
The kinetics of degradation of parathion-methyl under UV254nm absorption can be represented by the integrated
model expressed by first order (equation 10).
(10)
where [CPM]0 and [CPM]t correspond to the initial
concentration and the residual concentration of parathion-methyl after a time t (min) of experiment, respectively, and
kUV corresponds to the kinetic rate constant of 1st-order
degradation (min-1).
The Figures 2 and 3 present graphs of the concentration decay of parathion-methyl during UV-photodegradation under different conditions of pH and temperature and the corresponding graphs to the kinetic behavior contemplating
ln ([CPM]0/[CPM]t) versus exposure time.
For Chelme-Ayala et al.27 and Wu and Linden28 the
pesticide degradation in UV radiation water can also be
represented by the 1st-order kinetic model.
It was found that parathion-methyl degradation is favored in acidic environment, once the pesticide was
greater than 99.5% degraded in pHi 3 during 180 min
exposure (Figure 3). Bhattacharjee and Shah14 and Gogate
and Pandit29 also reported that greater efficiency in the
degradation of organic contaminants can be achieved at low pH values in the range of 2.5 to 5. For the other pH values evaluated (7 and 11), it was observed an incomplete degradation of parathion-methyl and the pesticide residues
remained above the MCL which is 9.0 µg L-1.26
It was found that parathion-methyl degradation is favored by increasing the temperature once the degradation of > 99.5% of the pesticide occurred at 35 °C during 120 min
of exposure (Figure 4). According to Langlais et al.30 an
increment of 10 °C generally increases by a factor of 2 or 3 the rate of decomposition of an organic compound.
Although 35 °C present as the best temperature for
direct UV-photodegradation of parathion-methyl in UV254nm
in pH 3, the other tested temperatures, 15 and 25 °C, also led to satisfactory results, once at the end of the total exposure time (180 min) the residual concentrations of pesticide at
these conditions were below the MCL.26
Table 3. Accuracy and precision of DLLME-GC/ECD method
Concentration / (µg L-1) Recovery factora
(ƒrec× 100) ± RSD / %
Precision
Repeatabilitya (RSD) / % Intermediate precision (RSD) / %
0.25 (1 × LOQ) 100.2 ± 4.2 2.5 5.5
0.50 (2 × LOQ) 100.3 ± 4.9 2.2 6.5
10.0 (40 × LOQ) 102.2 ± 5.9 2.6 4.0
20.0 (80 × LOQ) 99.0 ± 5.6 7.7 6.3
aAverage triplicate. ƒ
rec = product of the average concentration measured in the matrix spiked by the theoretical concentration of the blank matrix spiked; bcarried out on different days and not consecutive, by the same analyst.
Figure 2. Concentration decay of parathion-methyl in distilled water for direct photolysis in UV254nm at different pH values. The insert corresponds
Between the conditions evaluated, the best kinetics behavior was achieved in experiments carried out at pH 3
and 35 °C, with an estimated kUV 0.0515 min-1.
The number of moles of photons required for the reaction
was measured by chemical actinometry assuming the Φ254nm
for potassium ferrioxalate equal to 1.25 mol Einstein-1.13
Thus, the average radiation intensity obtained (I254nm) was
8.53 ± 0.34 × 10⁻⁵ Einstein min-1. The Φ
254nm values obtained
for the photodegradation assays are described in Table 4. This parameter is important to reproduce this experiment
Figure 3. Concentration decay of parathion-methyl in distilled water for direct photolysis in UV254nm at different temperatures. The insert corresponds
to the kinetic behavior under the same conditions. Each point of the curve represents the arithmetic average of the results of experimental repetitions. [CPM]0 = 50.0 µg L-1; pHi = 3.
Figure 4. Concentration decay of parathion-methyl in potable water during the direct photolysis in UV254nm at pH 3 at 35 °C. The insert corresponds
to the kinetic behavior under the same conditions. Each point of the curve represents the arithmetic average of the results of experimental repetitions. [CPM]0 = 50.0 µg L-1.
Table 4. Kinetics rate of degradation (kUV), half-life (t1/2) and quantum yield (Φ254nm) determined for the experiments of direct photolysis of parathion-methyl
under UV254nm radiation in distilled water samples
EC (pH, T ± 1 °C) kUV / min-1 t1/2 / min Φ254nm / (mol Einstein-1)
(1) pH 3, 25 °C 0.0269 ± 0.0003 25.74 ± 0.30 (8.78 ± 0.17) × 10-6
(2) pH 7, 25 °C 0.0047 ± 0.0004 148.38 ± 11.8 (5.09 ± 0.22) × 10-6
(3) pH 11, 25 °C 0.0077 ± 0.0003 89.48 ± 3.84 (6.81 ± 0.51) × 10-6
(4) pH 3, 15 °C 0.0111 ± 0.0001 62.32 ± 0.24 (7.21 ± 0.40) × 10-6
(5) pH 3, 35 °C 0.0515 ± 0.0007 13.46 ± 0.18 (1.22 ± 0.01) × 10-5
using other UV sources taking different photons emission
rates. Table 4 also shows the average values of kUV and
half-lives (t1/2) for all tests.
The experimental condition that provided the best quantum yield (Table 4), which showed the highest
parathion-methyl degradation by UV254nm power unit, was carried out at
pH 3 at 35 °C with Φ254nm equal to 1.22 × 10⁻⁵ mol Einstein-1.
Accordingly, this condition showed the best reaction
kinetic rate (kUV = 0.0515 min-1) and the shorter half-life
(t1/2 = 13.46 min). Wu and Linden28 reported a Φ254nm of
7.14 × 10⁻⁴ mol Einstein-1 to parathion degradation at pH 5
using four monochromatic low-pressure lamps.
Thus, it was concluded that the proposed procedure
of direct photolysis in UV254nm for parathion-methyl
degradation conducted at pH 3 at 35 °C was very efficient, being able to eliminate all the pesticide present in the sample in 120 min. The degradative process in these pH and temperature conditions was applied in spiked drinking
water samples ([CPM]0 = 50.0 µg L-1). The Figure 4 shows
the graph of the concentration decay of parathion-methyl in drinking water during UV-photodegradation at pH 3 and 35 °C and the graph of their kinetic behavior.
After performing the measurements and calculated the efficiency parameters (kUV, t1/2 and Φ254nm), the results
obtained were compared with those determined from the application of the optimized process in distilled water. Table 5 shows these results.
A comparison of the results for each parameter was performed through the ANOVA test at a 95% confidence level. It was found that the results for the parameters
evaluated (kUV, t1/2 and Φ254nm) in parathion-methyl
degradation in drinking water are statistically different from those obtained for the same process in distilled
water samples. According to Bhattacharjee and Shah14 and
Gálvez et al.31 the photodegradation process is strongly
influenced by the presence of some interfering ions such as sulfates, phosphates, carbonates and bicarbonates. According to the authors, these species act as sequestrants, competing with the organic substrate by radiation absorption. This issue was probably the cause for significant difference observed between the results, once for drinking water the presence of several species able to exercise such interference is allowed at the national territory.
Conclusions
The method of DLLME optimized and validated for the quantification of parathion-methyl by GC/ECD was adequate and effective in the extraction of pesticides in water samples, distilled and drinking, with high extraction efficiency (101.1 ± 2.8%) and high enrichment factor (57.3 ± 1.5). The DLLME-GC/ECD method showed good linearity and repeatability, achieving low LOD and LOQ
in the range of ppt (ng L-1).
The established DLLME-GC/ECD method has been successfully applied for the evaluation of the photodegradation of the parathion-methyl in different conditions of pH and temperature. For the optimized
conditions (pH 3 and 35 °C), direct photolysis in UV254nm
completely degraded parathion-methyl in distilled water at 120 min of exposure to the radiation. It was found that
both kUV and Φ254nm are strongly dependent on the pH and
on temperature of the reaction medium. The application of UV-photodegradation process in drinking water samples confirmed the efficiency and versatility of it, once the parathion-methyl residues achieved remained below the
MCL (9.0 µg L-1) at the end of the experiment. However, the
obtained efficiency parameters were statistically different from those obtained in the tests in distilled water, suggesting the presence of interfering anions which competed with the pesticides by absorption of radiation.
Supplementary Information
Supplementary information is available free of charge at http://jbcs.sbq.org.br as PDF file.
Acknowledgments
The authors would like to thank Brazilian Agencies: Fundação de Amparo à Pesquisa do Estado de Minas Gerais (FAPEMIG), Conselho Nacional de Desenvolvimento Científico e Tecnológico (CNPq) and Coordenação de Aperfeiçoamento de Pessoal de Nível Superior (CAPES) for their financial support.
Table 5. Efficiency parameters calculated from the results of the application of the optimized process of direct photolysis in UV254nm in samples of distilled
and drinking water
Parameter kUV / min-1 t1/2 / min Φ254nm / (mol Einstein-1)
Matrix PW 0.0515 ± 0.0007 13.46 ± 0.18 (1.22 ± 0.01) × 10-5
DW 0.0181 ± 0.0001 38.37 ± 0.30 (8.52 ± 0.24) × 10-6
References
1. Narakathu, B. B.; Guo, W.; Obare, S. O.; Atashbar, M. Z.; Sens. Actuators, B2011, 158, 69.
2. http://portal.anvisa.gov.br/documents/111215/117782/ P03%2B%2BParationa-met%25C3%25ADlica.pdf/7edd5934-0e95-44e4-bf70-596b2a884621, accessed in March 2017. 3. Sirotkina, M.; Lyagin, I.; Efremenko, E.; Int. Biodeterior.
Biodegrad.2012, 68, 18.
4. Guo, Z.-B.; Lin, Y.-L.; Xu, B.; Huang, H.; Zhang, T.-Y.; Tian, F.-X.; Gao, N.-Y.; Chem. Eng. J.2016, 283, 412.
5. Legrini, O.; Oliveros, E.; Braun, A. M.; Chem. Rev.1993, 93,
671.
6. Schwarzenbach, R. P.; Gschwend, P. M.; Imboden, D. M.;
Environmental Organic Chemistry, 2nd ed.; John Wiley & Sons:
Hoboken, USA, 2003.
7. Calvert, J. G.; Pitts, J. N.; Photochemistry, 1st ed.; John Wiley
& Sons: London, UK, 1966.
8. Reddy, P. V. L.; Kim, K.-H.; J. Hazard. Mater.2015, 285, 325. 9. Santos, M. S. F.; Alves, A.; Madeira, L. M.; Water Res.2016,
88, 39.
10. Xiao, J.; Xie, Y.; Cao, H.; Chemosphere2015, 121, 1.
11. Masschelein, W. J.; Rice, R. G.; Ultraviolet Light in Water and Wastewater Sanitation, 1st ed.; CRC press: Boca Raton, USA,
2016.
12. Montalti, M.; Credi, A.; Prodi, L.; Gandolfi, M. T.; Handbook of Photochemistry, 3rd ed.; CRC press: Boca Raton, USA, 2006.
13. Hatchard, C. G.; Parker, C. A.; Proc. R. Soc. A 1956, 235, 518.
14. Bhattacharjee, S.; Shah, Y. T.; Rev. Chem. Eng.1998, 14, 1. 15. Teixeira, C. P. A. B.; Jardim, W. F.; Processos Oxidativos
Avançados: Conceitos Teóricos, 1a ed.; Universidade Estadual
de Campinas: Campinas, Brazil, 2004.
16. Khaleel, N. D. H.; Mahmoud, W. M. M.; Olsson, O.; Kümmerer, K.; Sci. Total Environ.2016, 566-567, 826.
17. Domènech, X.; Jardim, W. F.; Litter, M. I. In Eliminación de Contaminantes por Fotocatálisis Heterogénea, 1st ed.; Blesa,
M. A. ed.; CYTED (Digital Graf.): La Plata, Argentina, 2001, ch. 1.
18. Rezaee, M.; Assadi, Y.; Hosseini, M.-R. M.; Aghaee, E.; Ahmadi, F.; Berijani, S.; J. Chromatogr. A2006, 1116, 1.
19. Berijani, S.; Assadi, Y.; Anbia, M.; Hosseini, M.-R. M.; Aghaee, E.; J. Chromatogr. A2006, 1123, 1.
20. Costa, A. I. G.; Queiroz, M. E. L. R.; Neves, A. A.; Sousa, F. A.; Zambolim, L.; Food Chem.2015, 181, 64.
21. Heleno, F. F.; Queiroz, M. E. L. R.; Neves, A. A.; Faroni, L. R. A.; Sousa, F. A.; Oliveira, A. F.; J. Braz. Chem. Soc.2015, 26,
687.
22. ANVISA; Resolução RE No. 899, 29 de maio de 2003; Guia para a Validação de Métodos Analíticos e Bioanalíticos; D.O.U. - Diário Oficial da União, Poder Executivo, 02 de junho de 2003, Brazil.
23. Instituto Nacional de Metrologia, Qualidade e Tecnologia (INMETRO); DOQ-CGCRE-008; Orientação sobre Validação de MétodosAnalíticos; INMETRO, 2011.
24. Ministério da Agricultura, Pecuária e Abastecimento (MAPA);
Manual de Garantia da Qualidade Analítica - Resíduos e Contaminantes em Alimentos, 1a ed.; MAPA/ACS: Brasília,
Brazil, 2011.
25. Ribani, M.; Bottoli, C. B. G.; Collins, C. H.; Jardim, I. C. S. F.; Melo, L. F. C.; Quim. Nova2004, 27, 771.
26. Ministério da Saúde; Portaria No. 2914, Dispõe sobre os Procedimentos de Controle e de Vigilância da Qualidade da Água para Consumo Humano e seu Padrão de Potabilidade, Brasília, 2011.
27. Chelme-Ayala, P.; El-Din, M. G.; Smith, D. W.; Water Res.
2010, 44, 2221.
28. Wu, C.; Linden, K. G.; Water Res.2008, 42, 4780.
29. Gogate, P. R.; Pandit, A. B.; Adv. Environ. Res.2004, 8, 553.
30. Langlais, B.; Reckhow, D. A.; Brink, D. R.; Ozone in Water Treatment: Application and Engineering, 1st ed.; Lewis
Publishers: Chelsea, USA, 1991.
31. Gálvez, J. B.; Rodríguez, S. M.; Gasca, C. A. E.; Bandala, E. R.; Gelover, S.; Leal, T. In Eliminación de Contaminantes por Fotocatálisis Heterogénea, 1st ed.; Blesa, M. A., ed.; CYTED
(Digital Graf.): La Plata, Argentina, 2001, ch. 3.