Obstructive Sleep Apnea and P300 Evoked Auditory Potential
Abstract
Carlos Henrique Martins1, Ney de Castro Júnior2, Orozimbo Alves Costa Filho3, Osmar Mesquita de Souza
Neto4
1 PhD in Medicine – Graduate Program – Medical School of the Sta. Casa de S. Paulo; Assistant Physician at the Department of Speech and Hearing Therapy of the Denistry School of Bauru - UNESP.
2 PhD in Medicine; Adjunct Professor.
3 Full Professor at UNESP – Bauru Campus; Director at the Department of Speech and Hearing Therapy at the Denistry School of Bauru - UNESP. 4 PhD in Medicine – Graduate Program – Medical School of the Sta.Casa de S. Paulo; Adjunct Professor of Otorhinolaryngology of the Sta.Casa de S. Paulo.
ENT Program – Medical School of the Sta. Casa de S. Paulo
Send correspondence to: Dr. Ney Penteado de Castro Jr. - R. Itapeva. 500 cjto. 10-B. São Paulo - SP. CEP: 01332-903. Paper submited to the BJORL-SGP (Publishing Management System – Brazilian Journal of Otorhinolaryngology) on May 01, 2011;
and accepted on July 14, 2011. cod. 7747
T
he obstructive sleep apnea syndrome (OSAS) reduces attention span, memory andconcentra-tion capacities, all associated with cogniconcentra-tion. The analysis of the auditory P300 parameters could help infer cognitive dysfunction.
Objective: To compare the data from polysomnography and the auditory P300 in adults, primary snorers with OSAS patients.
Materials and Methods: Prospective study with primary snorers (N=12) and in OSAS patients (N=54), submitted to polysomnography, defined by the apnea-hypopnea index (AHI). The polysomnography and P300 variables were compared by the t-Student test, the Exact Fisher’s Test, logistic regression and analysis of correlation with a significance level of 5%.
Results: AIH had an inverse correlation with the oximetry in both groups. The P300 prevalence was lower in the OSAS group (Fisher’s Exact Test, p=0.027). Patient age did not influence the P300 prevalence (regression analysis; p=0.232). The P300 amplitude was lower in the OSAS group (t-Student test; p=0.003) and the P300 latency was similar in both groups (t-Student test; p=0.89).
Conclusion: The reduction in the P300 amplitude in patients with OSAS suggests cognitive dysfunc-tion induced by a reducdysfunc-tion in auditory memory.
ORIGINAL ARTICLE
Braz J Otorhinolaryngol. 2011;77(6):700-5.
BJORL
Keywords: auditory, cognition, event related potentials, evoked potentials, p300,
obstructive,
respiration disorders, sleep apnea.
INTRODUCTION
The Obstructive Sleep Apnea Syndrome (OSAS) – causes a change to normal sleep architecture, with sleep fragmentation, hypoxia and frequent awakenings. Chronic sleep deprivation and fragmentation reduce its restorative capacity, induce excessive daily sleepiness, and reduce attention span, reduce memory and con-centration, amongst other symptoms. Attention span, memory and concentration capacity are closely related to cognition1.
On the other hand, the auditory P300 is an electrophysiological event, depending on a previous acoustic experience, and it is a sensorial perception brain process. It is triggered by the individual’s reaction to a previously established acoustic stimulus, it reflects the conscious interaction of the auditory system with the somatosensorial cortical area and requires the active mental participation of the patient. By analyzing its pa-rameters, the P300 - known as a neuropsychobiological event – one can infer about the cognitive function in an objective fashion2,3.
Case-control clinical studies carried out with indi-viduals subjected to a forced sleep deprivation showed latency extension and reduction in the auditory P300 amplitude in the study group. These results have sug-gested that the P300 changes in the study group were reflexes from lowering the state of awareness, which extends the reaction time4-6. The cognitive deterioration induced by sleep deprivation is a consequence of neu-rophysiological changes, demonstrated by reduction in amplitude and increase in P300 latency.
OSAS repercussion studies about P300 parameters are rare. Primary snorers and people with mild OSAS do not have changes to P300 latency and amplitude; patients with moderate to severe OSAS have an increase in P300 latency7-10.
OBJECTIVE
To assess changes in P300 amplitude and latency among primary snorers and patients with OSAS classi-fied by polysomnograms.
MATERIALS AND METHODS
This paper was approved by the Ethics in Re-search Committee of our Institution, under protocol number 117/2006. The individuals who participated in the study were given and agreed with the Informed Consent Form.
We assessed 66 patients, from both genders, in the age ranges between 22 and 59 years. The recording
was prospective and sequential, between December of 2006 and November of 2007.
The individuals were divided into two groups; a control group (CG), made up of 12 snorers, and a study group (SG), made up of 12 primary snorers, and a study group (OSAS G.), made up of 54 people with OSAS. All 66 individuals were submitted to polysom-nogram and were classified according to criteria from the American Academy of Sleep Disorders and from the Brazilian Association of Sleep Medicine11.
The following exclusion criteria were equally employed in both groups:
• Conductive hearing loss, mixed or sensorineu -ral, unilateral or bilate-ral, with mean values at the eighths of the frequencies between 500 and 4000 Hz greater than 25 dBHL.
• External and middle ear disorder.
• Patients with neurological disorders or demen -tia12,13 and diabetes mellitus14.
• Inclusion criteria for the control group:
- HAI: lower than 5 events/h
- Average oxymetry higher than 88%
• Inclusion criteria for the OSAS group
- HAI: greater than 5.1 events/h
- OSAS diagnosis, except for other sleep dis-OSAS diagnosis, except for other sleep dis-orders.
The polysomnogram was analyzed by the Medi-tron-Sonolab 620 device with 20 channels. The test was carried out at night, following the individual’s circadian cycle, during physiological sleep. We recorded ence-phalography; electro-oculography; EKG; oronasal air flow; chest, abdominal and body position sensors; digi-tal oxymetry; chin and anterior tibia electromyography. The OSAS classification, according to the Hypop-nea and ApHypop-nea Index (HAI), followed the criteria from the American Academy of Sleep Disorders and those from the Brazilian Association of Sleep Medicine11:
•Normal: HAI between 0 and 5 events per hour
• Mild OSAS: HAI between 5.1 and 15 events per hour
•Moderate OSAS: between 15.1 and 30 events per hour
•Severe OSAS: greater than 30.1 events per hour. The oxyhemoglobin saturation was considered normal when it was higher than 90%; should it be lower than this, without exceeding the 3% of the Total Sleep Time (TST).
electrodes; the active electrodes were placed on Cz and Fz; the reference electrode was on A2; and the ground electrode was placed on Fpz, according to international references10-20; we used impedance equal to or lower than 2 kΩ between the electrodes. The test technique was the target stimulus model. The target stimulus was the tone burst in the frequency of 2 kHz, randomly presented, in the probability of 20% of the stimuli; the frequent stimulus was made up by the tone burst in the frequency of 1kHz, with 80% probability of presenta-tion. The series of stimuli was of 250 stimuli at an in-terstimuli frequency of 1/s. The sound intensity of both stimuli was of 70 dB SPL and binaural. The response triggered by the perception of the stimuli was motor, requiring individuals to raise one of the fingers in their hands when they perceived rare stimuli.
In assessing the results, we considered the Fz register as standard for reproducibility and the Cz reg-ister for wave analysis.
The P300 was measured in amplitude and latency. The amplitude in microvolt (µv) was defined as being the potential difference between the baseline and the apex of the positive wave. Latency in milliseconds (ms) was defined as the period of time between the onset of the stimulus all the way to the wave apex.
In the presence of P300, we created the latency and amplitude tables, according to age, the HAI and oxyhemoglobin saturation in building scatter graphics.
The study of the P300 prevalence between the two groups was carried out by the Fisher’s exact test. The P300 prevalence and age range analyses were car-ried out by the simple regression logistics test.
We carried out t-Student tests for independent samples, in order to compare the values of P300 latency and amplitudes, between the two groups.
In the applied statistical tests, we used a 5% sig-nificant level (α = 0.05).
RESULTS
The CG had six men and six women; the mean age was 34.41 years, ranging between 22 and 54 years.
The OSAS Group had 46 men and eight women; with a mean age of 43.53 years, ranging between 24 and 59 years.
In the control group, the mean HAI was 2.61/h and it happened between 1.2/h and 4.6/h. The mean nadir of oxyhemoglobin saturation was 88%, and it varied between 77% and 94%; saturation below 90% did not exceed 2.7% of the TST.
In the OSAS group, the mean HAI was 39.51/h and it varied between 5.4/h to 106.7/h. The mean
oxyhemoglobin saturation nadir was 79.07% and it va-ried between 61% and 98%; saturation below 90% had a mean percentage value of 18.64% of the TST.
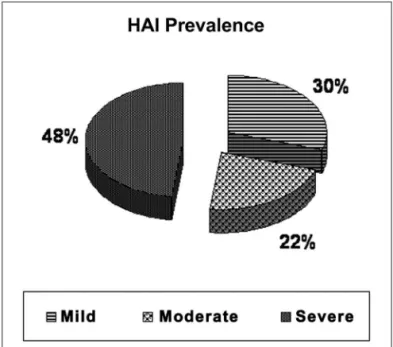
The percentage distribution according to the apnea severity in the OSAS group was mild in 30% (16/54), moderate in 22% (12/54) and severe in 48% (26/54) (Figure 1).
Figure 1. Distribution of the OSAS severity degree, according to the HAI.
P300 Prevalence
present absent
C.G 12 0
OSAS G. 36 18
Total 48 18
Table 1. P300 prevalence in the CG and OSAS group.
Fisher’s Exact Test: p=0.027 (significant).
P300 was recorded from all individuals in the CG. The mean latency was 303.56ms and it fluctuated be-tween 242.80ms and 347.42ms; the mean amplitude was 10.40µV and it oscillated between 5.88µV and 18.7µV.
P300 was recorded in 66.67% (36/54) of the individuals from the OSAS group. Mean latency was 329.29ms; and it varied between 227.18ms and 463.49ms; the mean amplitude was 6.77µV and it varied between 2.22µV and 14.60µV (Table 1).
oxymetry), there was an inverse correlation between HAI and the oxymetry (Figure 2).
The P300 amplitude was lower in the OSAS Group, by the mean amplitude difference between the CG and the OSAS group (mean difference =3.6uV; p=0.003; CI:1.3 – 5.8; t-student test); latency was similar in both groups, by the mean latency difference between the CG and the OSAS group (mean difference =25.7; p=0.089; CI: -55.6 - 4.1, t-Student test) (Table 5).
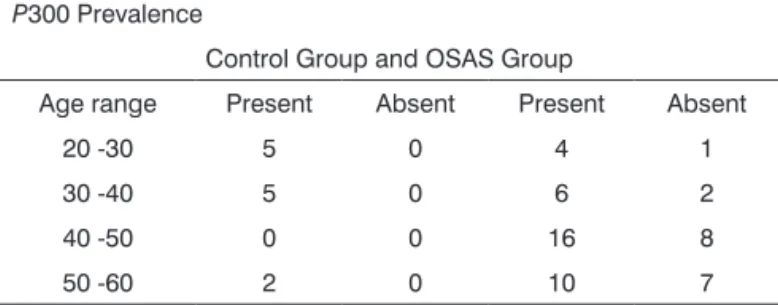
P300 Prevalence
Control Group and OSAS Group
Age range Present Absent Present Absent
20 -30 5 0 4 1
30 -40 5 0 6 2
40 -50 0 0 16 8
50 -60 2 0 10 7
Table 2. P300 prevalence, according to age range in the CG and OSAS group.
Simple logistics regression: p=0.232.
The prevalence of the auditory P300 in the OSAS group (66.7%) was lower than that in the CG (100%) (Fisher’s Exact Test; p=0.027).
In both groups, age did not influence the P300, through the logistic regression analysis (p=0.232) (Ta-ble 2).
Mean sd Minimum Median Maximum
Age 34.4 9.8 22.0 33.5 54.0
Oxymetry Nadir 88.0 4.4 77.0 89.0 94.0
Latency 303.6 28.1 242.8 307.6 347.4
Amplitude 10.4 4.2 5.9 9.7 18.7
Table 3. Control group: mean, standard deviation; minimum, maximum and median values for age, oxymetry nadir and P300
latency/amplitude (N=12).
Mean sd Minimum Median Maximum
Age 43.9 8.9 24.0 45.5 59.0
Oxymetry nadir 79.1 8.3 61.0 81.0 98.0
Latency 329.3 48.5 227.2 324.8 463.5
Amplitude 6.8 3.1 2.2 6.4 14.6
Table 4. OSAS group: mean, standard deviation; minimum, maximum and median values for age, oxymetry nadir and P300
latency/amplitude (N=54).
Tables 3 and 4 show the P300 minimum and maximum values, the mean, median and standard de-viation (SD) of age, oxymetry, and amplitude/latency in the CG and OSAS Group.
Mean difference Confidence interval (95%) C.G. – OSAS group p Lower limit Upper limit
Latency -25.7 0,089 -55.6 4.1
Amplitude 3.6 0,003* 1.3 5.8
Table 5. Student-t test comparing Latency and Amplitude between the control and the OSAS groups.
p*: significant “p” value.
Figure 2. Oxymetry mean saturation distribution, according to the HAI in both study groups.
DISCUSSION
Patients with neurologic disorders12,13 and diabe-tes mellitus14 were taken off the study because of P300 changes caused by these disorders.
The hearing loss exclusion criteria was establi-shed in order to avoid biases; individuals with periphe-ral hearing loss may influence the P300 and compromise the obtained results15.
The P300 was executed following the individual’s circadian cycle in the morning, when the awareness and concentration status are ideal and favor the P300 generation16,17. The response required from the target stimulus was motor, in order to maintain the state of awareness - factors which favor the P300 acquisition12,18.
concerned: the mean age of the CG (34.41 years) was lower than that of the OSAS group (43.52 years). The likelihood of a snorer with more than 40 years of age having OSAS is higher and proportional to age1,13, and this made it difficult to have a CG sample of equal age range from that of the OSAS group.
The analysis of the scatter chart between the P300 and polysomnogram variables in both groups showed that the only variables which had a correlation were HAI and oxymetry; such correlation was inverse, and the higher the HAI, the lower the oxyhemoglobin satu-ration values. The brain cortex and the hippocampus, P300 generation structures, were described as being particularly sensitive to hypoxemia21; and hypoxemia may induce neuronal lesions and hippocampus atrophy, which restricts the neurocognitive performance22.
The P300 prevalence was significantly lower in the OSAS Group – 66.67% (36/54). Such data may be justified by the fact that 70% of the individuals with OSAS had the moderate and severe types; therefore, with a greater impairment in awareness, attention and concentration3,23. On the other hand, there are papers reporting P300 changes in individuals with OSAS; however, without mentioning the absence of such potential7, 24.
The P300 amplitude in the OSAS Group was sig-nificantly lower. The amplitude reflects brain activity in the parietal-temporal and pre-frontal areas, associated with the auditory memory6,15 which would be reduced in individuals with OSAS.
In the present study, the P300 latency was not a sensitive parameter in OSAS patients. Latency is asso-ciated to the interstimuli frequency to the individual’s attention and concentration15,25. The studies which sho-wed a significant delay in P300 latency had individuals with severe OSAS13, of sleep deprivation associated with forced awakeness6 and because of their circadian cycle phase17.
On the other hand, a study involving individuals with OSAS showed that the attention deficit is more severe in young people, when compared to elderly (threshold age: 50 years), and that age it does not in-teract with OSAS in worsening the cognitive deficit26.
CONCLUSION
The reduction in auditory P300 amplitude in the OSAS patients of the present study suggests a cognitive dysfunction, induced by the impairment in auditory memory.
REFERENCES
1. Tufic S. Histórico e classificação dos distúrbios do sono. In: Tufic S. Sono - Aspectos clínicos. São Paulo; Editora Instituto do Sono - UNIFESP. 2000;(1):1-13.
2. Gordon E, Rennie C, Collin L. Magnetoencephalography and late component ERPs. Clin Exp Neurol. 1990;27:113-20.
3. Picton TW. The P300 wave of the human event related potential. J Clin Neurophysiology. 1992;9(4):456-79.
4. Morris AM, So Y, Lee KA, Lash AA, Becker CE. The P300 event-related potential. The effects of sleep deprivation. J Occup Med. 1992;34(12):1143-52.
5. Brualla J, Romero MF, Serrano M, Valdizan JR. P300 and audi-tory information processing during natural sleep. Rev Neurol. 1999;29(6):503-7.
6. Lee HJ, Kim L, Suh KY. Cognitive deterioration and changes of
P300 during total sleep deprivation. Psychiatry Clin Neurosci. 2003;57(5):490-6.
7. Van Nunen PE, Declerck AC. P300, alertness and cognition. Acta Psychiatr Belg. 1994;94(2):96-7.
8. Sangal RB, Sangal JM. Obstructive sleep apnea and abnormal P300 latency topography. Clin Electroencephalogr. 1997;28(1):16-25. 9. Peng B, Li S, Huang X. Abnormal P3 latency in obstructive sleep
apnea syndrome, but normal in snore. Zhonghua Yi Xue Za Zhi. 2000;80(6):429-31.
10. Inoue Y, Nanba K, Kojima K, Mitani H, Arai AH. P300 abnormali-ties in patients with severe sleep apnea syndrome. Psychiatry Clin Neurosci. 2001;55(3):247-8.
11. Togueiro SMGP. Quadro clínico e diagnóstico em distúrbios respiratórios do sono. In: Tufic S. Sono - Aspectos clínicos. São Paulo: Editora Instituto do Sono - UNIFESP. 2000;(9):1-12. 12. Polich J, Ehlers CL, Otis S, Mandell AJ, Bloom FE. P300 latency
reflects the degree of cognitive declining in dementing illness. Electroenceph Clin Neurophysiol. 1986;63(2):138-44.
13. Sangal RB, Sangal JM. P300 latency: abnormal in sleep apnea with somnolence and idiophatic hypersomnia, but normal in narcolepsy. Clin Eletroencephalogr. 1995;26(3):146-53.
14. Alvarenga KF, Duarte JL, Silva DPC, Agostinho-Perce RS, Negra-to CA, Costa AO. Potencial cognitivo P300 em indivíduos com diabetes mellitus. Braz J Otorhinolaryngol. 2005;71(2):202-7. 15. Fjell AM, Walhovd KB. Effects of auditory stimulus intensity
and hearing threshold on the relationship among P300, age and cognitive function. Clin Neurophysiol. 2003;114(5):779-807. 16. Geisler MW, Polisch J. P300 and time of day: circadian
rhythms, food intake and body temperature. Biol Psychol. 1990;31(2):117-36.
17. Higuchi S, Liu Y,Yuasa T, Maeda A, Motohashi. Diurnal varia-tion in the P300 component of human cognitive event-related potential. Chronobiol Int. 2000;17(5):669-78.
18. Duarte JL, Alvarenga KF, Costa OA. Potencial cognitivo P300 realizado em campo livre: aplicabilidade do teste. Rev Bras Otor-Rev Bras Otor-rinolaringol. 2004;70(6):781-6.
19. Kelly DA, Claypoole KH, Coppel DB. Sleep apnea syndrome: symptomatology, associated features, and neurocognitive cor-relates. Neurophysiol Rev. 1990;1(4):323-42.
20. Bittencourt LRA. Sindrome da apneia e hipopneia do sono obs-trutiva. In: Tufic S. Sono - Aspectos clínicos. São Paulo: Editora Instituto do Sono - UNIFESP. 2000;9:1-14.
22. Gale SD, Hopkins RO. Effects of hypoxia on the brain: neuroim-aging and neuropsychological findings following carbon mon-oxide poisoning and obstructive sleep apnea. J Int Neuropsycol Soc.2004;10(1):60-71.
23. Polich J, Kok A. Cognitive and biological determinants of P300: an integrative review. Biol Psychol.1995;41(2):103-46.
24. Quan SF, Wright R, Baldwin CM, Kaemingk KL, Goodwin JL, Kuo TF, et al. Obstructive sleep apnea-hyponea and neurocog-nitive functioning in the Sleep Heart Health Study. Sleep Med. 2006;7(6):498-507.
25. Gosselin N, Mathieu A, Mazza S, Petit D, Malo J, Montplaisir J. Attentional deficits in patients with obstructive sleep apnea syndrome: an event-related potential study. Clin Neurophysiol. 2006;117(10):2228-35.