Long-latency auditory evoked potentials in sound field in
normal-hearing children
Potenciais evocados auditivos de longa latência em campo sonoro
em crianças audiologicamente normais
Carla Gentile Matas1, Fernanda Bicalho Lima Silva1, Barbara Carrico1, Renata Aparecida Leite1, Fernanda
Cristina Leite Magliaro1
ABSTRACT
Purpose: To characterize the Long-Latency Auditory Evoked Potentials
(LLAEP) (P1, N1, P2, N2, P300) with acoustic stimuli presented in sound field system in children with normal hearing, as well as to verify the stability of these potentials. Methods: This prospective, longitudinal study comprised 17 children with ages between 6 and 13 years and hearing thresholds within normal. The LLAEP P1, N1, P2, N2, P300 were recor-ded with speech stimuli and tone burst presented in sound field system, in three different moments: initial assessment (M0), three months after the initial assessment (M3), and nine months after the initial assessment (M9). Results: When the speech stimuli was used, there was a decrease in the latency values of components P1 (M0xM3/M0xM9/M0xM3xM9) and P2 (M0xM9), as well as an increase in the amplitude of P300 (M0xM3) over time. With the tone bust stimuli, it was verified a decrease in the latency values of P300 (M0xM9) over time. Conclusion: it was possible to identify the components of the LLAEP in most individuals. The P1, N1, P2, N2 (tone burst) and N1 and N2 (speech) did not change their latencies and amplitudes between the different moments of evaluation, suggesting stability of this potential in the period of 9 months. The P300 was the component most sensitive to the time intervals considered, since it presented modifications over time that indicated maturation of the central auditory nervous system. The latencies of all components obtained with speech stimulus were higher than with tone bursts, indicating that different stimuli generate different cortical responses.
Keywords: Evoked potentials, Auditory; Event-related potentials, P300;
Hearing; Child; Auditory threshold
RESUMO
Objetivo: Caracterizar os Potenciais Evocados Auditivos de Longa
La-tência (PEALL) (P1, N1, P2, N2, P300) em campo sonoro, em crianças audiologicamente normais, bem como verificar a estabilidade destes potenciais. Métodos: Trata-se de um estudo prospectivo, longitudinal, composto por 17 crianças audiologicamente normais, na faixa etária de 6 a 13 anos de idade, com limiares de audibilidade dentro da normalidade. Foram captados os PEALL P1, N1, P2, N2, P300 com estímulos de fala e tone burst, em três momentos de avaliação: avaliação inicial (M0), três meses após a avaliação inicial (M3) e nove meses após a avaliação inicial (M9). Resultados: Foi observada diminuição dos valores de latência dos componentes P1 (M0xM3 / M0xM9 / M0xM3xM9) e P2 (M0xM9) e aumento no valor de amplitude do P300 (M0xM3), quando obtidos com estímulo de fala, e diminuição no valor de latência do P300 (M0xM9), obtido com estímulo tone burst. Conclusão: Foi possível identificar os componentes do PEALL na maioria dos indivíduos. Os componentes P1, N1, P2, N2 (tone burst) e N1 e N2 (fala) não sofreram modificações em latências e amplitudes entre os diferentes momentos de avaliação, sugerindo estabilidade deste potencial no período de nove meses. O P300 demonstrou ser um componente mais sensível a esse intervalo de tempo entre as avaliações, pois sofreu modificações indicativas de maturação do sistema nervoso auditivo central. As latências de todos os componentes obtidos com estímulo de fala foram maiores do que com tone burst, de-monstrando que estímulos diferentes geram respostas corticais distintas.
Descritores: Potenciais evocados auditivos; Potencial evocado P300; Audição; Criança; Limiar auditivo
Study conducted at the Investigation Laboratory in Auditory Evoked Potentials, Department of Physical Therapy, Speech-Language Pathology and Audiology, and Occupational Therapy, School of Medicine, Universidade de São Paulo – USP – São Paulo (SP), Brazil.
(1) Department of Physical Therapy, Speech-Language Pathology and Audiology, and Occupational Therapy, School of Medicine, Universidade de São Paulo – USP – São Paulo (SP), Brazil.
Funding: Fundação de Amparo à Pesquisa do Estado de São Paulo (FAPESP), process number 2011/23997-5. Conflict of interests: No
Authors’ contribution: CGM: advisor, research design, schedule preparation, data analysis, manuscript review, approval of the final version; FBLS: main re-searcher, research design, schedule preparation, literature review, data collection and analysis, writing; BC: literature review, data collection and analysis; RAL: research design, schedule preparation, literature review, data collection and analysis, writing, approval of the final version; FCLM: research design, literature review, data analysis, writing, approval of the final version.
INTRODUCTION
Researching the Auditory Evoked Potentials (AEP) means to evaluate the auditory system from its peripheral portion to its most central portion, obtaining information on its opera-tion. The AEP may be classified, according to their onset time, into short, middle or long latency(1-3).
The components of the Long-Latency Auditory Evoked Potentials (LLAEP) are represented by peaks, according to the polarity and the latency value, that have positive (P) and negative (N) voltage(4). The first components of the LLAEP
that indicate the arrival of the acoustic information to the auditory cortex and the beginning of the cortical auditory processing are P1, N1, P2 and N2(5). For the age group from 3
to 12 years, the P1 component presents latencies between 54 and 75 ms, the N1 component, between 83 and 135 ms, the P2 component, between 137 and 194 ms, and the N2 component, between 200 and 280 ms(6). The P300 or Cognitive Evoked
Potential(7) follows these first components of the LLAEP,
appearing between 241 and 396 ms in the same age group(6).
In addition to the classification according to the onset of responses, the AEP can be classified by the influences that extrinsic or intrinsic characteristics have on them. The com-ponents P1, N1 and P2 are considered exogenous because they are influenced by extrinsic events related to the characteristics of the stimulus, while the N2 and the P300 are considered endogenous, since they are influenced by intrinsic events, such as perception and cognition(6).
Although the generators of components P1, N1, P2 and N2 are not well defined, it is known that the thalamic projections and the primary auditory cortex are involved in the generation of P1, the supratemporal auditory cortex is involved in the generation of N1 and N2, and the lateral-frontal supratemporal auditory cortex, in the generation of P2(6). These components
present many clinical applications and are currently very used as biomarkers for the maturation/plasticity of the central audi-tory pathway in users of hearing aids and cochlear implant(8-10).
The P300 is an AEP which is affected by the attention ap-plied to the stimulus (discrimination, integration an attention)(9)
and is generated in the primary and secondary areas of the auditory cortex(11). This potential is used to help in the
inves-tigation of the electrochemical mechanism of cognition(12),
and may be altered when there are deficits in selective atten-tion mechanisms, states of consciousness and psychological conditions that can impair attention(2,6,7).
For the development of the sensorial cortex pathways, both intrinsic and extrinsic factors are necessary and, in the absence of sensorial stimuli - as in hearing impairment -, normal development and the connections that are necessary to form a functional hearing system are impaired(13). With that
in mind, the LLAEP are currently very much used to evaluate the central auditory pathway of electronic hearing aid users, since they provide objective data regarding the functionality
of cortical structures, in addition to quantifying the maturation of the central nervous system of children using individual hearing aids and cochlear implant.
Thus, it is important to characterize the Long-Latency Auditory Evoked Potentials (P1-N1-P2-N2 complex and P300) in sound field system, in normal hearing children. The stability of these potentials must also be verified, in order to provide parameters for further studies using these potentials in sound field system for the specific evaluation of children using hearing aids or cochlear implant, which may help in the evaluation, diagnosis and therapeutic monitoring of these hearing impairments.
Therefore, the purpose of this study was to characterize the Long-Latency Auditory Evoked Potentials (components P1, N1, P2, N2 and P300) in sound field system, in normal hearing children, as well as to verify the stability of these potentials.
METHODS
This was a prospective longitudinal study approved by the Ethics Committee for the Analysis of Research Projects (CAPPesq) of the School of Medicine, Universidade de São Paulo (USP), under protocol number 0474/11. Subjects’ legal guardians read and signed the Free and Informed Consent for their participation in the study.
Participants were 17 normal-hearing children with ages between 6 and 13 years (mean age of 8 years and 7 months) – eleven male and six female – who fulfilled the following inclusion criteria: hearing thresholds ≤15 dBHL in all the frequencies tested (250, 500, 1000, 2000, 4000, 8000 Hz); normal brainstem auditory evoked potential (BAEP - analysis of the absolute latencies of waves I, III and V at 80 dBnHL, following the normality criteria established by the Intelligent Hearing System® equipment); absence of hearing and lan-guage complaints; absence of neurological impairments or any alterations that could interfere with the Auditory Evoked Potentials.
Data was collected using the following procedures: clini-cal history protocol; inspection of the external auditory canal using a Heine otoscope; acoustic immittance measures using the Interacoustic® AT235 immittance meter; pure-tone and speech audiometry using the Grason Stadler® GSI61 au-diometer and TDH 50 supra-aural headphones; BAEP and LLAEP (components P1-N1-P2-N2 and P300) using the Intelligent Hearing System® two-channel equipment, model Universal Smart Box JrTM Smart EP, calibrated at hearing
level (dBnHL), with ER3A insert earphones and the SK-105 sound field system.
to pay attention to the rare stimuli that appeared randomly within a series of frequent stimuli, raising her hand when the rare event was detected. During the procedure, the child was instructed to look to a fixed point in the room, two meters in front of her. The traces were accepted when there was a maximum of 30 artifacts.
The LLAEP were performed in three different moments: initial assessment – zero months – M0; three months after the initial assessment – M3; and nine months after the initial assessment – M9. The assessments were always performed by the same professional, and the analysis of the LLAEP components was performed by the same professional and two judges (professionals with expertise in electrophysiology), considering the consensus as the final result.
To record the LLAEP, the active electrode was placed on the vertex (Cz), the ground electrode (Fpz) on the forehead, and the reference electrodes (M2 and M1) on the right and left mastoids(14). A window of 510 ms was used, with high-pass
filter of 1 Hz, low-pass filter of 30 Hz and 75 dBnHL intensity. Tone burst stimuli were used at 1000 Hz (frequent) and 2000 Hz (rare), both with duration of 50 ms and interstimulus interval (ISI) of 860 ms.
The synthetic speech stimuli used were the syllable /ba/, with duration of 114 ms (frequent stimulus) and ISI of 799 ms, and the syllable /da/, with duration of 206 ms (rare stimulus) and ISI of 690 ms. The specific characteristics of the speech stimuli /ba/ and /da/ are described in Chart 1.
The P300 was recorded at a rate of 1.1 stimuli per sec-ond, with a total of 300 stimuli, from which 15% were rare stimuli. The impedance values of the electrodes were kept below 5 kohms.
Two traces were registered, one related to the rare stimulus, in which the wave P300 was identified and analyzed regard-ing its latency and amplitude, and the other one related to the frequent stimulus, in which the components P1, N1, P2 and
N2 were identified and analyzed according to their latency and amplitude.
The mean, median, variance and standard deviation values for the latencies and amplitudes of the LLAEP components with the tone burst and speech stimuli were calculated for each moment of the assessment. Then, the mean values of latency and amplitude in the different moments of the assessment were compared using the ANOVA test with significance level of 0.05 (5%) and 95% confidence intervals, characterizing normality. Individuals that did not present one of the LLAEP components were excluded from the statistical analyses.
The percentages of responses were calculated per subject for each LLAEP component, in each of the three assessments. The total number of subjects present in each assessment was considered for this analysis.
The number of subjects that returned for the second (M3) and third (M9) assessments varied. Thus, the final number of subjects for the calculation of each component varied across assessments: M0: 17 subjects; M3: 10 subjects; M9: 11 sub-jects. Therefore, the final number of subjects varied for the calculation of each component.
RESULTS
The results did not evidence significant differences between the three assessments both for the amplitudes P1-N1, P2-N2 and P300 (in µv) and for the latencies of the components P1, N1, P2 and N2 (in ms) of the LLAEP obtained with tone burst stimulus in normal-hearing children. On the other hand, the comparison of the P300 latency values (in ms) showed significant difference only between M0 and M9, evidencing greater latencies for the P300 in the first assessment (M0) (Tables 1 and 2).
When the amplitudes P1-N1, P2-N2 and P300 (in µv) ob-tained with speech stimulus were compared, it was noticed a significant difference between M0 and M3 for the amplitude of the P300, with greater values in the moment M3. No differ-ences were found between M0 and M9, M3 and M9, and M0, M3 and M9 (Table 3).
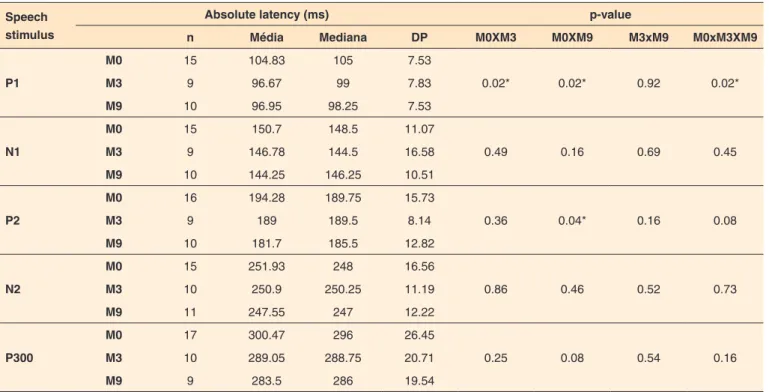
With regards to the comparison of the latencies of compo-nents P1, N1, P2, N2 and P300 (in ms) obtained with speech stimulus, statistically significant differences were observed between M0 and M3 for the component P1, M0 and M9 for the components P1 and P2, and M0, M3 and M9 for the component P1, evidencing greater latencies for the components P1 and P2 in the first assessment (M0), in all the comparisons (Table 4). There was a high percentage of presence of responses for both speech and tone burst stimuli in the three assessments (Figures 1 and 2).
DISCUSSION
The maturation process of the central auditory system occurs mainly during the first years of life(15), however, some
Chart 1. Specific characteristics of the speech stimuli /ba/ and /da/, used to obtain the Long-Latency Auditory Evoked Potentials
Syllable /ba/ /da/
Stimuli duration 114.875 ms 206.275 ms
Consonant duration 18 ms 9 ms
Vowel duration 75 ms 174 ms
Pitch (Start-End) 112.4 -111.2 Hz 109.1-102.1 Hz Formant (Hz)
F1 818 732
F2 1378 1335
F3 2024 2498
F4 2800 3058
F5 4436 3828
authors describe that the development of components P1, N1 and P2 continues during the second decade of life. Thus, it is observed that the maturation process stabilizes in the adult age, though it suffers changes in puberty, and occurs gradually and linearly, with the greatest modifications observed when children are compared to adults(4,6). The latency values of the
N2 component begins to be established at 3 years of age, reaching adult standards at 12 years(6).
In the present study, there was a higher percentage of absence of responses for components N1 (18% at M9) and P2 (17% at M0 and 18% at M9) for the tone burst stimulus, which agrees with literature findings for a similar age(16). For
Table 1. Comparison of amplitudes in the assessment of normal-hearing children
Tone burst Amplitudes (microvolts) p-value
n Mean Median SD M0xM3 M0xM9 M3xM9 M0xM3xM9
P1-N1
M0 15 4.42 3.91 1.77
0.92 0.47 0.25 0.76
M3 9 4.33 4.17 2.45
M9 9 4.96 5.32 1.52
P2-N2
M0 14 6.54 6.03 3.97
0.86 0.84 0.74 0.94
M3 9 6.82 5.32 4
M9 9 6.20 6.04 3.95
P300
M0 17 12.58 10.95 4.15
0.15 0.19 1.0 0.19
M3 10 10.38 11.44 2.69
M9 11 10.37 10.97 3.53
ANOVA (p<0.05)
Note: M0 = zero months; M3 = three months; M9 = nine months; n = sample size; SD = standard deviation
Table 2. Comparison of latencies in the assessment of normal-hearing children
Tone burst Absolute latency (ms) p-value
n Mean Median SD M0XM3 M0XM9 M3xM9 M0xM3XM9
P1
M0 15 88.47 84.5 19.19
0.06 0.21 0.22 0.09
M3 9 74.89 72.5 9.39
M9 10 80.15 81.5 8.48
N1
M0 15 123.73 120.5 22.26
0.47 0.92 0.3 0.7
M3 10 117.6 109.25 17.49
M9 9 124.67 115.5 20.45
P2
M0 14 171.31 170.5 25.11
0.63 0.47 0.21 0.52
M3 9 166.39 174.5 20.42
M9 9 178.11 178.5 17.22
N2
M0 15 227.1 227 20.85
0.63 0.84 0.89 0.92
M3 10 231.25 233.5 20.35
M9 11 229.45 234 35.93
P300
M0 17 307.88 306 17.84
0.32 0.04* 0.56 0.19
M3 10 298.66 308.75 29.34
M9 11 292.09 296.5 21.33
*Significant values – ANOVA (p<0.05)
Note: M0 = zero months; M3 = three months; M9 = nine months; n = sample size; SD = standard deviation
the speech stimulus, the percentage of absence was relatively homogeneous for components P1 (12% at M0), N1 (12% at M0) and P2 (10% at M3).
Although literature reports absence of components N1 and P2 in children with ages between 4 and 9 years(16), this
study’s data showed a higher percentage of presence than absence of all the studied components (P1, N1, P2, N2 and P300), for both speech and tone burst stimuli. Literature(17)
Table 3. Comparison of amplitudes obtained with speech stimulus in the assessment of normal-hearing children
Speech stimulus
Amplitudes (microvolts) p-value
n Mean Median SD M0XM3 M0XM9 M3xM9 M0xM3XM9
P1-N1
M0 15 6.34 3.36 1.9
0.57 0.41 0.10 0.74
M3 9 6.91 10.34 2.91
M9 10 4.88 4.75 2.05
P2-N2
M0 15 8.09 16.79 4.20
0.98 0.46 0.78 0.14
M3 9 7.38 14.08 3.96
M9 10 6.88 6.62 3.67
P300
M0 17 14.12 18.57 4.31
0.03* 0.12 0.39 0.06
M3 10 19.24 48.58 6.98
M9 9 16.94 17.05 4.27
*Significant values – ANOVA (p<0.05)
Note: M0 = zero months; M3 = three months; M9 = nine months; n = sample size; SD = standard deviation
Table 4. Comparison of latencies in the assessment of normal-hearing children
Speech stimulus
Absolute latency (ms) p-value
n Média Mediana DP M0XM3 M0XM9 M3xM9 M0xM3XM9
P1
M0 15 104.83 105 7.53
0.02* 0.02* 0.92 0.02*
M3 9 96.67 99 7.83
M9 10 96.95 98.25 7.53
N1
M0 15 150.7 148.5 11.07
0.49 0.16 0.69 0.45
M3 9 146.78 144.5 16.58
M9 10 144.25 146.25 10.51
P2
M0 16 194.28 189.75 15.73
0.36 0.04* 0.16 0.08
M3 9 189 189.5 8.14
M9 10 181.7 185.5 12.82
N2
M0 15 251.93 248 16.56
0.86 0.46 0.52 0.73
M3 10 250.9 250.25 11.19
M9 11 247.55 247 12.22
P300
M0 17 300.47 296 26.45
0.25 0.08 0.54 0.16
M3 10 289.05 288.75 20.71
M9 9 283.5 286 19.54
*Significant values – ANOVA (p<0.05)
Note: M0 = zero months; M3 = three months; M9 = nine months; n = sample size; SD = standard deviation
Note: M0 = zero months; M3 = three months; M9 = nine months
Figure 2. Percentage of presence of LLAEP components with tone burst stimulus
Note: M0 = zero months; M3 = three months; M9 = nine months
ms; tone burst: 860 ms) presented seems to have been best suitable for eliciting the responses of all LLAEP components for the studied age.
According to the literature, the P300 is not easily iden-tified in children under 8 years of age, presenting increased latency values and altered morphology. As age increases, the morphology becomes more defined and the latency values decrease, reaching values close to those of adults between 14 and 17 years of age(18). The results of the present study
showed the presence of P300 in all the moments studied, for both speech and tone burst stimuli. These data seem to agree with the study mentioned above, since the studied population was younger than 13 years old (mean of 8 years), and it was possible to indentify the P300 in all subjects.
The LLAEP have been frequently used in different popu-lations, since it provides objective data on the functionality of auditory cortical structures. When performed in children, it is indispensable to characterize them considering the matu-ration period of the auditory central nervous system, as well to establish normality parameters in normal-hearing children from different age groups(19).
According to the results from the present study, it was verified that the P1 component presented mean latencies that were greater than the normality established for the tone burst in the studied age group(6) for all the moments of assessment
with speech stimulus and for M0 and M9 with the tone burst. That shows the importance of establishing normality standards for different types of acoustic stimuli. Specialized literature have reported that the latency values of the P1 component decreases until 20 years of age(13,20,21).
The N1 component obtained with speech stimulus in the moment M0 also presented mean latency values higher than established in literature(22). However, the N1 component
ob-tained with tone burst stimulus in all three moments of asses-sment presented latencies within the normality parameters(6).
It was also observed that the components P2, N2 and P300, with speech and tone burst stimuli, presented mean latency values within the normality established in literature in all three moments of assessment(6,22,23).
A previous study have shown that spectral differences for speech sounds (three consonants) are coded differently in the auditory cortex, producing different standards of responses (latency and amplitude) for the components P1 and N2. Their findings indicated that the consonant of medium frequency (/g/) demonstrated earlier latency and higher amplitude for both components, when compared to the consonants of low (/m/) and high (/t/) frequencies(24). In the present study, it was
noticed that the mean latencies of the components P1, N1, P2, N2 obtained with speech stimulus (syllable /ba/ frequency
≈ 500 Hz) presented greater values than the ones obtained with tone burst stimulus (1000 Hz). This may be due to the frequency of the stimuli used (medium for the tone burst and low for the speech), observing early latencies for the medium
frequency stimuli. Another factor related to these findings is the duration of the different stimuli: because the speech sti-mulus is longer than the tone burst, it might take longer to be decoded by the auditory cortex structures. Thus, the acoustic characteristics used in the recording of AEP may interfere with the latency values(22).
These findings comply with the literature, which has reported reduced latencies for the components P1, N1 and P2 obtained with tone burst stimulus, when compared to the latencies obtained with speech stimulus(20). It is believed
that the increased mean latency values for the components obtained with speech stimulus are due to the fact that the speech stimulus is more complex than the tone burst stimu-lus, thus requiring more time for processing the acoustic information.
It is worth noting that a decrease in the latency values of the P1 was identified in the comparisons between the results obtained at M0 and M3, M0 and M9, and M0 X M3 X M9 with speech stimulus, demonstrating that the maturation process of the structures involved in the generation of this component can be observed even in a short period of time. The decrease in the latency of P2 (significant decrease in the values of latencies between M0 and M9) also showed the maturation process of the auditory pathway. Therefore, the findings for both P1 and P2 comply with the literature(19), in which a decrease in
the latency values of these components was observed as age increased, even though it has used click stimulus and insert earphones to obtain the components P1, N1 and P2.
Regarding the P300, there was a decrease in the mean latency values with the tone burst stimulus between M0 and M9, and an increase in the amplitude values with speech stimulus between M0 and M3, showing improvement in the neural synchrony and in the speed of acoustic information processing, as well as a higher amount of neurons activated and an improved neuronal connectivity, probably due to the maturation of the auditory central nervous system.
The present study did not find significant differences for the amplitudes P1-N1 and P2-N2 with both speech and tone burst stimuli in any of the three moments of assessment, corroborating literature, which suggests that typically de-veloping children present stability in the amplitude of these components(25).
It was also noticed in this study that none of the subjects presented absence of all of the LLAEP components. The presence of the components prevailed in all assessments for both speech and tone burst stimuli. This finding corrobora-tes another study(10), which observed the presence of waves
in most of the normal-hearing children evaluated using the LLAEP, when stimuli were presented in audible level.
Complex stimuli seem to require more time to be decoded or, yet, more cortical structures for their processing.
CONCLUSION
It was possible to identify most LLAEP components in sound field system in normal hearing children, at three diffe-rent moments of assessment.
There were no changes in the latencies and amplitudes of the components P1, N1, P2 and N2 obtained with tone burst stimulus, and N1 and N2 obtained with speech stimu-lus between the different moments of evaluation, suggesting stability of this potential for the period between initial and final assessments (9 months).
There was a decrease in the latency of the components P1 and P2 obtained with speech stimulus across the evaluations, and a decrease in the latency and increase in the amplitude of the P300 obtained with tone burst and speech stimuli, respec-tively, across the different moments of assessment, suggesting modifications that indicate maturation of the auditory central nervous system.
REFERENCES
1. Ruth RA, Lambert PR. Auditory evoked potentials. Otolaryngol Clin North Am. 1991;24(2):349-70.
2. Hall JW. Overview of auditory neurophysiology: past, present, and future. In: Hall JW. (Org.).New handbook of auditory evoked responses. Boston: Pearson Education; 2007. p. 1-34 .
3. Matas CG, Silva FN, Leite RA, Samelli AG. Estudo do efeito de supressão no potencial evocado auditivo de tronco encefálico. Pro Fono.2010;22(3):281-6. http://dx.doi.org/10.1590/S0104-56872010000300021
4. Ventura LMP. Maturação do sistema auditivo em crianças ouvintes normais: potenciais evocados auditivos de longa latência [dissertação]. Bauru: Universidade de São Paulo, Faculdade de Odontologia; 2008.
5. Martin BA, Tremblay KL, Stapells DR. Principles and apllications of cortical auditory evoked potentials. In: Burkard RF. Don M. Eggermont JJ. (Orgs.). Auditory evoked potentials: basic principles and clinical application.Baltimore: Lippincott Williams & Wilkins; 2007. p. 483-507.
6. McPherson DL. Late potentials of the auditory system. San Diego:
Singular; 1996.
7 Duarte JL, Alvarenga KF, Banhara MR, Melo ADP, Sá RM, Costa OA. Potencial evocado auditivo de longa latência-P300 em indivíduos normais: valor do registro simultâneo em Fz e Cz. Rev Bras Otorrinolaringol. 2009;75(2):231-6.
8. Sharma A, Martin K, Roland P, Bauer P, Sweeney MH, Gilley P et al. P1 latency as a biomarker for central auditory development in children with hearing impairment. J Am Acad Audiol. 2005;16(8):564-73. http://dx.doi.org/10.3766/jaaa.16.8.5
9. Dorman MF, Sharma A, Gilley P, Martin K, Roland P. Central
Auditory development: evidence from CAEP measurements in children fit with cochlear implants. J Commun Disord. 2007;40(4):284-94. http://dx.doi.org/10.1016/j.jcomdis.2007.03.007 10. Glista D, Easwar V, Purcell DW, Scollie S. A pilot study on cortical auditory evoked potentials in children: aided caeps reflect improved high-frequency audibility with frequency compression hearing aid technology. Int J Otolaryngol. 2012;2012:ID 982894. http://dx.doi. org/10.1155/2012/982894
11. M u s i e k F E , B a r a n JA , P i n h e i r o M L . B e h av i o r a l a n d electrophysiological test procedures. In: Musiek FE. Baran JA. Pinheiro ML. (Org.) Neuroaudiology: case studies. San Diego: Singular Publishing Group, 1994. p. 7-28.
12. Visioli-Melo JF, Rotta NT. Avaliação pelo P300 de crianças com e sem epilepsia e rendimento escolar. Arq Neuropsiquiatr. 2 0 0 0 ; 5 8 ( 2 B ) : 4 7 6 8 4 . h t t p : / / d x . d o i . o rg / 1 0 . 1 5 9 0 / S 0 0 0 4 -282X2000000300013
13. Sharma A, Gilley PM, Dorman MF, Baldwin R. Deprivation-induced cortical reorganization in children with cochlear i m p l a n t s . I n t J A u d i o l . 2 0 0 7 ; 4 6 : 4 9 4 - 9 9 . h t t p : / / d x . d o i . org/10.1080/14992020701524836
14. Jasper H. The ten-twenty system of the International Federation. Electroencephalogr Clin Neurophysiol. 1958;10(2):371-5. 15. Musiek FE, Verskest S, Gollegly K. Effects of neuromaturation
of auditory evoked potentials. Semin Hear. 1988;9(1):1-13. http:// dx.doi.org/10.1055/s-0028-1085648
16. Ceponiene R, Rinne T, Näätänen R. Maturation of cortical sound processing as indexed by event-related potentials. Clin Neurophysiol. 2002;113(6):870-82. http://dx.doi.org/10.1016/S1388-2457(02)00078-0
17. Ceponiene R, Cheou M, Näätänen R. Interstimulus interval and auditory event-related potentials in children: evidence for multiple generators. Electrophysiol Clin Neurophysiol. 1998;108:345-54. http://dx.doi.org/10.1016/S0168-5597(97)00081-6
18. Buchwald JS. Comparison of plasticity in sensory and cognitive processing systems. Clin Perinatol. 1990;17(1):57-66.
19. Ventura LM, Costa Filho AO, Alvarenga KF. Maturação do sistema auditivo central em crianças ouvintes normais. Pro Fono. 2009;21(2):101-7. http://dx.doi.org/10.1590/S0104-56872009000200003
20. Swink S, Stuart A. Auditory long latency responses to tonal and speech stimuli. J Speech Lang Hear Res. 2012;55(2):447-59. http:// dx.doi.org/10.1044/1092-4388(2011/10-0364)
21. Wunderlich JL, Cone-Wesson BK. Maturation of CAEP in infants and children: a review. Hear Res. 2006;2012(1-2):212-23. http:// dx.doi.org/10.1016/j.heares.2005.11.008
22. Alvarenga KF, Vicente LC, Lopes RCF, Silva RA, Banhara MR, Lopes AC, Jacob-Corteletti LCB. Influência dos contrastes de fala nos potenciais evocados auditivos corticais. Braz J Otorhinolaryngol.
2013;79(3)336-41.
24. Almeqbel A. Speech-evoked cortical auditory response in children with normal hearing. S Afr J Commun Disord. 2013;60(1):38-43. http://dx.doi.org/10.7196/sajcd.132