BAR, Rio de Janeiro, v. 11, n. 4, art. 3, pp. 407-440, Oct./Dec. 2014
http://dx.doi.org/10.1590/1807-7692bar2014130012
Intangible Assets and Superior and Sustained Performance of
Innovative Brazilian Firms
Márcia Martins Mendes De Luca E-mail address: [email protected] Universidade Federal do Ceará – FEAAC/UFC Av. da Universidade, 2431, 60020-180, Fortaleza, CE, Brazil.
Anna Beatriz Grangeiro Ribeiro Maia E-mail address: [email protected] Universidade Federal do Ceará – UFC Av. da Universidade, 2431, 60020-180, Fortaleza, CE, Brazil.
Vanessa Ingrid da Costa Cardoso E-mail address: [email protected] Universidade Federal do Ceará –UFC Av. da Universidade, 2431, 60020-180, Fortaleza, CE, Brazil.
Alessandra Carvalho de Vasconcelos E-mail address: [email protected] Universidade Federal do Ceará –UFC Av. da Universidade, 2431, 60020-180, Fortaleza, CE, Brazil.
Jacqueline Veneroso Alves da Cunha E-mail address: [email protected] Universidade Federal de Minas Gerais – FACE/UFMG Av. Antônio Carlos, 6627, Pampulha, 31270-901, Belo Horizonte, MG, Brazil.
Abstract
According to the Resource-Based View, the nature of the resources, competences and knowledge accumulated by firms are the major causes of variation in business performance. In view of the importance attributed to intangible assets, the purpose of the present study was to investigate whether innovative firms with superior and sustained performance and firms without superior and sustained performance differ with regard to investments in intangible assets. The sample consisted of 137 firms listed on the Brazilian stock exchange from 2007 to 2010 and belonging to innovative sectors according to the Brazilian Innovation Index. Only 51 firms with profitability above the sector average during the entire study period (four years) met the criterion of superior and sustained performance. Thus, using return on assets as a proxy for performance, investments in intangibles were found to be greater in firms without superior and sustained performance, particularly with regard to the categories intellectual property assets (the predominant category) and infrastructure assets. Based on the lack of evidence for a significant correlation between corporate performance and investment in intangible assets, our initial hypothesis that a positive relation exists between the composition of investments in intangible assets and the performance of innovative firms could not be confirmed.
Introduction
Scholars have long discussed the characteristics and peculiarities of firms which display superior and sustained performance. Many theories have been put forth to identify the determining factors and basic characteristics required to measure and improve business performance. One such theory is the Resource-Based View (RBV), according to which the nature of a firm’s resources and accumulated competences are the main cause of variation in performance. To Barney (1991), tangible and intangible resources, combined with competences and controlled by the firm, make it possible to create and implement efficient strategies capable of producing organizational improvements in the long run. Thus, differences in performance between organizations derive from the heterogeneity of their resources (Peteraf, 1993). Scholars such as Wernerfelt (1984), Barney (1991), Peteraf (1993), Teece, Pisano and Shuen (1997) and Penrose (2006) defend the adoption of RBV tenets to maintain long-term sustainable competitive advantage.
Seen from this perspective, resources and competences are distributed heterogeneously among
the firms of a given sector as a result of differences in each firm’s history and background. Each firm’s
uniqueness makes it difficult to replicate its resources by acquisition or substitution, creating a potential for competitive advantage (Barney, 1991) and, consequently, superior and sustained performance, at least until its competitors obtain a comparable array of resources (Brito & Vasconcelos, 2004; Carvalho, Kayo, & Martín, 2010).
Intangible assets are resources and competences which may be combined to boost corporate performance. Iudícibus, Martins, Gelbcke, and Santos (2013) point out that while tangible assets are visually identifiable and segregated items in accounting, intangible assets may not be so. Brazilian legislation (Lei n. 11.638, 2007) considers intangible assets incorporeal property destined and used for the maintenance of the firm. In 2008, during the convergence on international accounting standards, the Brazilian Accounting Pronouncements Committee published Technical Statement #4 (Comitê de Pronunciamentos Contábeis [CPC], 2008), subsequently modified by CPC #4/R1/2010 (CPC, 2010), defining intangible assets as identifiable non-monetary assets without physical substance. It should be pointed out that the adoption of international accounting standards in Brazil, starting in 2007, is reflected in the peculiar way in which intangible assets are incorporated in the structure of the balance sheet, where they are given the status of noncurrent assets, and in the way their fair value is determined, which in turn influences the way the indicators of an organization’s assets are calculated.
Hoog (2008) sees intangible assets as property without physical substance, the useful life of which tends to be subjective, varying according to the rights resulting from ownership and the associated competitive advantages and profits, which may be acquired or developed internally.
To Edvinsson and Malone (1998), Stewart (1999) and Santos and Schmidt (2002), intangible assets are synonymous with intellectual capital or knowledge assets. They add value to the organization and are part of its base of knowledge and information. Thus, for the purpose of this study, the expressions knowledge management, knowledge assets, intangible assets, intangible capital, intangible resources, intellectual capital, goodwill, occult capital, invisible assets and intellectual property refer to the same type of asset, as shown by similarities between the definitions proposed by different authors (Antunes, 2006; Brooking, 1996; Carvalho & Ensslin, 2006; Edvinsson & Malone, 1998; Kaufmann & Schneider, 2004; Lev, 2001; Petty & Guthrie, 2000; Rezende, 2001; Stewart, 1999; Sveiby, 1997).
With regard to the strategic role of intellectual capital and knowledge management, Rezende
(2001, p. 17) stated that “knowledge management is the process of creating value through the use of the
organization’s intangible assets; it is the transformation of information into knowledge, and of
knowledge into business”. This is the definition adopted in our study.
combination of intangible assets consequently improves business performance and competitive advantage. Thus, Kaplan and Norton (1996), Nonaka and Takeuchi (1997), Sveiby (1997), Stewart (1999) and Lev (2001), among others, believe intangible assets are the main factor responsible for the creation of competitive advantage (or disadvantage) in an organization. In other words, a considerable part of the variation in corporate wealth is attributed to intangible assets and their use.
However, results from studies on intangible assets have not always been consistent. Thus, while Villalonga (2004) and Perez and Famá (2006) concluded intangible assets significantly contributed to the superior and sustained performance of US firms, Carvalho, Kayo and Martín (2010) reported opposite effects on Brazilian firms, concluding investments in intangible assets were actually negatively associated with business performance. However, the result of the study may have been influenced by the setting in which it was conducted: the sample consisted of firms from several sectors listed on the Brazilian stock exchange (BM&FBovespa).
Peteraf (1993) defines competitive advantage as sustained, above-normal returns. To Barney and Hesterly (2007), a firm achieves competitive advantage when it creates more economic value than the competitors in its sector or product market. Silva (2009) described a line of research focused on sustained extraordinary profits based on earlier studies by Brozen (1971) and Mueller (1977), who empirically evaluated firms with persistently better results than those of their competitors, that is, with better performance over an extended period of time, and concluded that the abnormal returns observed at a given moment in time were due to some extraordinary factor impacting all firms simultaneously.
According to McGahan and Porter (2002), the persistence of abnormal returns is related to sector and company characteristics, since convergences on abnormal returns are sector and company-specific. The authors also demonstrated that business-specific effects represented by competitive position and other factors influence corporate performance.
These same issues were addressed by Bou and Satorra (2007) in a study of Spanish firms. The authors found that abnormal returns occur when, at a given moment, profit rates vary greatly between firms and sectors and are identified most prominently in organizations whose performance is well above average.
In view of this, despite difficulties in classifying Brazilian innovative firms (Oyadomari, Cardoso,
Silva, & Perez, 2010), the sample of the present study consisted of potentially innovative firms included in the Brazilian Innovation Index (Índice Brasil de Inovação [IBI]). The index was developed by the State University of Campinas (Universidade Estadual de Campinas [UNICAMP]), the UNIEMP Institute and the São Paulo State Foundation for Research Aid (Fundação de Amparo à Pesquisa do Estado de São Paulo [FAPESP]), based on results from studies indicating an association between intangible assets and innovative capacity. According to the third edition of the Oslo Manual (which contains guidelines for the collection and interpretation of information on innovation, published in 2005 by the Organization for Economic Co-Operation and Development [OECD]), innovation requires considerable investments, including the acquisition of intangible assets with potential long-term return. In addition, in a study published by the Institute of Applied Economics (Instituto de Pesquisa Econômica Aplicada, a public foundation affiliated with the Department of Strategic Affairs of the Brazilian presidency), Tironi and Cruz (2008) highlighted the importance of intangible assets for corporate innovation in the era of knowledge economics and stated that higher levels of innovation require a greater predominance of intangible assets in the innovation process.
Hypothesis: A positive relation exists between the composition of investments in intangible
assets and the performance of innovative firms.
We adopted the classification proposed by Brooking (1996) which segregates intangible assets into market assets, human-centered assets, intellectual property assets and infrastructure assets. Over the past decade, this classification has been employed by a number of researchers (Bollen, Vergauwen, & Schnieders, 2005; Kot, 2009; Marr, Schiuma, & Neely, 2004) and in a wide range of empirical settings (Antunes, 2005; Antunes & Leite, 2008; Santos, Silva, Gallon, & De Luca, 2011). Furthermore, in view of the study objectives and the importance of collecting corporate data as objective and representative of reality as possible, we used the information on investments in intangible assets provided in the
accounting statements of the sampled firms under the heading intangible assets, in accordance with
international accounting regulations recently adopted in Brazil(CPC, 2010).
The study is intended to subsidize the current discussion on intangible assets in specific business contexts (sector and region) by evaluating Brazilian firms in innovative sectors (according to the IBI), characterized as intangible asset-intensive (Kayo, 2002). The approach is itself innovative in that firms with and without superior and sustained performance are compared with regard to investments in intangible assets segregated by category (Brooking, 1996).
Review of the Literature
In this section, we outline the main aspects of superior and sustained business performance, the relation between performance and intangible assets, and the theoretical framework adopted in the study.
Superior and sustained performance and RBV
In today’s globalized market, all firms are compelled to outperform their competitors. However,
for some firms, positive results per se are not enough, especially if they do not reflect perpetual growth.
Firms and sectors are not homogeneous but are subject to many types of variation which can interfere directly with performance (Brito & Vasconcelos, 2004). Researchers of different schools have studied the question of heterogeneity in business performance, but the criteria with which to measure performance remains a matter of controversy (Carvalho et al., 2010). The notion that firms are essentially heterogeneous with regard to resources and internal capacities has guided much of the research in this field (Peteraf, 1993).
Carneiro, Silva, Rocha and Dib (2007) observed that research on the determining factors of business performance has yielded conflicting or inconsistent results, possibly due to poor construct conceptualization, operationalization and measurement of business performance.
According to Neely, Gregory and Platts (1995), the evaluation of performance may literally be defined as the process of quantifying action, where measurement is the process of quantification and action leads to performance. This is the definition adopted in the present study. On the other hand, as Mintzberg (1973) pointed out, while measuring may be a process of quantification, it also stimulates action. It is only through consistency of action and decision that organizational strategies are realized.
Kimura and Suen (2003, p. 4) believe it is useful to evaluate organizational performance;
however, “the complexity of the interactions between the variables that determine business performance
calls for the development of special management tools for decision making”. Methodical and automated
analyses can help prevent rash decisions and conflicting strategies.
In order to systematically monitor how resources are allocated and converted in operational action
In fact, the measuring of performance may be seen as fundamental to the long-term maintenance and survival of the firm in the context of global business competition.
Measures of business performance should be expressed with a metrics which can be interpreted and used by stakeholders. Despite recognizing the procedure is complex and may involve different types
of measures, El-Shishini (2001) and Omaki (2005) pointed out that “researches highlighted that financial
measures are the most commonly used parameters” (El-Shishini, 2001, and Omaki, 2005, as cited in Carvalho et al., 2010, p. 874) as they are generally believed to be the most reasonable estimates of organizational performance. However, not all scholars agree with this view.
The Resource-Based View (RBV) is based on the recognition of individual and unique resources
in each firm and on the ability of such factors to explain variation in business performance (Carvalho et
al., 2010). The main cause of variation in organizational performance is related to the specific nature of
the firm’s resources and accumulated competences. RBV strategies are based on the notion that
competitive advantage is derived from the organization’s ability to adequately combine and exploit tangible and intangible resources (Wernerfelt, 1984). Thus, firms with superior organizational structure and management systems may obtain extraordinary profits by exploiting resources of which there is a scarcity on the market (Oening, 2010).
Several analyses and models of sustained superior performance and related factors have been published. In a seminal study on the principles of RBV, Penrose (1959) showed that corporate growth is determined by managerial competence, acquired experience and learning capacity while using internal and external resources. On the other hand, Schmalensee (1985) looked into the influence of the economic sector and market share on fluctuations in corporate profits based on data from a single fiscal year. Considering a somewhat longer period (4 years), Rumelt (1991) emphasized breaking down the components of the observed variance in corporate return rates.
Kor and Mahoney (2004) discussed a number of studies dealing with different aspects of
corporate growth and performance, highlighting Penrose’s study (1959) which contributed significantly
to the development of RBV by providing a fundamental logical framework for understanding the causal relations between resources, capacities and competitive advantage. According to the authors (Kor & Mahoney, 2004), Penrose (1959) considered three explanatory factors regarding the relation between corporate resources, productive opportunities and growth: (a) efficient and innovative resource management, (b) causal relations between resources and the generation of productive opportunities for expansion and innovation, and (c) availability of managerial talent and techniques, the lack of which is
sometimes the primary bottleneck to a firm’s growth.
For the purpose of this study, superior and sustained performance was defined as long-term financial performance (Rumelt, 1991) above the average in a given sector (Schmalensee, 1985). The factors determining such performance are seen in light of RBV. In a study on RBV, Grant (1991) stressed that, by focusing on unique resources and competences, organizations can build a solid foundation on which to strengthen their identity, develop long-term strategies and define their primary source of income. Many of these resources and competences would take the form of intangible assets, as indicated by Penrose (1959).
Intangible assets and superior performance
Table 1
Different Views of Intangible Assets
Authors Approach to intangible assets
Kohler (1957) A capital asset without physical substance, the value of which is defined by rights and claims to expected benefits.
Brooking (1996) Synonymous with intellectual capital, the result of changes in IT, media and communications, providing intangible benefits and enabling firms to function. Edvinsson and Malone
(1998) The notion of intangible assets arose in response to the growing awareness of the role of non-accounting factors in actual company value. Hendriksen and Van
Breda (1999) Intangible assets are among the most complex issues in accounting because uncertainties about how to define them and measure their value and useful life. Lev (2001) Rights and claims to expected benefits without physical or financial substance
originating from discoveries, organizational practices and human resources. Hillman and Keim (2001) Intangible assets strengthen relations with the community through
socio-environmental actions, reflected in financial benefits to stockholders. Kayo (2002) A structured set of knowledge, practices and attitudes interacting with the
organization’s tangible assets to compound company value. Schmidt and Santos
(2002) Incorporeal resources controlled by the firm from which potential future benefits may be derived. Teixeira and Popadiuk
(2003) Intangible assets help boost corporate performance to the extent they are valuable, unique and difficult to imitate. Perez and Famá (2006) Permanent assets without physical substance, at the disposal of and controlled by
the firm, a source of potential future benefits.
Lei n. 11.638 (2007) Rights and claims to incorporeal property destined and used for the maintenance of the firm, including acquired goodwill.
Hoog (2008) Incorporeal property with a frequently subjective useful economic life varying according to the rights resulting from ownership and the associated competitive advantages and profits, which may be acquired or developed internally. International Accounting
Standards38 (n.d.), CPC (2010)
Non-monetary assets without physical substance also referred to as goodwill.
Surroca, Tribó and Waddock (2010)
Intangible assets consolidate the means of creating financial earnings.
Machado and Famá
(2011) Permanent non-physical assets which, together with tangible assets, are capable of producing future benefits. Lima and Carmona (2011) Intangible assets correspond to the difference between total value (defined by the
market) and book value as stated in the balance sheet. Teixeira, Petri and
Marques (2012) Nowadays, intangible assets comprise the values previously classified as incorporeal fixed assets. Iudícibus et al. (2013) Aggregated assets of future economic benefits to be controlled and exploited
exclusively by a given organization. Note. Source: Composed by the authors, based on a review of the literature.
goodwill, authors’ rights, secret processes, licenses, developed software, data bases, public concessions, rights to exploitation or operation, portfolios of captive customers, etc. (Perez & Famá, 2006).
To Lev (2001), intangible assets have three main attributes: network externality, non-rivalry and unlimited scalability. Network externality is the influence of the initial consumption of an individual user on the total demand for a product or service. The term non-rivalry is applied to assets when its use by one person or organization does not prevent its simultaneous use by others. Unlimited scalability refers to the return on an intangible asset by increasing scale (Carvalho et al., 2010).
Many authors, such as Flamholtz (1985), Chauvin and Hirschey (1993), Megna and Klock (1993), Nonaka and Takeuchi (1997), Sveiby (1997), Kaplan and Norton (1996), Edvinsson and Malone (1998), Stewart (1999), Lev (2001), Kayo, Teh and Basso (2004), Villalonga (2004), Connolly and Hirschey (2005), Perez and Famá (2006), Ensslin and Carvalho (2007), Gallon, Lyrio and Ensslin (2008),
Crisóstomo (2009), Kayo, Patrocínio and Martin (2009) and Surroca et al. (2010) have demonstrated
the influence of intangible or intellectual assets on the creation of wealth and pointed out the positive relations between investment in innovation-related resources and corporate market value. Other studies focus on the representativeness of intangible assets in corporate structure, especially Colauto,
Nascimento, Avelino and Bispo (2009), Carvalho et al. (2010), Ritta and Ensslin (2010), Santos, Silva,
Gallon and De Luca (2012), Nascimento, Oliveira, Marques and Cunha (2012), Santos, Vasconcelos and De Luca (2013) and Vasconcelos, Santos, De Luca and Cunha (2013).
Three studies on the relation between intangible assets and superior and sustained performance are of particular relevance: Villalonga (2004) compared the return on assets (ROA) of each firm in a sample of US firms to the respective sector average and found intangible assets to have a significant influence on superior performance, thereby concluding intangibility was responsible for sustained performance. Likewise, Perez and Famá (2006) observed that in US firms tangible assets were only responsible for regular earnings, while new value was added by intangible assets. Conversely, in a sample of Brazilian firms, Carvalho et al. (2010) found a negative correlation between intangible resources and superior and sustained performance, thereby rejecting the initial hypothesis of their study.
Other international studies worthy of mention have contributed to consolidating the tenets of RBV. In a study on the RBV model from the early 1990s, Grant (1991) concluded that corporate resources and capacities are essential to the building of strategies capable of increasing return rates. The author believes the essence of RBV is in the perception of the relations between resources, capacities, competitive advantage and profitability in each firm. This perception is crucial to achieving competitive advantage in the long term.
In a recent study, Petkov (2011) explored conceptual issues related to the identification of intangible assets generated internally and recognized in financial statements, highlighting the need for periodical analysis of such assets for corporate sustainability. In their study on IT-related assets, Ray, Xue and Barney (2013) observed that IT capital has an effect on corporate performance to the extent that these assets expand the firm’s possibilities of vertical integration and product market diversification. In addition, Ulrich and Smallwood (2005) looked at intangible assets from the perspective of human resources and found this aspect to be crucial to the creation of company value. By implementing human resources actions, a firm can create sustainable intangible values, which in turn help capitalize it on the market.
In the present study, we assumed that intangible innovation assets have a significant influence on the maintenance of superior and sustained business performance. Lee and Chen (2009) observed that, for example, investments in R&D can affect company value and were in fact associated with expectations of a significant increase and creation of value. However, according to Carvalho et al.
(2010), the potential of intangible assets to create wealth for the organization depends on their specific attributes.
Recently published studies suggest that the relation between innovation and the creation of value
(and in its wake a number of OECD-sponsored publications) and the publication in 1990 of the Oslo Manual, the notion of innovation has been informed and standardized by concepts, methodologies and the development of statistics and indicators for research on R&D in industrialized countries (OECD, 2005). The Oslo Manual (OECD, 2005) defines innovation as the implementation/commercialization of a product, process, marketing method or business practice with improved performance characteristics affecting the organization of the firm and its external relations.
For the purpose of this study, we composed a sample of Brazilian public firms from the BM&FBovespa stock exchange included in the sectors identified by the IBI as the most innovative. We adopted the classification of intangible assets proposed by Brooking (1996, p. 136) which features a specific category related to innovation, namely “intellectual property assets”.
Due to the difficulty in classifying innovative Brazilian firms (Oyadomari et al., 2010), we adopted the levels of innovativeness used in the 2007 edition of the IBI (developed by
UNICAMP/UNIEMP/FAPESP) to compose Table 9. To Basso and Kimura (2010, p. 97), “the IBI sector
classification is validated by the existence of an expressive difference in innovation effort and results between the sectors, in support of the RBV concept that individual firms are unique within their respective sector”. The IBI was adopted specifically to select sectors of relevance to our study on innovative Brazilian firms because it is a well-established market indicator. As pointed out by Camargo (2008), the IBI is a tool with which firms can compare their innovative performance to that of their competitors. Since its introduction, the IBI has been used by a number of Brazilian researchers (Basso
& Kimura, 2010; Inácio & Quadros, 2008; Lopes & Barbosa, 2010; Oyadomari et al., 2010; Ramos,
2008).
Upon the initiative of Revista Inovação (a journal published by the Uniemp Institute), the IBI project was developed in 2005 by researchers of the UNICAMP Department of S&T Policies (Departamento de Política Científica e Tecnológica/Instituto de Geociências [DPCT/IG]), with the support of FAPESP. Designed to measure capacity for innovation, the IBI was used to establish a ranking of innovative Brazilian firms (Furtado, Quadros, Domingues, Camillo, Inácio, & Righetti, 2007).
The IBI methodology derives from well-established data collection methodologies and systems, and provides a comprehensive approach to corporate innovativeness. The main set of data used in the IBI model are retrieved from the database of Research in Technological Innovation (Pesquisa de Inovação [PINTEC]), an initiative of the Brazilian Institute of Geography and Statistics (Instituto Brasileiro de Geografia e Estatística [IBGE]) with support from the Studies and Projects Financing Agency (Financiadora de Estudos e Projetos [FINEP]), which was instrumental in showing the relevance of gathering statistical information on firms (Furtado, Quadros, Righetti, Inácio, Domingues, & Camillo, 2007). PINTEC uses the methodology of the Oslo Manual (OECD, 2005) for research on innovation and quantifies R&D in a way consistent with the Frascati Manual. To evaluate innovation capacity in the form of patents, the IBI retrieves publicly available data from the National Institute of Industrial Property (Instituto Nacional da Propriedade Industrial [INPI]) (Furtado, Quadro, Domingues et al., 2007).
Due to its importance at the national level, Ramos (2008) compares the IBI (Furtado & Quadros, 2006; Quadros & Furtado, 2007) to well-established international indices, such as the UN-sponsored
Technology Achievement Index(TAI) (United Nations Development Programme [UNDP], 2001), the
OECD-sponsored Composite of Innovation Performance (Freundenberg, 2003) and the Japanese Overall Science and Technology Index (National Institute of Science and Technology Policy [NISTEP], 1995).
Methodology
In order to give a detailed description of intangibility and superior and sustained business performance in a sample of Brazilian public firms and define relations between study variables, the collected information consisted of corporate financial data retrieved from the Economática® database and from explanatory notes in standard financial reports and statements posted on the website of the BM&FBovespa stock exchange.
The sample consisted of public firms traded on BM&FBovespa as of April 2010, classified by the IBI as innovative. According to Carvalho et al. (2010), studies on intangibility and superior and sustained performance yield more meaningful results when based on samples covering particularly innovative business sectors. Based on PINTEC data 2005 (IBGE, 2006), the IBI was highlighted in
studies by Furtado and Quadros (2006), Inácio and Quadros (2006), Furtado, Quadros, Righetti et al.
(2007), Furtado, Quadros and Domingues (2007), Quadros and Furtado (2007), Righetti and Pallone (2007), Camargo (2008) and Rocha (2009) and has been employed in several other studies, such as
Inácio and Quadros (2008), Ramos (2008), Lopes and Barbosa (2010), Oyadomari, Cardoso, Silva and
Perez(2010) and Basso and Kimura (2010).
Financial data and information on asset composition were available for 137 of a sample of 174 innovative Brazilian firms. Thus, the final sample included 137 firms, distributed according to the sector classification adopted by BM&FBovespa and IBI level of innovativeness: high-tech (Group 1), medium high-tech (Group 2), medium low-tech (Group 3) and low-tech (Group 4) (Table 2).
Table 2
Classification of the 137 Firms in the Sample According to Sector and IBI Level of Innovativeness
Sector Group 1:
high-tech
Group 2: medium high-tech
Group 3: medium
low-tech
Group 4: low-tech
Total
Capital goods and services 13 12 - - 25
Construction and transportation - - 3 - 3
Cyclical consumption - 4 20 3 27
Non-cyclical consumption - - 1 20 21
Basic materials - 10 6 18 34
Oil, gas and biofuels - 4 - - 4
IT 7 - - - 7
Telecommunications - 16 - - 16
Total 20 46 30 41 137
Note. Source: The authors.
Only firms with profitability (as expressed by ROA) above the sector average during the entire study period (considering the sector average of each of the four years covered by the study) met the criterion of superior and sustained performance. Thus, firms with one or more years of financial performance below the sector average were not considered to have superior and sustained performance. The choice of ROA in this study is justified by the extensive applicability of this indicator in studies on corporate performance (Almeida & Santos, 2008; Bomfim, Almeida, Gouveia, Macedo, & Marques, 2011; Bortoluzzi, Lyrio, & Ensslin, 2008; Carvalho et al., 2010; Roberts & Dowling, 2002). According
to Silva (2009), ROA reflects the efficiency of operations based on a firm’s assets in accounting. The
indicator may be interpreted as the maximum financial cost incurred by a firm in its external funding operations; in other words, if the rate obtained in external funding operations exceeds the ROA, the
shareholders’ return is reduced (Assaf, 2009). Thus, in detriment to other possible variables, ROA was
adopted as a measure of performance based on several studies discussed above. Furthermore, the choice of ROA is consistent with the study objective of evaluating the relation between superior and sustained performance and investments in intangible assets in the study period.
Initially, we collected financial data for each firm in the sample. Information on profitability was
retrieved from Economática®. Subsequently, content analysis (Richardson, 2007) was applied to
information on intangible asset composition extracted from the explanatory notes in each firm’s accounting statements. Values representing property items (intangible assets and total assets) were converted into USD at the exchange rate in effect upon the closing of the balance sheet of each year of exercise, while earnings were converted into USD at the average exchange rate of each period, as specified in International Accounting Standard 21 (2003). The variable representing the composition of investments in intangible assets was operationalized based on the amount indicated in the financial statements as invested in intangible assets each year of the study period. It should be added that our choice of measure of investment in intangible assets, as registered in corporate accounting statements and explanatory notes, was based on several Brazilian and international studies on intangibles in which
the measure was deemed appropriate and objective (Carvalho et al., 2010; Connolly & Hirschey, 2005;
Crisóstomo, 2009; Kayo, Patrocínio, & Martin, 2009; Megna & Klock, 1993; Perez & Famá, 2006; Villalonga, 2004).
Our analysis of the intangible asset composition was based on the classification proposed by
Brooking (1996, p. 136) which features a specific category related to innovation, namely “intellectual
property assets” (Table 3).
Table 3
Intangible Asset Composition, Based on Brooking (1996)
Classification Composition
Market assets Company potential derived from market-related intangible assets. Human-centered
assets Company potential derived from the expertise, creativity, knowledge and problem-solving skills of individuals, considered collectively and dynamically. Intellectual property
assets Assets that require legal protection in order to benefit organizations.
Infrastructure assets Technologies, methodologies and processes, such as organizational culture, information systems, management methods, risk acceptance, customer databases etc.
Note. Source: Adapted from Brooking, A. (1996). Intellectual capital: core asset for the third millennium enterprise.Boston: Thomson Publishing Inc.
Table 4
Indicators of Intangible Assets Classified According to Brooking (1996)
Classification Indicator
Market assets Goodwill, customer portfolios, program contracts (commitment), program contracts (investments made), cost of removing property and reforestation, negative goodwill, expenditure on acquisitions and equity, brands, allowance for losses.
Human-centered assets Acquisition of payroll.
Intellectual property assets Concessions, exclusive agreements, acquired software, software licenses, other acquired rights, product research and development, technology, patents, completed projects.
Infrastructure assets Expenditure on shopfitting, expenditure on ongoing projects, setup of facilities on third-party premises, sales outlets, system implementation projects, distance-learning projects, administrative services, information systems, software, preoperational expenses.
Other intangibles Other. Note. Source: The authors.
The classification human-centered assets has only one indicator, while market assets,
intellectual property assets and infrastructure assets have 10, 9 and 10 indicators, respectively.
Indicators not classifiable elsewhere in the framework are listed under the heading other intangibles.
The statistical techniques adopted were consistent with the study objectives and included calculating mean values and correlation coefficients and performing regression analyses in order to test for differences between innovative firms with superior and sustained performance and firms without superior and sustained performance with regard to investments in intangible assets, and to verify the existence of a relation between investments in intangible assets and corporate performance during a period of four years. Intangible assets were expressed in relative measures in the statistical analysis due to the inclusion of firms of varying size in the sample. Thus, the value of the intangible assets was divided by total company assets, and outliers were removed from the sample.
The normality of the data was initially verified with the Kolmogorov-Smirnov test. Subsequently, the data were analyzed with the Mann-Whitney test in order to compare firms with and without superior and sustained performance with regard to the composition of intangible assets throughout the 4-year
study period. According to Fávero, Belfiore, Silva and Chan (2009, p. 163), Mann-Whitney is used “to
test whether two samples of independent observations represent populations with equal mean values”.
The test detects differences or similarities between the mean values of the two samples (in this case, firms with and without superior and sustained performance).
To test the hypothesis, the level of statistical significance was set at 5% (p<0.05). The finding of significant differences (p<0.05) between firms with and without superior and sustained performance with regard to mean values of intangible assets implies the rejection of the null hypothesis.
Due to the non-normal distribution of the sample, a non-parametric test (Spearman’s correlation
coefficient) was used in the correlation analysis.
control variables represented by size, sector and classification of innovation according to the IBI) (Cunha & Coelho, 2007).
Thus, in order to present more consistent results for the relation between intangible assets and corporate performance, we developed three regression models represented by the following equations:
ROAi = β0 + β1SIZEi + β2D1_INOVi + β3D2_INOVi + β4D3_INOVi + β5D4_INOVi +
β6D1_INDi + β7D2_INDi + β8D3_INDi + β9D4_INDi + β10D5_INDi + β11D6_INDi +
β12D7_INDi + β13D8_INDi + �
(1)
ROAi = β0 + β1MARKi + β2INTi + β3D2_INFRAi + β4D3_OTHi + β5SIZEi +
β6D1_INOVi + β7D2_INOVi + β8D3_INOVi + β9D4_INOVi + β10D1_INDi + β11D2_INDi +
β12D3_INDi + β13D4_INDi + β14D5_INDi + β15D6_INDi + β16D7_INDi + β17D8_INDi + �
(2)
ROAi = β0 + β1TOTALINTi + β2SIZEi + β3D1_INOVi + β4D2_INOVi + β5D3_INOVi
+ β6D4_INOVi + β7D1_INDi + β8D2_INDi + β9D3_INDi + β10D4_INDi + β11D5_INDi +
β12D6_INDi + β13D7_INDi + β14D8_INDi + �
(3)
Table 5 shows the variables used in the present study.
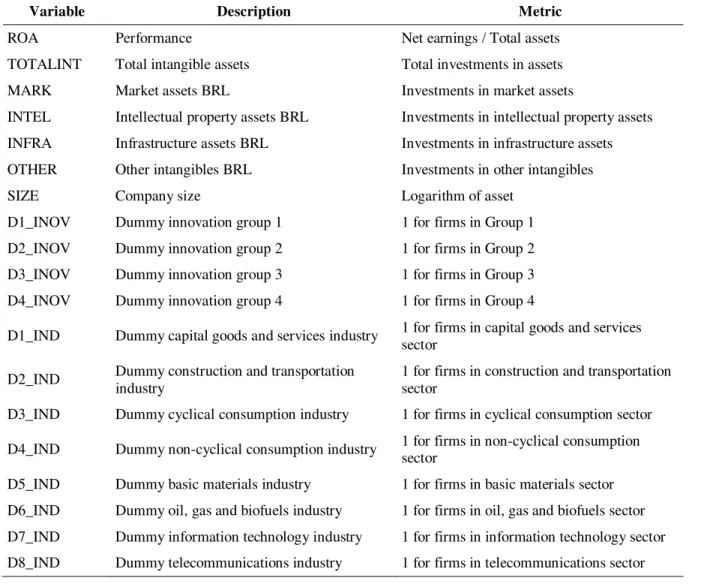
Table 5
Variables
Variable Description Metric
ROA Performance Net earnings / Total assets
TOTALINT Total intangible assets Total investments in assets
MARK Market assets BRL Investments in market assets
INTEL Intellectual property assets BRL Investments in intellectual property assets INFRA Infrastructure assets BRL Investments in infrastructure assets OTHER Other intangibles BRL Investments in other intangibles
SIZE Company size Logarithm of asset
D1_INOV Dummy innovation group 1 1 for firms in Group 1 D2_INOV Dummy innovation group 2 1 for firms in Group 2 D3_INOV Dummy innovation group 3 1 for firms in Group 3 D4_INOV Dummy innovation group 4 1 for firms in Group 4
D1_IND Dummy capital goods and services industry 1 for firms in capital goods and services sector
D2_IND Dummy construction and transportation industry 1 for firms in construction and transportation sector
D3_IND Dummy cyclical consumption industry 1 for firms in cyclical consumption sector
D4_IND Dummy non-cyclical consumption industry 1 for firms in non-cyclical consumption sector
Data analysis was performed with the software SPSS® (Statistical Package for the Social
Sciences) andStata. The results of the test of normality (Kolmogorov-Smirnov), comparison of means
(Mann-Whitney), correlation (Spearman) and multiple linear regression analysis are presented and analyzed below.
Presentation and Analysis of Results
Initially, it should be pointed out that intangible assets were only taken into account when monetary values were assigned to them in the sampled accounting statements. Once a monetary value
had been identified in a company’s explanatory notes, information was collected regarding the
composition and definition of each asset (Table 3) and the indicators of intangible assets classified according to Brooking (1996) (Table 4).
To help understand the content analysis of the explanatory notes performed in view of the study objectives, the indicators of the intangible assets in each category identified in the explanatory notes (Brooking, 1996; Table 4) are listed in Table 6 along with examples of the terminology employed by the sampled firms in their disclosure of intangible assets in explanatory notes of accounting statements covering the period 2007-2010.
Table 6
Indicators of Intangible Assets (Brooking, 1996) and Examples of the Terminology Employed by the Sampled Firms in Their Disclosure of Intangible Assets in Explanatory Notes (EN) of Accounting Statements Covering the Period 2007-2010
Category Indicators of intangible assets, according to Brooking (1996), identified in EN
Terminology employed by the sampled firms in their disclosure of intangible assets in EN
Market assets Goodwill resulting from expected future profitability
Ágio na Aquisição de Companhias - EN from 2007, Totvs S.A. (note 10, p. 17);
Ágio em Controladas - EN from 2008, São Paulo Alpargatas S.A. (note 10, p. 6);
Ágios na Incorporação/Aquisição - EN from 2008, Unipar Carbocloro S.A. (note 14, p. 22);
Ágio na Aquisição de Controladas - EN from 2009, MMX Mineração e Metálicos S.A. (note 17, p. 26); NE from 2009, Weg S.A. (note 13, p. 10);
Ágio de Aquisição - EN from 2009, Telefônica Brasil S.A. (note 13, p. 19);
Ágio na Aquisição de Empresas - EN from 2009, Springs Global Participações S.A. (note 10, p. 15);
Ágio na Aquisição de Participação - EN from 2010, Iochpe-Maxion S.A. (note 12, p. 67);
Ágio Fundamentado em Rentabilidade Futura - EN from 2010, Braskem S.A. (note 15, p. 75);
Ágio Pago em Aquisições - EN from 2010, Usinas Sid. de Minas Gerais S.A./Usiminas (note 19, p. 107);
Ágio - EN from 2010, Forjas Taurus S.A. (note 16, p. 38); EN from 2010, Tim Participações S.A. (note 17, p. 47)
Table 6 (continued)
Category Indicators of intangible assets, according to Brooking (1996), identified in EN
Terminology employed by the sampled firms in their disclosure of intangible assets in EN
Market assets Customer portfolios Carteira de Clientes - EN from 2008, São Paulo Alpargatas S.A. (note 10, p. 6); EN from 2009, Totvs S.A. (note 13, p. 30); EN from 2010, Telemar Participações S.A. (note 18, p. 91);
Carteira de Clientes (Rede IP) - EN from 2009, Telefônica Brasil S.A. (note 13, p. 19)
Program contracts
(Commitment and investment made)
Contratos com Clientes e Fornecedores - EN from 2010, Braskem S.A. (note 15, p. 75);
Subsídios na Venda de Aparelhos e Mini Modens - EN from 2010, Tim Participações S.A. (note 17, p. 47)
Cost of removing property and
reforestation Custo para Retirada de Ativos e Reflorestamento2009, MMX Mineração e Metálicos S.A. (note 17, p. 26) - EN from Goodwill resulting from
operations Fundo de Comércio(note 22, p. 57) - EN from 2010, Portobello S.A. 2010 Expenditure on acquisitions and
equity
Intangíveis Adquiridos na Combinação de Negócios - EN from 2010, Fibria Celulose S.A. (note 19, p. 75)
Brands Marcas - EN from 2007, Bematech Ind.a e Com. de Equipamentos Eletrônicos S.A. (note 15, p. 16); EN from 2007, Totvs S.A. (note 10, p. 17); EN from 2008, São Paulo Alpargatas S.A. (note 10, p. 6); EN from 2009, Randon S.A. Implementos e Participações (note 12, p. 16); EN from 2009, Springs Global Participações S.A. (note 10, p. 15); EN from 2010, Braskem S.A. (note 15, p. 75); EN from 2010, Portobello S.A. 2010 (note 22, p. 57)
Human-centered assets
- -
Intellectual property assets
Concessions Cessão de Direitos Comerciais - EN from 2010, São Paulo Alpargatas S.A. (note 16, p. 58);
Concessão - EN from 2010, Telemar Participações S.A. (note 18, p. 91);
Licenças de Concessão - EN from 2010, Tim Participações S.A. (note 17, p. 47)
Exclusive agreements Direitos Minerários - EN from 2009, MMX Mineração e Metálicos S.A. (note 17, p. 26); EN from 2010, Usinas Sid. de Minas Gerais S.A. – Usiminas (note 19, p. 107);
Direito de Exploração de Jazidas - EN from 2010, Portobello S.A. 2010 (note 22, p. 57)
Acquired software and software licenses
Direito de Uso - EN from 2007, Bematech Ind. e Com. de Equipamentos Eletrônicos S.A. (note 15, p. 16);
Licença de Software - EN from 2009, Weg S.A. (note 13, p. 10); Direitos de Uso de Software - EN from 2008, Unipar Carbocloro S.A. (note 14, p. 22); EN from 2010, Tim Participações S.A. (note 17, p. 47);
Software Direitos de Uso - EN from 2010, Braskem S.A. (note 15, p. 75)
Table 6 (continued)
Category Indicators of intangible assets, according to Brooking (1996), identified in EN
Terminology employed by the sampled firms in their disclosure of intangible assets in EN
Intellectual property assets
Other acquired rights Direito de Exploração de Área - EN from 2007, Totvs S.A. (note 10, p. 17);
Direitos de Uso - Adutora de Água - EN from 2008, Unipar Carbocloro S.A. (note 14, p. 22);
Direitos de Exploração de Áreas e Direitos Autorais de Produtos Desenvolvidos por Terceiros - EN from 2009, Totvs S.A. (note 13, p. 30);
Franquias– EN from 2009, Totvs S.A. (note 13, p. 30); Direitos de Uso de Subestação de Energia - EN from 2009, Randon S.A. Implementos e Participações (note 12, p. 16); Direito de Uso de Telefone - EN from 2010, Kepler Weber S.A. (note 19, p. 54);
Licenças de Uso - EN from 2010, Positivo Informática S.A. (note 14, p. 40)
Product research and
development Desenvolvimento de Produtos(note 10, p. 17); EN from 2009, Totvs S.A. (note 13, p. 30); EN - EN from 2007, Totvs S.A. from 2010, Kepler Weber S.A. (note 19, p. 54);
Pesquisa e Desenvolvimento - EN from 2010, Embraer S.A. (note 18, p. 45);
Pesquisa e Desenvolvimento de Novos Produtos - EN from 2010 do Itautec S.A. (note 15, p. 44)
Technology Tecnologia - EN from 2008, Unipar Carbocloro S.A. (note 14, p. 22);
Licenças Regulatórias - EN from 2010, Telemar Participações S.A. (note 18, p. 91)
Patents Patentes - EN from 2007, Totvs S.A. (note 10, p. 17); EN from 2008, Unipar Carbocloro S.A. (note 14, p. 22); EN from 2009, Randon S.A. Implementos e Participações (note 12, p. 16); EN from 2010, DHB Indústria e Comércio S.A. (note 15, p. 4); EN from 2010, Kepler Weber S.A. (note 19, p. 54); Direitos e Patentes - EN from 2008, São Paulo Alpargatas S.A. (note 10, p. 6)
Completed projects Projetos Concluídos - EN from 2010, DHB Indústria e Comércio S.A. (note 15, p. 4)
Infrastructure
assets Expenditure on ongoing projects Projetos em AndamentoAlpargatas S.A. (note 16, p. 58); - EN from 2010, São Paulo Custos de Desenvolvimento - EN from 2010, Forjas Taurus S.A. (note 16, p. 38);
Projetos de Desenvolvimento - EN from 2010, Positivo Informática S.A. (note 14, p. 40)
Table 6 (continued)
Category Indicators of intangible assets, according to Brooking (1996), identified in EN
Terminology employed by the sampled firms in their disclosure of intangible assets in EN
Infrastructure
assets Setup of facilities on third-party premises Solo Capitalizado(note 14, p. 22); - EN from 2008, Unipar Carbocloro S.A. Direitos de Uso do Termo - EN from 2010, Iochpe-Maxion S.A. (note 12, p. 67)
Sales outlets Pontos Comerciais (Luvas) - EN from 2009, Springs Global Participações S.A. (note 10, p. 15);
Bens e Instalações em Andamento - EN from 2010, Tim Participações S.A. (note 17, p. 47)
System implementation projects Projetos de Tecnologia da Informação - EN from 2009, Weg S.A. (note 13, p. 10);
Desenvolvimento e Implantação de Sistemas - EN from 2010, Fibria Celulose S.A. (note 19, p. 75);
Implantação de Sistemas - EN from 2010, Forjas Taurus S.A. (note 16, p. 38);
Projetos Sistema – ERP - EN from 2010, Positivo Informática S.A. (note 14, p. 40)
Information systems Sistema de Gestão Empresarial - EN from 2008, São Paulo Alpargatas S.A. (note 10, p. 6)
Software Sistemas Aplicativos de Software - EN from 2007, Bematech Ind. e Com. de Equipamentos Eletrônicos S.A. (note 15, p. 16)
Software e Licenças - EN from 2009, Randon S.A. Implementos e Participações (note 12, p. 16); NE de 2010, Kepler Weber S.A. (note 19, p. 54);
Softwares - EN from 2009, Telefônica Brasil S.A. (note 13, p. 19); EN from 2010 do Itautec S.A. (note 15, p. 44); EN from 2010, Iochpe-Maxion S.A. (note 12, p. 67)
Programas de Computador (Softwares) – EN from 2010, Embraer S.A. (note 18, p. 45);
Sistemas de Processamento de Dados - EN from 2010, Telemar Participações S.A. (note 18, p. 91);
Softwares Adquiridos - EN from 2010, Usinas Sid. de Minas Gerais S.A. – Usiminas (note 19, p. 107)
Other
intangibles Other Outros22); EN from 2009, Totvs S.A. (note 13, p. 30); EN from - EN from 2008, Unipar Carbocloro S.A. (note 14, p. 2010, Usinas Sid. de Minas Gerais S.A. – Usiminas (note 19, p. 107); EN from 2010, Positivo Informática S.A. (note 14, p. 40);
Outros Ativos Intangíveis - EN from 2010, Telemar Participações S.A. (note 18, p. 91);
Outros Ativos - EN from 2010, Tim Participações S.A. (note 17, p. 47)
Note. Source: Data collected for the study.
assets), acquisition of payroll (human-centered assets) and expenditure on shopfitting, distance-learning projects, administrative services and preoperational expenses (infrastructure assets).
Some of the indicators of intangible assets (goodwill resulting from expected future profitability, brands, patents and software) were more frequently disclosed than others (such as cost of removing property and reforestation, goodwill resulting from operations, concessions, exclusive agreements, product research and development, technology, completed projects, expenditure on ongoing projects, setup of facilities on third-party premises, sales outlets, system implementation projects, and information systems).
Some of the terminology employed by the sampled firms, as displayed in Table 6, was similar to that adopted by Brooking (1996), for example with regard to customer portfolios, brands and patents. Other indicators featured a more diversified terminology, for example with regard to goodwill resulting from expected future profitability, system implementation projects, and software. In some cases, the categories of intangible assets (Brooking, 1996) displayed in Table 3 were used to classify items extracted from the content analysis of the explanatory notes (e.g. other acquired rights, setup of facilities on third-party premises, and information systems).
Table 7 shows total values of intangible assets as disclosed in accounting statements issued over the period 2007-2010 by innovative Brazilian firms and the proportion (%) of corporate investments in each category of assets (Brooking, 1996).
Table 7
Total Amount (USD) and Distribution of Investments in Different Categories of Intangible Assets (Brooking, 1996) in a Sample of 137 Innovative Brazilian Firms in the Period 2007-2010
Period Total investment in intangible
assets
Distribution of investment in intangible assets
Market assets
Human-centered
assets
Intellectual property
assets
Infrastructure assets
Other intangibles
2007 30127619.00 9298308.61 0 13788968.55 5710401.47 1329940.37
100% 30.86% 0.00% 45.77% 18.95% 4.41%
2008 56497608.45 26426011.84 0 22963556.88 6898746.36 209293.37
100% 46.77% 0.00% 40.65% 12.21% 0.37%
2009 120830923.20 60105892.90 0 50928760.70 9356754.27 439515.29
100% 49.74% 0.00% 42.15% 7.74% 0.36%
2010 133212366.80 51872838.00 0 68082271.80 10789474.00 2467783.00
100% 38,94% 0.00% 51.11% 8.10% 1.85%
Total 340668517.40 147703051.40 0 155763557.90 32755376.10 4446532.03 Note. Source: Data collected for the study.
As shown in Table 7, investments were predominantly made in intellectual property assets and market assets. Overall, an increase in intangible assets was observed, in both relative and absolute numbers, throughout the study period.
Table 8
Distribution of Investments in Different Categories of Intangible Assets (Brooking, 1996) as Disclosed in the Accounting Statements of a Sample of 137 Innovative Brazilian Firms in the Period 2007-2010, Organized According to IBI Level of Innovativeness
IBI level of innovativeness
Period Distribution of investments in intangible assets
Market assets Human-centered
Assets
Intellectual property assets
Infrastructure assets
Other intangibles
Group 1 2007 44.47% 0.00% 14.65% 40.12% 0.76%
2008 20.81% 0.00% 57.65% 20.89% 0.65%
2009 30.85% 0.00% 48.25% 19.43% 1.47%
2010 52.29% 0.00% 33.90% 11.30% 2.50%
Group 2 2007 23.32% 0.00% 50.99% 20.71% 4.99%
2008 30.75% 0.00% 52.35% 16.41% 0.49%
2009 35.31% 0.00% 54.76% 9.70% 0.23%
2010 11.45% 0.00% 74.79% 10.97% 2.78%
Group 3 2007 93.57% 0.00% 4.17% 2.26% 0.00%
2008 87.65% 0.00% 5.83% 6.52% 0.01%
2009 93.58% 0.00% 3.12% 3.30% 0.01%
2010 61.25% 0.00% 9.78% 28.96% 0.01%
Group 4 2007 68.93% 0.00% 27.11% 1.80% 2.16%
2008 85.71% 0.00% 13.37% 0.84% 0.08%
2009 90.13% 0.00% 8.06% 1.06% 0.75%
2010 88.09% 0.00% 10.81% 0.96% 0.14%
Note. Source: Data collected for the study.
It may be observed (Table 8) that investments in infrastructure assets were predominant among technology-intensive firms (Groups 1 and 2), with emphasis on investments in new stores, ongoing projects, facilities installed on third-party premises, sales outlets, implementation of systems, information systems and software. Conversely, in less technology-intensive firms (Groups 3 and 4), investments tended to concentrate on market assets, such as goodwill, brands, acquisitions and equity.
Table 9
Descriptive Statistics
Parameters of descriptive statistics
Market assets
Intellectual property
assets
Infrastructure assets
Other intangibles
Total intangible
assets
Number of
observations 548 548 548 548 548
Mean 269,531.12 284,240.07 59,772.58 8,114.11 621,657.88
Median 114.00 34.50 0.00 0.00 6,104.50
Standard deviation 1,359,265.04 1,468,260.50 247,136.22 65,081.69 2,173,583.44 Coefficient of
Variation (%) 5.04 5.17 4.13 8.02 3.50
Interval 21,610,615.00 16,012,390.00 3,111,134.00 1,056,859.00 21,607,999.00
Minimum -771,805.00 0.00 -13,439.00 0.00 -14,646.00
Maximum 20,838,810.00 16,012,390.00 3,097,695.00 1,056,859.00 21,593,353.00 Note. Source: Data collected for the study.
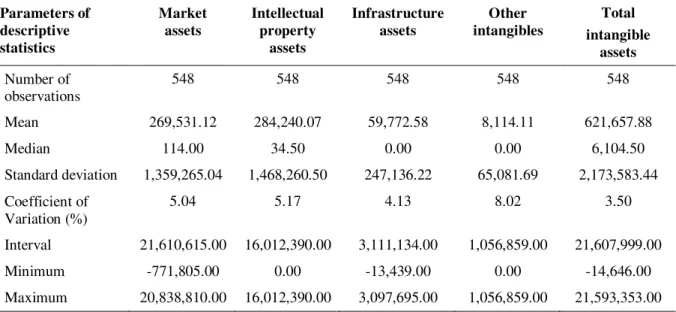
The number of observations (n=548) corresponds to the number of firms in the sample (n=137) multiplied by the number of years (n=4) in the study period. The coefficient of variation is greatest for the category other intangibles, which includes less-relevant or difficult-to-categorize assets of the
public firms analyzed. Investments in infrastructure assets were the most homogeneous of the categories
(Table 9). The category human-centered assets was not included in Table 6 as none of the sampled
firms disclosed information on this resource, probably because human-centered assets ― defined by
Brooking (1996) as benefits to organizations from the expertise, creativity, knowledge and problem-solving skills of individuals, considered collectively and dynamically ― can be very difficult to quantify, despite the claim by Pacheco (2005) that human capital, represented by the set of skills and knowledge available to an organization, can be measured and disclosed.
The highest mean values were observed for intellectual property assets, closely followed by market assets, indicating a preference in our sample of innovative firms for investment in these two categories of intangible assets.
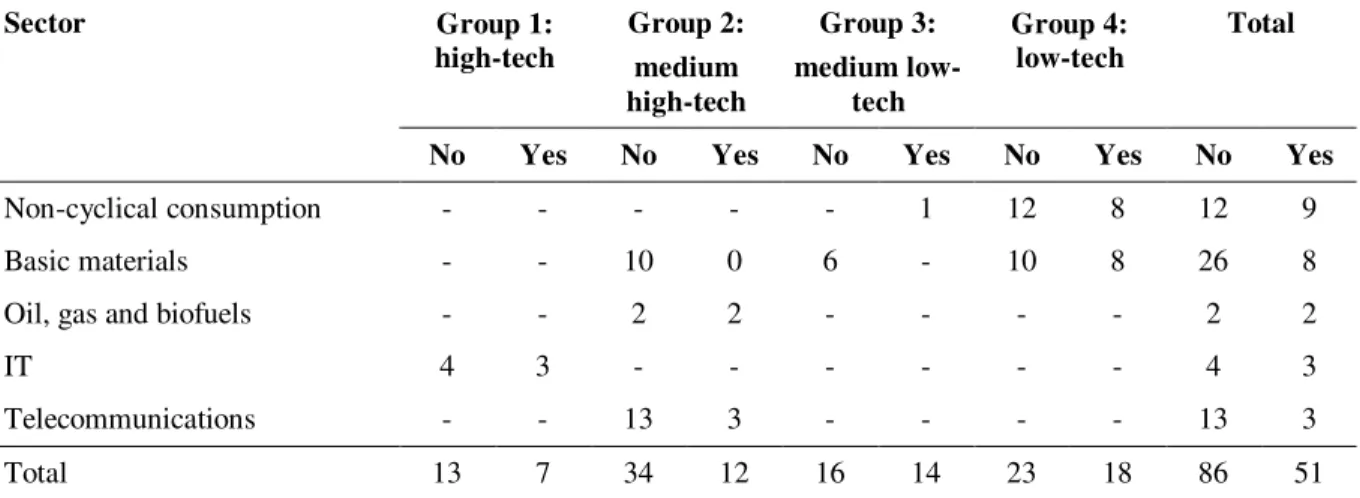
Table 10 shows the number of firms with and without superior and sustained performance, according to sector and IBI level of innovativeness.
Table 10
Classification of 137 Innovative Firms According to Sector, IBI Level of Innovativeness and Presence (“Yes”) or Absence (“No”) of Superior and Sustained Performance
Sector Group 1:
high-tech
Group 2: medium high-tech
Group 3: medium
low-tech
Group 4: low-tech
Total
No Yes No Yes No Yes No Yes No Yes
Capital goods and services 9 4 8 4 - - - - 17 8
Construction and transportation - - - - 2 1 - - 2 1
Table 10 (continued)
Sector Group 1:
high-tech
Group 2: medium high-tech
Group 3: medium
low-tech
Group 4: low-tech
Total
No Yes No Yes No Yes No Yes No Yes
Non-cyclical consumption - - - 1 12 8 12 9
Basic materials - - 10 0 6 - 10 8 26 8
Oil, gas and biofuels - - 2 2 - - - - 2 2
IT 4 3 - - - 4 3
Telecommunications - - 13 3 - - - - 13 3
Total 13 7 34 12 16 14 23 18 86 51
Note. Source: Data collected for the study.
Based on disclosed ROA values, 51 (37%) versus 86 (63%) of the 137 firms in our sample
displayed superior and sustained performance. Of these, as many as 17 (~33%) belonged to the cyclical
consumption sector.
Subsequently, the collected data were submitted to the Kolmogorov-Smirnov test for normality and a test for equality of means. The results are shown in Table 11.
Table 11
Result of Kolmogorov-Smirnov Test for Normality
Variable p-value Reject H0?
Market assets 0.000*** Yes
Intellectual property assets 0.000*** Yes
Infrastructure assets 0.000*** Yes
Other intangibles 0.000*** Yes
Total 0.000*** Yes
Note. Source: Data collected for the study.
† = p<0.10; * = p<0.05; ** = p<0.01; *** = p<0.001
As shown in Table 11, the null hypothesis was rejected for all variables. Since the distribution
was non-normal in all cases (p<0.05), a test for nonparametric variables (Mann-Whitney) was employed.
Table 12
Result of the Mann-Whitney Test
Variable p-value Reject H0?
Market assets 0.286 No
Intellectual property assets 0.006*** Yes
Infrastructure assets 0.009*** Yes
Other intangibles 0.434 No
Total 0.481 No
Note. Source: Data collected for the study.
† = p<0.10; * = p<0.05; ** = p<0.01; *** = p<0.001
Table 12 shows that, when comparing firms with and without superior and sustained performance, the null hypothesis could not be rejected, indicating statistical similarity between the mean values of the intangible assets in the categories market assets, other intangibles and total intangible assets
(p>0.05).
On the other hand, with regard to the categories intellectual property assets and infrastructure
assets, the null hypothesis was rejected (p<0.05) and the alternative hypothesis confirmed, indicating a
significant difference between firms with and without superior and sustained performance.
Thus, firms with superior and sustained performance displayed significantly higher mean values
in the categories intellectual property assets and infrastructure assets. According to Besanko,
Dranove, Shanley and Schaefer (2006), financial earnings above the sector average confer a competitive advantage for a firm in a given market.
To our knowledge, no previous study has compared innovative firms with and without superior and sustained performance with regard to intangible assets segregated by category. Several authors (Carvalho et al., 2010; Kayo, 2002; Megna & Klock, 1993; Perez & Famá, 2006; Villalonga, 2004) have studied intangibility in general as a determinant of business performance and found investments in intangibles to be more prevalent in firms with superior and sustained performance.
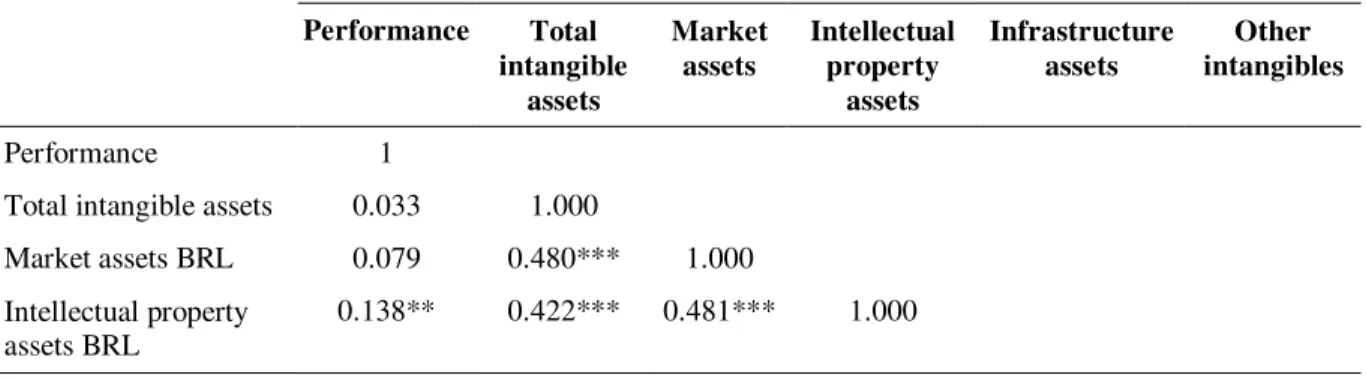
The results of the test of correlation between investments in intangible assets (in BRL) and corporate performance (ROA) are shown in Table 13.
Table 13
Correlation Matrix
Performance Total intangible
assets
Market assets
Intellectual property
assets
Infrastructure assets
Other intangibles
Performance 1
Total intangible assets 0.033 1.000
Market assets BRL 0.079 0.480*** 1.000 Intellectual property
assets BRL
0.138** 0.422*** 0.481*** 1.000
Table 13 (continued)
Performance Total intangible
assets
Market assets
Intellectual property
assets
Infrastructure assets
Other intangibles
Infrastructure assets
BRL 0.063 0.320*** 0.327*** 0.376*** 1.000
Other intangibles BRL 0.082 0.842*** 0.675*** 0.611*** 0.431*** 1.000 Note. Source: Data collected for the study.
*** Correlation significant at 0.01; ** Correlation significant at 0.05; * Correlation significant at 0.10.
As shown in Table 13, a non-significant correlation was observed between total investments in intangible assets and corporate performance. More specifically, performance was positively and significantly correlated with investments in intellectual property assets. However, the correlation between performance and intellectual property was weak (coefficients from 0.1 to 0.3).
In addition, using corporate performance (ROA) as dependent variable, regression models were developed to analyze the relation between the study variables. In the first regression model, the
independent variables were the control variables company size, dummy sector and dummy innovation
group (according to the IBI). In the second regression model, the independent variables included the
same control variables and the variables representing categories of investment in intangible assets (according to Brooking, 1996). Finally, in the third regression model, the independent variables were
the same control variables and total investment in intangible assets. Robust regressions were
performed to prevent homoscedasticity. Variance inflation factor (VIF) analysis was used to rule out multicollinearity. The analysis yielded acceptable results (multicollinearity between 1 and 10), with VIF values below 4 in all cases.
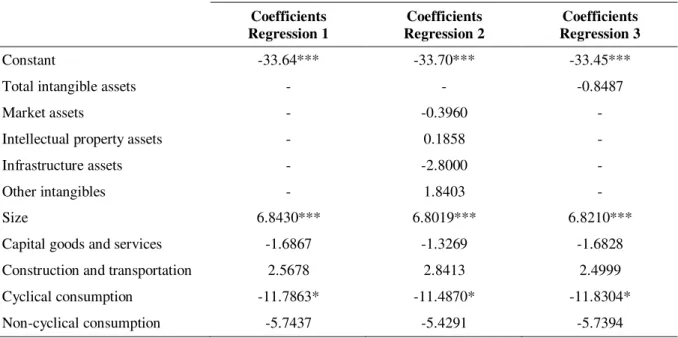
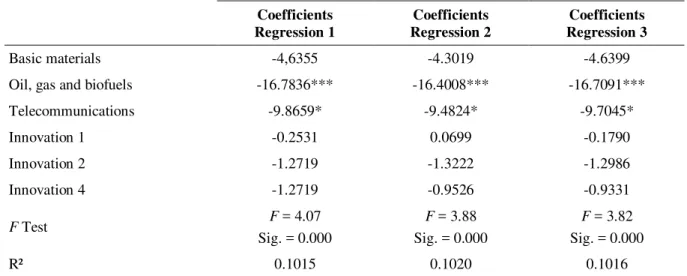
The results of the robust regression analyzed with the ordinary least squares method are displayed in Table 14. The variables D7_IND and D3_INOV were excluded due to exact collinearity.
Table 14
Regression Models
Coefficients Regression 1
Coefficients Regression 2
Coefficients Regression 3
Constant -33.64*** -33.70*** -33.45***
Total intangible assets - - -0.8487
Market assets - -0.3960 -
Intellectual property assets - 0.1858 -
Infrastructure assets - -2.8000 -
Other intangibles - 1.8403 -
Size 6.8430*** 6.8019*** 6.8210***
Capital goods and services -1.6867 -1.3269 -1.6828
Construction and transportation 2.5678 2.8413 2.4999
Cyclical consumption -11.7863* -11.4870* -11.8304*
Non-cyclical consumption -5.7437 -5.4291 -5.7394
Table 14 (continued)
Coefficients Regression 1
Coefficients Regression 2
Coefficients Regression 3
Basic materials -4,6355 -4.3019 -4.6399
Oil, gas and biofuels -16.7836*** -16.4008*** -16.7091***
Telecommunications -9.8659* -9.4824* -9.7045*
Innovation 1 -0.2531 0.0699 -0.1790
Innovation 2 -1.2719 -1.3222 -1.2986
Innovation 4 -1.2719 -0.9526 -0.9331
F Test F = 4.07
Sig. = 0.000
F = 3.88 Sig. = 0.000
F = 3.82 Sig. = 0.000
R² 0.1015 0.1020 0.1016
Note. Source: Data collected for the study.
*** Correlation significant at 0.01; ** Correlation significant at 0.05; * Correlation significant at 0.10.
As shown in Table 14, corporate performance was not significantly correlated with any of the indicators of investment in intangible assets. However, performance was positively correlated with
company size and negatively correlated with oil, gas and biofuels and, at the 10% level of significance, cyclical consumption, as indicated by the sign of the coefficient. Thus, firms in these sectors were less
likely to perform well.
The F test showed the three models to be significant, and R² was 10.15%, 10.20% and 10.16%,
respectively, indicating the power of the models to explain the relation between the dependent and independent variables in each case.
The first model (control variables only) revealed a correlation between corporate performance and company size, oil, gas and biofuels, cyclical consumption and telecommunications. The
correlation was positive for company size and negative for the remaining three variables.
The second regression (control variables + categories of investment in intangible assets according to Brooking, 1996) yielded similar results. Had the correlation between corporate performance and investment in intangible assets been significant, it would have been negative for investment in market assets and infrastructure and positive for investment in intellectual property and other intangibles, as indicated by the sign of the coefficient. In other words, investment in market assets and infrastructure assets had a negative influence on corporate performance, whereas investment in intellectual property assets and other intangibles, if significant, would have a positive influence on performance. Hence, not all the investments classified by Brooking (1996) were associated with improved performance.
The third regression (control variables + total investment in intangible assets) yielded similar results; i.e. no significant correlation between corporate performance and investment in intangible assets. However, had the correlation been significant, it would have been negative, as indicated by the sign of the coefficient. From Table 14 it may be inferred that had the total amount of investments in intangible assets been significant, it would have had a negative effect on corporate performance (the
coefficient is negative). It would seem the coefficient was influenced by infrastructure assets, which