PRODUCTION STUDIES REVEAL HIGH LEVELS OF POLYMORPHISM
Laurí Mayer1*; Wladimir Padilha da Silva1; Andrea Bittencourt Moura2; Claire Tondo Vendruscolo3
1
Departamento de Ciência e Tecnologia Agroindustrial, Faculdade de Agronomia Eliseu Maciel, Universidade Federal de Pelotas,
Pelotas, RS, Brasil; 2Departamento de Fitossanidade, Faculdade de Agronomia Eliseu Maciel, Universidade Federal de Pelotas,
Pelotas, RS, Brasil; 3Centro de Biotecnologia, Universidade Federal de Pelotas, Pelotas, RS, Brasil.
Submitted: August 28, 2009; Returned to authors for corrections: October 17, 2009; Approved: March 29, 2010.
ABSTRACT
Amplified fragment length polymorphism (AFLP) was used to analyze the genetic diversity of 14 strains
of Xanthomonas arboricola pv. pruni and seven strains of X. axonopodis pv. phaseoli, which are used in
xanthan production studies. Relationships identified by the AFLP profiles were assessed for xanthan
production capacity, geographical location and host plant. Strains were isolated from 10 different
geographic regions in South and Southeast States in Brazil. Data were analyzed for genetic similarity using
the Dice coefficient and subjected to UPGMA cluster analysis. A total of 128 AFLP fragments were
generated from four primer combinations: EcoRI+C/MseI+0, EcoRI+A/MseI+0, EcoRI+G/MseI+T and
EcoRI+G/MseI+A. Of these, 96.1% were polymorphic. X. axonopodis pv. phaseoli (SD = 0.27) was shown
to be more polymorphic than X. arboricola pv. pruni (SD = 0.58). All 14 pathovar pruni strains were
included in a single main group (SD = 0.58), while the pathovar phaseoli strains were divided into three
separate groups, with one group containing five strains (SD = 0.38) and two isolated groups (SD = 0.31 and
0.27) composed of only one strain each. Species were distinguished by three and eight specific AFLP
markers present in the pathovar phaseoli and the pathovar pruni, respectively. For the unique strain
without xanthan production capacity (X. axonopodis pv. phaseoli str. 48), nine specific AFLP bands were
found. There was no evidence that geographic area or host plant influenced genetic heterogeneity.
Correlations between AFLP patterns and xanthan production capacity were found in some strains, but were
not consistent enough to establish a relationship.
Key words: DNA fingerprints; genomic diversity; pathovar phaseoli; pathovar pruni.
INTRODUCTION
The genus Xanthomonas is composed of phytopathogenic
bacterial species that cause diseases in different crop plants,
resulting in significant crop losses worldwide. Each species
infects specific hosts (18). In addition to causing diseases in
crops, most of the species produce xanthan gum via an aerobic
fermentation process. Xanthan gum is an important biopolymer
and is used in the food, oil and cosmetics industries. For
industrial production of xanthan gum, X. campestris pv.
campestris strain NRRL B-1459 is normally used. However,
other Xanthomonas species have been shown to be capable of
xanthan production, including strains with considerable
xanthan yields such as the X. arboricola pv. pruni strains
isolated from Brazil (2, 4, 20).
X. arboricola pv. pruni (19) is the causal agent of Prunus
Bacterial Spot disease (PBS), which infects cultivated Prunus
species and their hybrids. In southern Brazil, hundreds of
strains have been isolated from peach and plum trees at the
Centro de Pesquisa Agropecuária de Clima Temperado. From
this collection, diverse studies have been conducted, mainly
investigating xanthan yields obtained by fermentation
processes, including their rheological properties and chemical
compositions (2, 3, 13, 17, 20). X. axonopodis pv. phaseoli (14,
19) infects mainly Phaseolus vulgaris and causes Common
Bacterial Blight, but other legume species are also naturally
infected. Xanthan production studies have also been reported
for this strain (11, 12).
Many studies have used molecular biology techniques
with diverse Xanthomonas species to show high levels of
genetic diversity (polymorphism) in the genus as well as within
species (1, 8, 9, 21, 22, 25). On the other hand, pathovars from
different species have shown strong genetic similarities,
resulting in a total reclassification of the Xanthomonas genus
(19). Amplified fragment length polymorphism (AFLP) has
been used successfully to study genetic diversity in
Xanthomonas (22), allowing for the identification of pathovars
and allowing strains with a high degree of genetic similarity to
be distinguished (23).
The purpose of the present study was to investigate the
genomic variability of the X. arboricola pv. pruni and X.
axonopodis pv. phaseoli strains used in xanthan production
studies. For the AFLP analyses, strains with different xanthan
production capacities in MPII medium were chosen.
MATERIAL AND METHODS
Bacterial strains
A total of 21 Xanthomonas strains were used in this study,
including 7 X. axonopodis pv. phaseoli and 14 X. arboricola
pv. pruni strains (Table 1), isolated from 10 different
geographic regions in South and Southeast States in Brazil
(Fig. 1).
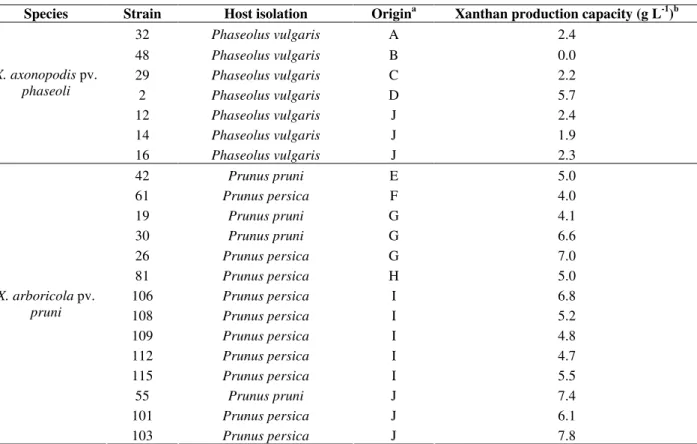
Table 1. Bacterial isolates used in this study, their plant host and geographical origin.
Species Strain Host isolation Origina Xanthan production capacity (g L-1)b
32 Phaseolus vulgaris A 2.4
48 Phaseolus vulgaris B 0.0
29 Phaseolus vulgaris C 2.2
2 Phaseolus vulgaris D 5.7
12 Phaseolus vulgaris J 2.4
14 Phaseolus vulgaris J 1.9
X. axonopodis pv.
phaseoli
16 Phaseolus vulgaris J 2.3
42 Prunus pruni E 5.0
61 Prunus persica F 4.0
19 Prunus pruni G 4.1
30 Prunus pruni G 6.6
26 Prunus persica G 7.0
81 Prunus persica H 5.0
106 Prunus persica I 6.8
108 Prunus persica I 5.2
109 Prunus persica I 4.8
112 Prunus persica I 4.7
115 Prunus persica I 5.5
55 Prunus pruni J 7.4
101 Prunus persica J 6.1
X. arboricola pv.
pruni
103 Prunus persica J 7.8
a See Fig. 1.
Figure 1. Detailed map of the geographic locations (in Brazil) where the 21 Xanthomonas strains used in this study were isolated.
Genomic DNA extraction
The strains were incubated in 20-ml tubes containing 5 ml
YM medium (0.3% malt extract, 0.3% yeast extract, 1%
glucose, 0.5% peptone) for 24 h at 300 rpm and 28ºC. Aliquots
of 2 ml of culture (O.D.580 = 1) were collected for extraction.
The cells were washed twice with water and subsequently
centrifuged to remove the xanthan gum. The cells were lysed
using 500 l of 5% SDS solution at 60ºC for 40 min. Genomic
DNA was purified using phenol/chloroform extraction,
precipitated with ice-cold ethanol and resuspended in 30 l TE
buffer. The concentration was determined with a
spectrophotometer measuring A260 (1 absorbance unit = 50 g
ml-1). DNA quality was checked by measuring A280 and DNA
integrity was confirmed on a 1% agarose gel. The DNA
samples were adjusted to 100 ng l-1 and stored at -20ºC.
AFLP protocols
The procedures were performed as described by the
commercial AFLP kit for microorganisms from InvitrogenTM
Life Technologies (Carlsbad, CA, USA), with minor
modifications. The protocol involved the following steps: 1)
digestion of total genomic DNA with two restriction
endonucleases and ligation of oligonucleotide adapters; 2)
preselective amplification and selective amplification of a set
of restriction fragments by PCR; and 3) separation of amplified
DNA fragments with denaturing polyacrylamide gels.
DNA digestion and adapter ligation
DNA digestion was performed for 4 h at 37ºC. Reactions
were carried out in 10 l volumes containing 200 ng of sample
5X reaction buffer (50 mM Tris-HCl (pH 7.5), 50 mM
Mg-acetate, 250 mM K-acetate). Digestion was confirmed on a 1%
agarose gel. Endonucleases were denaturated at 70ºC for 15
min. DNA ligation was performed by adding 9.6 l of adapter
solution (EcoRI/MseI adapters, 0.4 mM ATP, 10 mM Tris-HCl
(pH 7.5), 10 mM Mg-acetate, 50 mM K-acetate) and 0.4 U of
T4 DNA ligase. Reactionswere subsequently incubated at 20ºC
for 5 h.
DNA amplification
Preselective amplification assays were carried out in 12 l
volumes containing 7.6 l of ligation mixture as template (not
diluted), 1 U of Taq DNA polymerase, 16 ng of EcoRI+0
primer, 16 ng of MseI+0 primer containing dNTPs and 1.2 l
of 10X buffer PCR plus Mg [100 mM Tris-HCl (pH 8.3), 15
mM MgCl2, 500 mM KCl). The thermal profile consisted of an
initial denaturation step at 94ºC (2 min), followed by 20 cycles
at 94ºC (30 s), 56ºC (1 min) and 72ºC (1 min), with a final
extension for 5 min at 72ºC.
Selective amplifications contained 2.5 l of DNA
(preamplified and diluted 20-fold diluted), 7 ng of EcoRI
primers, 15 ng of MseI primers containing dNTPs and 1 l of
10X buffer PCR plus Mg [100 mM Tris-HCl (pH 8.3), 15 mM
MgCl2, 500 mM KCl). The thermal profile consisted of an
initial denaturation step at 94ºC (3 min), followed by 30 cycles
at 94ºC (1 min), 65ºC (decreasing 1ºC per cycle during the first
10 cycles) (1 min) and 72ºC (1.5 min), with a final extension
for 5 min at 72ºC. Seven primer combinations were tested:
EcoRI+C/MseI+0, EcoRI+A/MseI+0, EcoRI+T/MseI+0,
EcoRI+G/MseI+T, EcoRI+A/MseI+C, EcoRI+G/MseI+A and
EcoRI+AC/MseI+G. PCR reactions were performed in a Peltier
PTC-100 thermocycler.
Electrophoresis of PCR products
The final amplified products were denatured at 94ºC and
immediately placed on ice. Samples (6 l) were loaded and
separated on a 6% polyacrylamide denaturing gel at a constant
power of 60 W for 2 h at 50ºC in 1X TBE buffer. Finally, the
gels were silver stained according to Creste et al. (6).
Data analysis
AFLP markers (100 to 450 bp) obtained were manually
scored for either present [1] or absent [0] bands in individual
lanes. Only strong bands were scored; faint bands were
discarded. The binary matrix was used for calculation of
genetic diversity among isolates on Dice’s coefficient. Cluster
analysis and dendrogram construction were done using the
unweighted pair group method with an arithmetic mean
(UPGMA) in the NTSYS-PC 2.1 software (Applied
Biostatistics Inc). The bootstrap values were generated using
Winboot software (24).
RESULTS
Selection of AFLP primers
Primer combination assays were performed to determine
which AFLP primers had the optimal number of selective
nucleotides to generate an average of 30 bands per sample.
After screening seven primer combinations, four were chosen
for use in this study (Table 2). The primer combinations
EcoRI+T/MseI+0 and EcoRI+A/MseI+C did not generate clear
AFLP patterns and the number of bands of the primer
combination EcoRI+AC/MseI+G was very low. The
reproducibility of the AFLP profiles was determined using two
isolates of X. arboricola pv. pruni and two isolates of X.
axonopodis pv. Phaseoli, which were each processed three
times. No differences were observed between experimental
replicates.
Polymorphism level and cluster analysis
The sizes of bands scored in all gels were in the range of
100-450 bp. In total, 128 amplification products were
produced, of which 123 were polymorphic (Table 2).
Consequently, only five bands were shared among all strains,
showing a high polymorphism level (91.9% to 100%),
depending on the primer combination used. Within species, the
polymorphic level was 94.7 and 87.2% in pathovar phaseoli
Table 2. Primer combination, groups formed, number of AFLP bands and percentage of polymorphic bands resulting from AFLP analysis of X. axonopodis pv. phaseoli and X. arboricola pv. pruni.
No. Primer combination No. of AFLP bands No. of Polymorphic bands Polymorphism (%)
1 EcoRI+C/MseI+0 33 32 97
2 EcoRI+A/MseI+0 37 34 91.9
3 EcoRI+G/MseI+T 30 29 96.7
4 EcoRI+G/MseI+A 28 28 100
Total 128 123 96.1
Group I 65 63 96.9
Group II 28 28 100
Group III 25 25 100
Group IV 80 75 93.7
Size range: 100-450 bp.
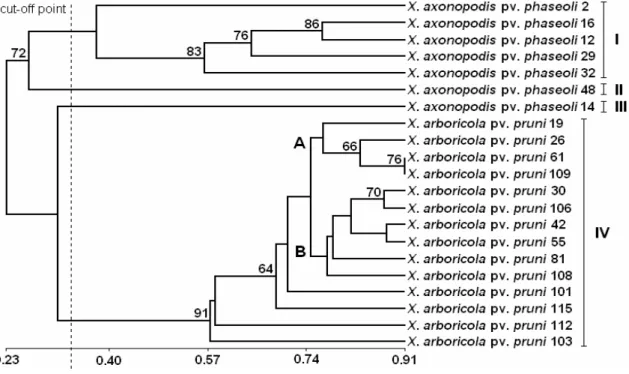
The 123 AFLP polymorphic fragments were used to
construct the dendrogram and to estimate the genetic diversity
among the Xanthomonas strains. The cophenetic correlation
coefficient (r), calculated between the binary matrix data and
the dendrogram generated, was 0.97. Based on a cut-off point
of 0.33 (calculated by NTSYS-PC 2.1 software) in Dice’s
similarity coefficient scale, the 21 strains were divided into
four groups (Fig. 2). All 14 strains of X. arboricola pv. pruni
were grouped into a single main cluster (SD = 0.58), named
Group IV. Additionally, in this group, two subgroups were
identified, named A (SD = 0.78) and B (SD = 0.82). X.
axonopodis pv. phaseoli strains were more polymorphic, with
strains 2, 12, 16, 29 and 32 in Group I (SD = 0.38) and the other
two strains (48 and 14) inserted in the isolated Group II (SD =
0.27) and Group III (SD = 0.31), respectively. The presence of
three exclusive AFLP bands in all X. axonopodis pv. phaseoli
strains and eight in all X. arboricola pv. pruni strains have
distinguished these pathovars.
Figure 2. Dendrogram obtained by UPGMA method using Dice’s similarity coefficient from 21 Xanthomonas strains based on 123 polymorphic
AFLP markers. Four groups were generated (I, II, III and IV). Subgroups in group IV are indicated as “A” and “B”. Bootstrap values larger than
Genetic heterogeneity was not influenced by the
geographical location of the strains. Different patterns were
found within one site, and similar molecular patterns were
found in strains collected at different sites. In pathovar pruni,
subgroups A and B contain strains isolated from different sites
and the two most genetically-related strains (X. arboricola pv.
pruni str. 61 and 109; SD = 0.91) were isolated 400 km away
from each other. Additionally, this pathovar no showed
differences in AFLP profiles based on the host isolation
(Prunus persica and P. pruni). In the pathovar phaseoli, three
strains were isolated from the same place, but only two (X.
axonopodis pv. phaseoli str. 12 and 16) showed the highest
genetic similarity (SD = 0.77) in comparison with the other
strains of the pathovar.
Robust relationships between genetic similarity and
xanthan production capacity with these strains were not found.
However, similar xanthan yields were observed for X.
arboricola pv. pruni str. 61 and 109 (SD = 0.91; xanthan
production: 4.1 and 4.8 g L-1, respectively) and for X.
arboricola pv. pruni str. 30 and 106 (SD = 0.87; xanthan
production: 6.6 and 6.8 g L-1, respectively). The two most
polymorphic strains had the lowest xanthan production
capacity (X. axonopodis pv. phaseoli str. 14) or no production
capacity (X. axonopodis pv. phaseoli str. 48). Moreover, for the
unique strain with no xanthan production capacity, nine
specific AFLP markers were identified.
DISCUSSION
Typically, 30 to 80 restriction fragments are amplified in
each AFLP reaction and detected by denaturing gel
electrophoresis. This number is mainly influenced by three
factors: number of selective nucleotides used in each primer
combination, recognition sites of the restriction enzymes and
C+G content of the genome analyzed (21). The relatively low
number of bands obtained with each primer combination
(approximately 32) was partly due to the fact that the
restriction enzymes EcoRI (G AATTC) and MseI (T TAA)
recognize T+A-rich sequences, but Xanthomonas genomes
have low T+A contents, with about 29-37% T+A. On the other
hand, complex fingerprints (with a large number of bands) can
be difficult to analyze manually. Thus, the quantity of AFLP
fragments obtained in each primer combination was considered
to be satisfactory.
The cophenetic correlation coefficient value found
indicates high co-linearity between the matrix data and the
dedrogram generated. Based on this value, the UPGMA
method was used to cluster the genotypes. High bootstrap
values showed that this clustering was well supported and that
the dendrogram generated was robust.
If the search for a pattern between genetic similarity and
geographical isolation includes both pathovars, partial
relationships can be observed. However, more detailed
observations show that differences in the AFLP profiles are
caused by the pathovar genetic profile, not by the geographic
area of each strain. These results are in accordance with
Zaccardelli et al. (25), who analyzed 109 X. arboricola pv.
pruni strains from different geographical locations and also
concluded that the AFLP technique did not have sufficient
resolution to distinguish this pathovar on the basis of
geographic area or host plant. Additionally, in a study using
AFLP with 66 isolates of X. arboricola pv. juglandis from
different countries, Loreti et al. (9) concluded that geographic
location could be only partly responsible for genomic
heterogeneity.
The high degree of genetic diversity found in the pathovar
phaseoli in this study is consistent with the results of Alavi et
al. (1), who first reported a large degree of genetic diversity in
this pathovar using AFLP assays from a worldwide collection.
These authors identified three distinct genetic lineages, but the
lineages were not geographically linked. The absence of a
pattern between genetic similarity and geographic location with
the pathovar phaseoli was also found by Manceau et al. (10),
who studied polymorphisms in the ISXax1 insertion sequence.
The dissemination of X. axonopodis pv. phaseoli through
contaminated seeds is the probable reason for the lack of a
geographically structured genetic profile (10).
influenced by wind and rain events over time. Thus, the
presence of a high level of genetic heterogeneity among
pathovar pruni strains isolated from the three places (H, I and
J) that have relatively small distances between them (< 100
km) is strong evidence that the pathovar pruni population from
this geographical region is composed of different genetic
groups. This evidence is strengthened by the hundreds of strain
isolates from this region (20), indicating a very rich
Xanthomonas microbiota. Nevertheless, to strengthen this
evidence, a genetic diversity study that includes a larger
number of strains will be necessary. In the pathovar phaseoli, it
is possible that geographic area is partly responsible for the
high levels of polymorphism found. However, to prove this, it
will be necessary to study more than one strain from each
location.
Genetic polymorphism is also influenced by IS elements,
which play an important role in bacterial evolution. These
mobile genetic elements are an important source of genomic
variability in prokaryotes, mainly by promoting chromosomal
rearrangements and genetic exchanges between bacterial
populations (10, 16). Pathovar pruni were shown to be missing
a considerable number of IS elements in the pathovar pruni
genome compared to the reference strains X. campestris pv.
campestris B100 and X. campestris pv. vesicatoria 85-10
(determined by microarray comparative genomic hybridization
(unpublished data)). Interestingly, Manceau et al. (10)
identified a new insertion sequence (ISXax1) in pathovar
phaseoli and suggested that it may contribute to genetic
diversity.
The absence of clear relationships between genetic
similarity, xanthan production capacity and plant host isolation
can be explained by the small DNA regions that are responsible
for these features. Host specificity to phytopathogenic bacteria
is usually established by specific molecular receptors present
on both surfaces. In these microorganisms, the molecular
receptors are encoded by a small number of genes, representing
a small part of the genome. The same is true of the xanthan
biosynthetic process, which is encoded by a 16-kb operon of 12
genes (gumB to gumM), as well as some other related genes,
representing less than 1% of the Xanthomonas genome (about
5 Mb). Thus, the polymorphisms present in a single gene or
operon represents only a small part of the polymorphisms in
the entire genome, and establishing relationships based on
these specific features can be very difficult with techniques
such as AFLP assays, which explore genetic polymorphisms at
the genome level.
In this study, AFLP analysis proved to be reproducible and
sufficiently sensitive to determine genetic diversity in the
pathovars of the strains studied. Moreover, the influence of
SNPs (single nucleotide polymorphisms) in the AFLP analysis
makes this technique a powerful tool to estimate genetic
diversity among very similar genomes, something that is
difficult to determine with other techniques, such as RAPD
(Random Amplification of Polymorphic DNA).
In conclusion, we report a high level of polymorphism
among the 21 Xanthomonas tested. The X. axonopodis pv.
phaseoli genome was shown to be more polymorphic in
comparison with X. arboricola pv. pruni and the strains were
differentiated by specific AFLP markers present in each
pathovar. AFLP-based genetic profiles and xanthan production
capacity relationships were not consistent enough to establish a
pattern and we did not find evidence that geographic area or
host plant influences genetic heterogeneity.
ACKNOWLEDGEMENTS
The authors of this paper are grateful to DCTA-UFPel
(Department of Food Science – Federal University of Pelotas)
and CAPES (Brazilian Federal Agency for Support and
Evaluation of Graduate Education) for financial support.
REFERENCES
2. Borges, C.D.; Vendruscolo, C.T. (2007). Xanthan synthesized by strains of Xanthomonas campestris pv. pruni: production, viscosity and chemical composition. Biosci. J. 23, 67-73.
3. Borges, C.D. (2004) Caracterização da goma xantana em função da cepa de Xanthomonas campestris pv. pruni e das condições operacionais. Rio Grande do Sul, Brasil. 49p. (M.Sc. Dissertation, Departamento de Ciência e Tecnologia Agroindustrial. UFPel).
4. Borges, C.D.; Paula, R.C.M.; Feitosa, J.P.A.; Vendruscolo, C.T. (2009). The influence of thermal treatment and operational conditions on xanthan produced by X. arboricola pv. pruni strain 106. Carbohydrate Polymers, 75, 262-268.
5. Cadmus, M.C.; Knutson, C.A.; Lagoda, A.A.; Pittsley, J.E.; Burton, K.A. (1978). Synthetic media for production of quality xanthan gum in 20 liter fermentors. Biotechnol. Bioeng. 20, 1003-1014.
6. Creste, S.; Neto, A.T.; Figueira, A. (2001). Detection of single sequence repeat polymorphisms in denaturing polyacrylamide sequencing gels by silver staining. Plant Mol. Biol. Rep. 19, 299–306.
7. Khodakaramian, G.; Swings, J. (2002). AFLP fingerprinting of the strains of Xanthomonas axonopodis inducing citrus canker disease in southern Iran. J. Phytopathol. 150, 227-231.
8. Kölliker, R.; Kraehenbuehl, R.; Boller, B.; Widmer, F. (2006). Genetic diversity and pathogenicity of the grass pathogen Xanthomonas translucens pv. graminis. Syst. Appl. Microbiol. 29, 109-119.
9. Loreti, S.; Gallelli, A.; Belisario, A.; Wajnberg, E.; Corazza, L. (2001). Investigation of genomic variability of Xanthomonas arboricola pv. juglandis by AFLP analysis. Eur. J. Plant Pathol. 107, 583-591. 10. Manceau, C.; Alavi, S.M.; Poussier, S. (2007). Characterization of
ISXax1, a Novel Insertion Sequence Restricted to Xanthomonas axonopodis pv. phaseoli (Variants fuscans and non-fuscans) and Xanthomonas axonopodis pv. vesicatoria. Appl. Environ. Microbiol. 73, 1678-1682.
11. Mayer, L. (2006) Caracterização molecular de cepas de Xanthomonas campestris e Xanthomonas axonopodis pela técnica de AFLP e relação com a produção, reologia e composição química da xantana. Rio Grande do Sul, Brasil. 68p. (M.Sc. Dissertation, Departamento de Ciência e Tecnologia Agroindustrial. UFPel).
12. Mayer, L.; Vendruscolo, C.T.; Silva, W.P.; Moura, A.B. (2008). Produção, propriedades reológicas e composição química da xantana produzida por Xanthomonas axonopodis pv. phaseoli. R. Bras. Tecnol. Agroind. 02, 87-95.
13. Moreira, A.S.; Diaz, P.S.; Vendruscolo, C.T. (2004). Production of xanthan by Xanthomonas campestris pv pruni strain 24 in fermentor: effect of aeration and fermentation time. R. Bras. Agrocien. 10, 31-36. 14. Moura, A.B.; Zanatta, Z.G.C.N.; Maia, L.C.; Santos, A.S. (2007).
Bioassay for selection of biocontroller bacteria against bean common
blight (Xanthomonas axonopodis pv. phaseoli). Braz. J. Microbiol. 38, 511-515.
15. Schaad, N.W.; Postnikova, E.; Lacy, G.H.; Sechler, A.; Agarkova, I.; Stromberg, P.E.; Stromberg, V.K.; Vidaver, A.K. (2005). Reclassification of Xanthomonas campestris pv. citri (ex Hasse 1915) Dye 1978 forms A, B/C/D, and E as X. smithii subsp. citri (ex Hasse) sp. nov. nom. rev. comb. nov., X. fuscans subsp. aurantifolii (ex Gabriel 1989) sp. nov. nom. rev. comb. nov., and X. alfalfae subsp. citrumelo (ex Riker and Jones) Gabriel et al., 1989 sp. nov. nom. rev. comb. nov.; X. campestris pv. malvacearum (ex Smith 1901) Dye 1978 as X. smithii subsp. smithii nov. comb. nov. nom. nov.; X. campestris pv. alfalfae (ex Riker and Jones, 1935) Dye 1978 as X. alfalfae subsp. alfalfae (ex Riker et al., 1935) sp. nov. nom. rev.; and ‘‘var. fuscans’’ of X. campestris pv. phaseoli (ex Smith, 1987) Dye 1978 as X. fuscans subsp. fuscans sp. nov. Syst. Appl. Microbiol. 28, 494-518.
16. Siguier, P.; Filée, J.; Chandler, M. (2006). Insertion sequences in prokaryotic genomes. Curr. Opin. Microbiol. 9, 526-531.
17. Souza, A.S.; Vendruscolo, C.T. (1999). Produção e caracterização dos biopolímeros sintetizados por Xanthomonas campestris pv. pruni cepas 24 e 58. Cienc. Engenh. 8, 115-123.
18. Vauterin, L.; Swings, J. (1997). Are classification and phytopathological diversity compatible in Xanthomonas? J. Ind. Microbiol. Biot. 19, 77-82. 19. Vauterin, L.; Hoste B.; Kersters, K.; Swings, J., (1995). Reclassification
of Xanthomonas. Int. J. Syst. Bacteriol. 45, 472-489.
20. Vendruscolo, C.T.; Moreira, A.S.; Vendruscolo, J.L.S.; Gil-Turnes, C. (2001). Screening among 18 novel strains of Xanthomonas campestris pv. pruni. Food Hydrocolloid. 15, 469-474.
21. Verdier, V.; Gonzalez, C.; Restrepo, S.; Tohme, J. (2002) Characterization of pathogenic and nonpathogenic strains of Xanthomonas axonopodis pv. manihotis by PCR-based DNA fingerprinting techniques. FEMS Microbiol. Lett. 215, 23-31.
22. Verdier, V.; Restrepo, S.; Duque, M.; Tohme, J. (1999) AFLP fingerprinting: an efficient technique for detecting genetic variation of Xanthomonas axonopodis pv. manihotis. Microbiology, 145, 107-114. 23. Voz, P.; Hogers, R.; Bleeker M.; Reijans, M.; Van de Lee, T.; Hornes,
M.; Frijters, A.; Pot, J.; Peleman, J.; Kuiper, M.; Zabeau, M. (1995). AFLP: a new technique for DNA fingerprinting. Nucleic Acids Res. 23, 4407-4414.
24. Yap, I.V.; Nelson, R.J. (1996). Winboot: A program for performing bootstrap analysis of binary data to determine the confidence limits of UPGMA-based dendrograms. International Rice Research Instititute (IRRI). Manila, Philippines, 22p.