Tatiana dos Reis Martins
Licenciada em Biotecnologia
Microencapsulation of antitubercular drugs in a matrix
of partially hydrolyzed guar gum, for application in
tuberculosis treatment
Dissertação para obtenção do Grau de Mestre em Bioquímica para a Saúde
Tatiana dos Reis Martins
Licenciada em Biotecnologia
Microencapsulation of antitubercular drugs in a matrix
of partially hydrolyzed guar gum, for application in
tuberculosis treatment
Dissertação para obtenção do Grau de Mestre em Bioquímica para a Saúde
Orientadora: Dr.ª Ana Margarida Grenha, Professora Auxiliar, Universidade do
Algarve
Júri:
Presidente: Prof. Doutor: Pedro Matias Arguente: Prof. Doutora: Manuela Gaspar Vogal: Prof. Doutora: Margarida Archer
ITQB, Oeiras
Dezembro, 2015
Microencapsulation of antitubercular drugs in a matrix
of partially hydrolyzed guar gum, for application in
tuberculosis treatment
Declaração de autoria de trabalho:
Declaro ser a autora deste trabalho, que é original e inédito. Autores e
trabalhos consultados estão devidamente citados no texto e constam da lista
de referências incluída no documento.
Tatiana dos Reis Martins
Copyright:
O Instituto de Tecnologia Química e Biológica António Xavier e a Universidade
Nova de Lisboa têm o direito, perpétuo e sem limites geográficos, de arquivar e
publicar esta dissertação através de exemplares impressos reproduzidos em
papel ou de forma digital, ou por qualquer outro meio conhecido ou que venha
a ser inventado, e de a divulgar através de repositórios científicos e de admitir a
sua cópia e distribuição com objetivos educacionais ou de investigação, não
Agradecimentos
Antes de mais gostaria de agradecer à minha Orientadora, a Professora Doutora Ana Grenha pelo seu acompanhamento, pelas reuniões, pelas críticas construtivas, pelos ensinamentos e paciência acima de tudo.
Quero expressar também os meus agradecimentos à Professora Doutora Leonor Faleiro, que representou para mim um papel de co-orientadora, pois representou um apoio importante na obtenção das estirpes bacterianas, na sua manipulação e na discussão de vários ensaios com bactérias quer preliminares quer efetivos, de forma a obter resultados representativos e robustos.
Gostaria de agradecer ao Professor Doutor João Lourenço que ajudou a determinar a estabilidade das micropartículas por Difração de Raios-X e apoiou bastante no tratamento e discussão destes dados.
Gostaria de agradecer à Professora Doutora Manuela Gaspar, por autorizar a utilização do picnómetro da FFUL, com o fim de determinar a densidade real das micropartículas.
Quero agradecer também, à técnica Cláudia Florindo que manipulou o microscópio de Epiflurescência e permitiu a obtenção de fotografias de fluorescência e contraste de ambas as estirpes de interesse, após várias tentativas até encontrarmos uma imagem decente, requerendo bastante paciência. E também à técnica Liseta pela sua simpatia, boa disposição e apoio.
Os maiores agradecimentos a todos os meus colegas do laboratório 2.22 (incluindo os alunos do Professor Mathias, o Miquel e o Joaquin) e colegas do 2.21 (que em parte foi como uma segunda “casa”), à Rita Nascimento do laboratório 3.30, à Catarina Afonso do CCMAR, quer pelo apoio, pela instrução, pela boa disposição, pelo companheirismo ao longo da minha breve estadia neste laboratório.
Por fim, devo um agradecimento à minha família pelo apoio, pela guarida e pela força que me permitiu avançar até este ponto.
Abstract
Tuberculosis (TB), despite being a completely curable disease, has reemerged due to drug resistance and deadly synergism with HIV infection, which limit the success of its management. Lung tuberculosis is the main manifestation of TB. Thus, exploring the inhalable route for a local delivery of antitubercular drugs seems a promising therapeutic approach. Partially hydrolyzed guar gum (PHGG) is a strong candidate as matrix material for antitubercular drug carriers. This is mainly due to its affinity for macrophages, the hosts of mycobacteria, which is mediated by the binding of sugar units to macrophage surface receptors. In this work, PHGG-based microparticle formulations were produced by spray-drying, evaluated for cristallinity pattern (X-ray diffraction) and ability for drug association, and in vitro drug release profiles were determined. The cytotoxicity of microparticles was also evaluated (MTT and LDH release assays). Additionally, the therapeutic effect of drug-loaded microparticles was evaluated in vitro on macrophage-like cells infected with mycobacteria strains. The results showed that microparticles exhibited suitable properties for pulmonary delivery (aerodynamic diameter between 1 and 3 μm). A favorable cytotoxic profile was evidenced, as no overt toxicity was detected in representative respiratory cell lines (A549 and Calu-3 cells), although a mild toxic effect was observed in macrophage-like cells. The in vitro response of infected macrophages to drug-loaded PHGG microparticles was considered promising, as only 20% of mycobacteria remained viable upon a single treatment with microparticles. This thesis addresses macrophages as therapeutic target, unraveling the unique role of polysaccharides on pulmonary drug delivery in the ambit of tuberculosis therapy.
Resumo
Tuberculose (TB), apesar de ser uma doença totalmente curável, tem reemergido devido à resistência a fármacos e ao sinergismo fatal com o VIH, o que limitou o sucesso de sua gestão. Tuberculose pulmonar é a principal manifestação da TB, assim, explorar a rota inalável para uma entrega local de fármacos antituberculares parece ser uma abordagem terapêutica promissora. Goma guar parcialmente hidrolisada (PHGG) é um forte candidato, como material matriz transportadora de fármacos antituberculares. Isto principalmente devido à sua afinidade para os macrófagos, os hospedeiros de micobactérias, mediada pela ligação de unidades de açúcar aos recetores de superfície de macrófagos. Neste trabalho, as formulações de micropartículas baseadas na matriz de PHGG foram produzidas por atomização, os seus padrões de cristalinidade (difração de raios-X) foram avaliados, a sua capacidade de associação de fármacos e o perfil de libertação in vitro de fármacos foram determinados. A citotoxidade das micropartículas foi também avaliada (ensaios de MTT e libertação de LDH). Além disso, o efeito terapêutico de micropartículas com fármacos, foi avaliado in vitro em células similares a macrófagos infetadas com estirpes micobacterianas. Os resultados mostraram que as micropartículas exibiram propriedades adequadas para entrega pulmonar (diâmetro aerodinâmico entre 1 e 3 μm). Evidenciaram um perfil citotóxico favorável, na ausência de citotoxicidade detectável nas linhas de células respiratórias representativa (A549 e Calu-3 células), apesar de um ligeiro efeito tóxico observado em células similares a macrófagos. A resposta in vitro de células similares a macrófagos infetadas por micropartículas de PHGG com fármacos antituberculares foi considerada promissora, uma vez que a viabilidade micobacteriana de 20% foi obtida após um único tratamento com micropartículas. Esta tese aborda os macrófagos como alvo terapêutico, desvendar o papel único de polissacarídeos na entrega da droga pulmonar no âmbito da terapia da tuberculose.
Contents
Agradecimentos ...I Abstract ...III Resumo ... V Contents ... VII Index of figures ... IX Index of tables ... XIII Abbreviations list ... XV
Chapter I - Introduction ...1
1.1. Historical perspective and epidemiology of tuberculosis...1
1.2. Pathogenesis of tuberculosis ...2
1.3. Mycobacterium spp...4
1.3.1. Mycobacterium bovis ...5
1.3.2. Mycobacteriumsmegmatis ...5
1.3.3. Mycobacterial cell wall ...6
1.4. Diagnosis and treatment of tuberculosis ...7
1.5. Antitubercular drugs...9
1.5.1. Isoniazid (INH) ...9
1.5.2. Rifabutin (RFB) ...10
1.6. Pulmonary drug delivery ...11
1.7. Polymeric microparticles of partially hydrolyzed guar gum ...12
Chapter II – Aims ...15
2.1. Main aim ...15
2.2. Partial aims ...15
Chapter III - Materials and Methods ...16
3.1. Microparticle preparation ...16
3.2. Microparticle characterization ...17
3.3. Determination of powder cristallinity ...18
3.4. Drug association efficiency and loading capacity ...18
3.5. In vitro drug release profile ...19
3.6. Cell Lines ...19
3.7. Evaluation of microparticle cytotoxicity ...20
3.8. Bacterial strains and growth conditions ...22
3.9. Minimal inhibitory concentration (MIC) determination ...23
4.1. Microparticle preparation and characterization ...27
4.2. Microparticle X-ray diffraction evaluation ...30
4.3. Drug association efficiency and loading capacity ...35
4.4. In vitro drug release profile ...37
4.5. Evaluation of microparticle cytotoxicity ...39
4.5.1. MTT assay ...39
4.5.2. LDH assay ...45
4.6. The susceptibility of M. smegmatis ...48
4.7. The susceptibility of M. bovis ...50
4.8. Therapeutic effectiveness in vitro ...51
Chapter V – Conclusions ...52
Chapter VI – Bibliography ...53
Index of figures
Figure 1.1 – Estimated co-infected TB with HIV cases all over the world. ...2
Figure 1.2 – Schematic diagram of the events occurring on macrophages infected with MTB. In 90-95% of the cases the disease stays arrested in the latent form, which is asymptomatic. In 5-10% of cases, MTB replicates inside the macrophage and the disease stays active, developing typical symptoms. ...4
Figure 1.3 – Representative scheme of M. tuberculosis cell wall structure. The figure shows the major components of the cell wall and their distribution. Schematic complex MA-AG-PG, mannose-capped glycoproteins, lipomannan and mannoglycoproteins are displayed. ...6
Figure 1.4 – Chemical structure of isoniazid...9
Figure 1.5 – Chemical structure of rifabutin. ...10
Figure 1.6 –Lung particle deposition pattern according to particle size. ...12
Figure 1.7 – Chemical structure of guar gum. ...13
Figure 1.8 – Manufacture scheme of PHGG, step by step. ...13
Figure 1.9 – Diagram of spray-drying method. Aqueous solution is fed through Büchi B-290 Mini Spray Dryer, where the solvent is evaporated, and spray-dried powder (microparticles) is collected at the end of the process. ...14
Figure 1.10 – Chemical structure of excipient mannitol. ...14
Figure 3.1 – Basic principle of the MTT assay. Yellow tetrazolium salt is reduced by mitochondrial reductases into dark red/purple formazan. ...20
Figure 3.2 – Basic metabolic reaction occuring in LDH assay. ...21
Figure 3.3 –The 96-well plate template in which column 2 had the medium (M) and column 4 the bacteria in triplicate, 1, 2 and 3 respectively. The columns 3-12 and rows A-F, contained the various drug dilutions with bacteria, and the rows G-H the drug dilutions in absence of the bacteria. The assay was done using 6 technical replicates (n=6). ...24
Figure 4.1 – FESEM microphotographs of different formulations of microparticles. A) PHGG, B) PHGG:Man, C) PHGG:Man:INH, D) PHGG:RFB, E) PHGG:INH:RFB. ...28
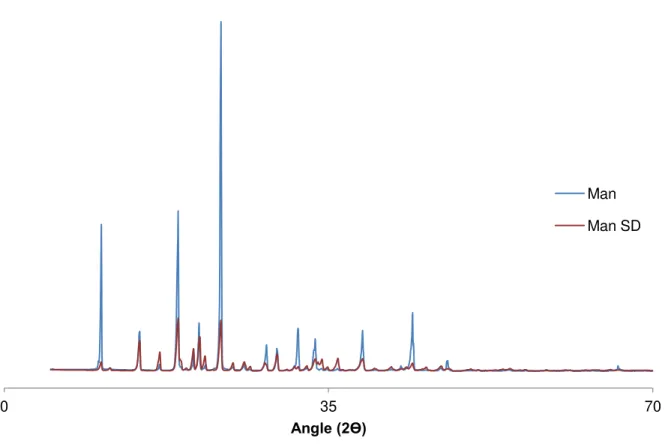
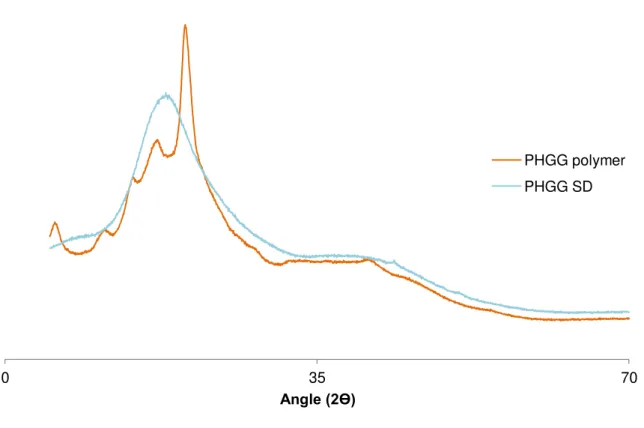
Figure 4.2 – X-ray diffraction patterns of mannitol in pure state and spray-dried (SD) mannitol.31 Figure 4.3 – X-ray diffraction patterns of PHGG polymer and spray-dried (SD) PHGG. ...32
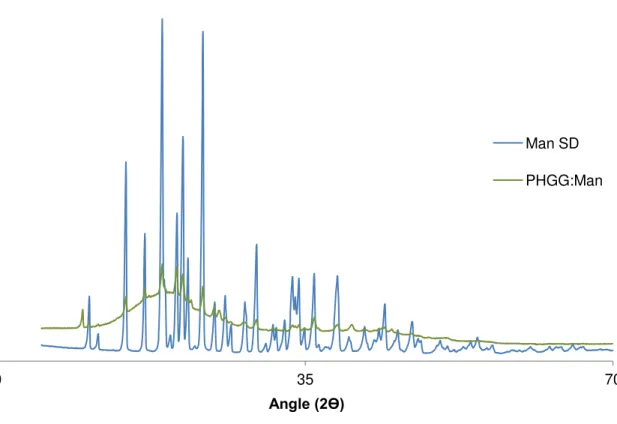
Figure 4.4 – X-ray diffraction patterns of spray-dried (SD) mannitol and PHGG:Man. ...33
Figure 4.5 – X-ray diffraction patterns of isoniazid (INH) in pure state and spray-dried (SD), PHGG spray-dried (SD), PHGG:Man and PHGG:Man:INH microparticles. ...34
Figure 4.6 – X-ray diffraction patterns of rifabutin (RFB) in pure state and spray-dried (SD), PHGG spray-dried (SD), PHGG:RFB and PHGG:INH:RFB microparticles. ...35
Index of tables
Table 1.1 – Tuberculosis diagnostic methods in use, recently approved by WHO. ...8 Table 3.1 – Spray-drying parameters for the production of PHGG-based microparticles (air flow set at 400 Nl/h). ...17 Table 4.1 – Aerodynamic characteristics of dry powders (Feret’s diameter, bulk, tap and real densities, theoretical aerodynamic diameter and Carr’s index). (Mean ± Standard deviation, n = 3). ...29 Table 4.2 – Drug association efficiency (AE) and microparticle loading capacity (LC) of PHGG-based microparticles (Mean ± Standard deviation, n = 3). ...36 Table 4.3 – Viability (%) of M. smegmatis exposed to different concentrations (16-0.25 μg/mL) of MPs with INH, RFB (0.8-0.025 μg/mL), and both drugs INH and RFB (2-0.015 μg/mL) as determined by the MTT test. Data represent mean Standard deviation of three replicates per 2 wells (n = 6). ...49 Table 4.4 – Viability (%) of M. bovis exposed to differentconcentrations (1-0.015 μg/mL) of MPs with INH, and with RFB (1-0.015 μg/mL), determined by the MTT assay. Data represent Mean
Abbreviations list
A549 cell line – Adenocarcinomic human alveolar basal epithelial cell line Abs – Absorbance
AE – Association efficiency AG – Arabinogactan
AIDS – Immunodeficiency syndrome AM – Alveolar macrophage
ANOVA – Analysis of variance
ATTC – American Type Culture Collection BCG – Bacillus Calmette-Guérin
Ca 2+ – Calcium
Calu-3 cell line – Adenocarcinomic human bronchial epithelial cell line CM – Culture medium
CO2 – Carbon dioxide
CRX – Chest radiography with X-rays CuKα – Potassium calcium alpha
CYP4A4 – Cytochrome involved in human liver metabolism dae – Aerodynamic diameter
DMEM –Dulbecco’s modified eagle medium
DOTS – Observed treatment and short-course drug therapy EDTA – Ethylenediamine tetraacetic acid
EMB – Ethambutol FBS – Fetal bovine serum
GRAS – Generally recognized as safe HCl – Hydrochloric acid
HIV – Human immunodeficiency virus IL – Interleukin
INH – Isoniazid
INT – Iodonitrotetrazolium LAM – Lipoarabinomannan LC – Loading Capacity
LDH – Lactate dehydrogenase enzyme M – Medium
M7H9 –Middlebrook’s 7H9 broth base MA – Mycolic acid
Man – Mannitol
ManLAMs – Lipoarabinomannan capped with mannose residues MDR – Multidrug resistance tuberculosis
MIC – Minimum inhibitory concentration MTB –Mycobacterium tuberculosis MOI – Multiplicity of infection MPs – Microparticles
MTBC –Mycobacterium tuberculosis Complex
MTT – 3-(4,5-Dimethylthiazol-2-yl)-2,5-diphenyltetrazolium salt NAD(P)H – Reduced nicotinamide adenine dinucleotide (phosphate) NAAT – Automated nucleic acid amplification test
Ni – Nickel
NK cells – Natural killer cells
OD – Optical density
PBS – Phosphate-buffered saline PG – Peptidoglycan
PHGG – Partially hydrolyzed guar gum
PILAM – Lipoarabinomannan capped with phosphoinositol PIM – Phosphatidylinositol mannoside
PMA – Phorbol myristate acetate PZA – Pyrazinamide
RIF – Rifampicin RFB – Rifabutin
RPMI – Roswell Park Memorial Institute medium S – SDS 2%
SD – Spray-dried
SDS – Sodium dodecyl sulfate SEM – Standart error of the mean TB – Tuberculosis
THP-1 cell line – Human monocytic cell line UV-Vis – Ultraviolet visible spectroscopy
XDR-TB – Extensively drug-resistant tuberculosis XRD – X-rays diffraction
Chapter I - Introduction
1.1.
Historical perspective and epidemiology of tuberculosis
Tuberculosis (TB) is an infectious disease caused by Mycobacterium tuberculosis (MTB). It has been reported since the ancient Greco-Roman and Egyptian civilizations, for about 3.000 years BC [1, 2]. The disease was initially reported as consumption or phthisis, which means decline. Laennec, the inventor of the stethoscope, discovered that tubercles, characteristic lesions found in the lungs, were also found in other locations, such as the spine and lymph glands. Therefore, he realized that this disease occurred throughout the body. Curiously he died of tuberculosis after publishing his research [3].
Although MTB had been always present, it was regarded as an unimportant pathogen to man, until a tuberculosis epidemic was unleashed in result of urbanization and industrialization around the globe [2, 3]. Known as the “great white plague”, TB was the main death cause in Europe and in United States of America, in the mid-1700’s and 1800’s [1, 2]. In 1882, Robert Koch, a German physician presented his research on the tubercle bacillus, which turned out to be crucial in the understanding of the most significant infectious disease of the period. Later on, in 1905, his work on tuberculosis earned him a Nobel Prize [3, 4].
With the establishment of the World Health Organization (WHO), tuberculosis was recognized as a top priority. Therefore, as an effort towards its control, the Bacillus Calmette-Guérin (BCG) vaccine and antibiotic drugs were developed. The vaccine is based on the attenuated virulence of M.bovis and still remains one of the most used worldwide.
Another important mark was the discovery of streptomycin by Waksman and Schatz, but the antibiotic quickly showed several problems concerning its price, side effects and the developed resistance. Cheaper synthetic compounds like aminosalicylic acid and isoniazid (INH) were produced, but one major problem remained, as the treatment required the hospitalization for 12 to 18 months. The evolution of therapy has dictated a reduction in the treatment period to six months, making patient compliance less complicated, but still not satisfactory [1, 3].
Nowadays, TB remains a major global health burden, continuously spreading and infecting millions of people each year [5, 6]. TB is considered the second most deadly infectious disease worldwide, after the human immunodeficiency virus (HIV). In 2013 the reports estimated that there were 9.0 million new TB cases and 1.5 million TB deaths (0.4 million among HIV positive people).
Figure 1.1 – Estimated co-infected TB with HIV cases all over the world. Reprinted from: WHO, WorldHeal. Organ., 2014 [7].
The current epidemic is being maintained and sustained in the presence of immunosuppressive conditions like diabetes, alcoholism, malnutrition, chronic lung disease and HIV [5, 8]. It is well established that the immune system is compromised by HIV infection, which will predispose for the development of TB. As result of HIV infection, CD4+ T-lymphocytes decrease, leading consequently to the acquired immunodeficiency syndrome (AIDS). Therefore, the risk of acquiring TB in a compromised individual is 30%. In contrast, a healthy individual has only a 3% probability of contracting TB. The infection caused by MTB was reported as being the most lethal and opportunist pathogenesiswhen is found in a synergic co-infection with HIV [4].
1.2.
Pathogenesis of tuberculosis
TB is a respiratory contagious bacterial infection, occurring when an uninfected person inhales an infected droplet which was produced from an individual with active TB [5, 6]. The content of this droplet then deposits at the terminal airways or pulmonary alveolus [2, 5, 11, 12]. The infecting mycobacteria colonize primarily the lungs (pulmonary TB), but they can disseminate to extra-pulmonary areas of the organism, mainly the circulatory and nervous systems [5, 9]. The resulting symptoms of pulmonary TB are chronic bloody coughs, night sweats and weight loss. Extra-pulmonary TB can manifest as pericarditis, meningitis, or spinal TB [12].
receptors, or through recognition of mannose residues, specifically mannose-capped lipoarabinomannan (LAM) through mannose receptors. This route will direct the bacteria to the phagosome, leading to its arrest [13]. The infected cells release pro-inflammatory cytokines leading to the recruitment of mononuclear cells. After this event, the antigens are presented to specific T-lymphocytes which become activated as well. Cytokines IL-12 and IL-18 are secreted from infected cells and induce Natural Killer (NK) cell activity; thereby NK cells produce Interferon-γ leading to the activation of other macrophages, which results in the production of tumor necrosis factor-α [10, 11]. In a posterior phase, macrophages, lymphocytes and extracellular matrix proteins surround the infected macrophages in a structure called granuloma [12]. Within this structure MTB can be contained, leading to the formation of another structure called tubercle, resulting in latent TB infection, characterized by the permanence of the pathogen in a dormant state at the arrested site, for indefinite time. However, if the host immune system is compromised, the above described response is not adequate and the pathogen will systematically multiply, resulting in reactivated TB [11, 12, 14]. The final outcome is thus fully dependent on the immunological response given by the affected individual [12, 14].
Figure 1.2 – Schematic diagram of the events occurring on macrophages infected with MTB. In 90-95% of the cases the disease stays arrested in the latent form, which is asymptomatic. In 5-10% of cases, MTB replicates inside the macrophage and the disease stays active, developing typical symptoms.
Reprinted from: Yuk and Jo, Clin. Exp. Vaccine Res., 2014 [15].
1.3.
Mycobacterium spp
.
M. microti, M. pinnipedii, M. caprae and M.cannetti [1, 11]. Kazda [17] classified mycobacteria from a pathogenic point of view, into three groups: strictly pathogenic, potentially pathogenic and rarely pathogenic or saprophytic. All MTBC members are strictly pathogens, causing tuberculosis, and are closely similar from a genetic point of view. For example, the genome of MTB shows only <0.05% difference with M. bovis [11, 12].
MTB are rod-shaped mycobacteria with a length of 1-4 μm and about 0.5 μm of diameter. They are classified as Gram positive, although poorly staining crystal violet. The complex cell wall composition gives resistance to decolourisation by acid during staining procedures. For this reason they are termed acid fast bacilli [17]. MTB is an intracellular pathogen that survives inside the phagosomes of macrophages preventing their maturation to phagolysosomes. It is a strict aerobic and replicates very slowly, with a doubling time roughly 24 hours [1, 10, 17]. The distinction between fast and slow growing species is determined based on whether a visible colony grows in less or more than seven days [1].
The knowledge and understanding achieved on survival mechanisms used by mycobacteria inside the organism cells might be useful for the elimination of these pathogens. The research assays made in this thesis involve two important strains that belong to the Mycobacterium genus, M. bovis and M. smegmatis, which characteristics are detailed below.
1.3.1.
Mycobacterium bovis
M. bovis comprises slow-growing mycobacteria that have a doubling time of 18-20 hours. The slow growing is mainly related with the complexity of the cell wall and the high nutritional demands [18]. M. bovis is the main responsible pathogen in livestock and wild animals, causing bovine tuberculosis. This might contaminate humans as well, causing a type of tuberculosis that is indistinguishable from the one caused by M. tuberculosis [11, 19]. The contamination of humans has been usually mediated by ingestion of non-pasteurized cow’s milk [9].
BCG became an attenuated strain of M. bovis and was first administered to humans as a vaccine in 1921. It contains posterior deletions with the loss of a 10 Kb region of deletion 1 from the DNA, that has the gene ESAT-6, thus resulting in an attenuation of its virulence [1, 11]. BCG is the most used vaccine worldwide, presenting advantages, such as low production cost, safety and stability, long immunization protection provided by a single dose and possibility of administration to newborns [20].
1.3.2.
Mycobacterium
smegmatis
M. smegmatis was isolated for the first time by Alvarez and Travel, in 1885 [20]. This is a fast-growing strain, which has a doubling time of 4-6 hours, but besides this different characteristic, it shows some similar features with the pathogenic M. tuberculosis [11, 21].
The essential difference between non-pathogenic and pathogenic strains is that during phagocytosis, the non-pathogenic strain gets rapidly destroyed by proteases from the resulting arrest in phagosomes of infected host; while the expressed antigens are quickly absorbed, inducing a strong immune response [20]. Although M. smegmatis is widely considered to be non-pathogenic, some data report that it behaves as a pathogen capable of manipulating the system [22].
1.3.3. Mycobacterial cell wall
The mycobacterial cell wall has unique characteristics and some of its components are responsible for the inherent resistance to several drugs. Mycolic acid is responsible for conferring resistance to the previously mentioned alcohol-acid decolourisation, as well as to chemical agents and antibiotics [17]. Figure 1.3 illustrates the composition of MTB cell wall, where long chains of fatty acids defined as mycolic acids are linked to arabinogalactan, which is covalently linked to the peptidoglycan, forming the MA-AG-PG complex. This complex is insoluble and considered an important core of the mycobacterial cell wall [4, 22]. PG is constituted of alternating units of N-acetyl glucosamine and a N-glycolylated muramic acid [4]. Lipoarabinomannan (LAM) and phosphatidylinositol mannoside (PIM), a biosynthetic precursor of LAM, are lipoglycans non-covalently attached to the cell wall through their glycosylphosphatidylinositol anchors [10, 22].
Figure 1.3 – Representative scheme of M. tuberculosis cell wall structure. The figure shows the major components of the cell wall and their distribution. Schematic complex MA-AG-PG, mannose-capped glycoproteins, lipomannan and mannoglycoproteins are displayed.
Reprinted from: J. Kleinnijenhuis et al, Clin. Dev. Immunol, 2011 [24].
Both phosphatidylinositol derivatives PIM and LAM resemble typical mammalian phospahtidylinositol, which generate membrane traffic-regulating species. PIM has an inositol ring glycosylated with mannose; its role is to stimulate the fusion between phagosomes and early endosomes [25]. LAM acts as a virulence factor of MTB, being responsible for the phagosome maturation arrest, inhibiting the increase of cytosolic [Ca2+]. This blocks the
avoids reactive species of oxygen and reactive nitrogen intermediates to act through antimicrobial mechanisms, and inhibits several transduction cascades regulated by protein kinase C [4, 10]. In slow-growing pathogenic mycobacteria, such as MTB, these LAMs are capped with mannose residues and are denominated as ManLAMs, whereas fast-growing such as M. smegmatis, have phosphoinositol-capped LAMs referred as PILAMs [10, 22].
These phosphatidylinositols display several immunomodulatory proprieties by interaction with several receptors of the immune system. PIMs and ManLAMs are recognized by C-type lectins and the macrophage mannose receptors [27].
1.4.
Diagnosis and treatment of tuberculosis
Diagnostic methods for TB include chest radiography (CRX), sputum smear microscopy, tuberculin skin test, interferon-γ release assay, line probe assay and automated nucleic acid amplification tests (NAATs), among others [10, 25]. CRX is useful to detect the presence of fibrous scarring of the lung parenchyma, and other pulmonary lesions, indicating if tuberculosis is already established and/or active. Computed tomography is an additional imaging modality to study TB, useful after an inconclusive CRX screening [29]. The nucleic acid amplification tests (NAATs) are based on amplifying regions specific to the MTBC.
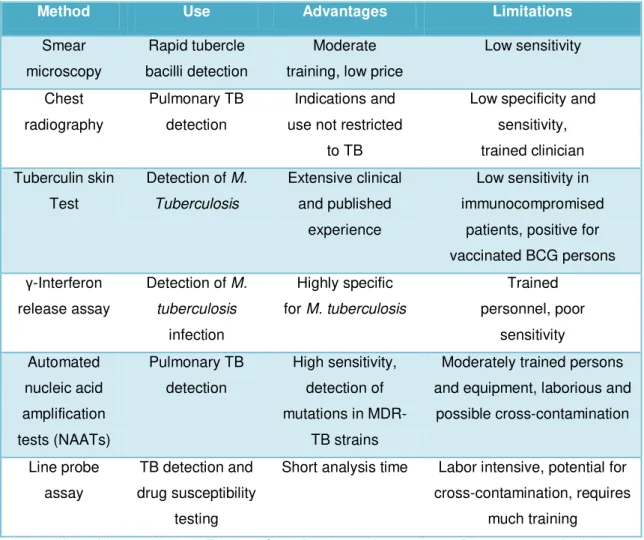
Table 1.1 – Tuberculosis diagnostic methods in use, recently approved by WHO.
Method Use Advantages Limitations
Smear microscopy
Rapid tubercle bacilli detection
Moderate training, low price
Low sensitivity Chest radiography Pulmonary TB detection Indications and use not restricted
to TB
Low specificity and sensitivity, trained clinician Tuberculin skin
Test
Detection of M. Tuberculosis
Extensive clinical and published
experience
Low sensitivity in immunocompromised
patients, positive for vaccinated BCG persons γ-Interferon
release assay
Detection of M. tuberculosis
infection
Highly specific for M. tuberculosis
Trained personnel, poor sensitivity Automated nucleic acid amplification tests (NAATs) Pulmonary TB detection High sensitivity, detection of mutations in
MDR-TB strains
Moderately trained persons and equipment, laborious and
possible cross-contamination
Line probe assay
TB detection and drug susceptibility
testing
Short analysis time Labor intensive, potential for cross-contamination, requires
much training Adapted from: Kanwar, Underst. Tuberc. - Glob. Exp. Innov. Approaches to Diagnosis, 2012 [28].
The conventional therapeutic approach of tuberculosis is based on oral antibiotherapy. WHO recommends an oral co-administration regimen of four first-line antibiotics: isoniazid (INH), rifampicin (RIF), ethambutol (EMB) and pyrazinamide (PZA). Monotherapy is not recommended for TB. Instead, a correct drug association, in adequate doses during the time prescribed is a standard measure to avoid bacterial persistence and resistance to antibiotics [27, 28].
Antibiotherapy is administered by Directly Observed Treatment and Short-course drug therapy (DOTS) programs, which ensures compliance on the patience’s behalf through their observation [12]. During the initial 2 months the four first-line antibiotics are prescribed, being then reduced to RIF (600 mg or 450 mg daily) and INH (300 mg daily) [4] for the following 4 months. A long prescription is normally associated with compliance issues, and may lead to serious secondary toxic effects provoked by several of these antibiotics. For instance, INH induces hepatotoxicity in humans, which is potentiated when co-administrated with RIF, due to a bigger induction of CYP450 enzymes, and overproduction of toxic hydrazine metabolite [32].
gene mutations [4]. It is reported that more than 3% of TB patients worldwide are resistant to two of the major first-line anti-TB drugs, INH and RIF, condition referred as multidrug resistance (MDR-TB). About 9% of MDR-TB cases can also show resistance to second-line anti-TB drugs, a condition called extensively drug-resistant TB (XDR-TB). When these conditions are observed, the implemented therapeutic protocols differ from the conventional one, requiring instead at least five drugs which are less strong, showing higher toxicity and being more expensive [3, 30].
1.5.
Antitubercular drugs
TB can be effectively treated with the use of first-line drugs, INH, RIF and derivatives such as rifabutin and rifapentin, PZA, EMB and streptomycin. However, this therapy can fail for several reasons. As previously mentioned, the emergence of drug resistant mycobacteria is one crucial challenge regarding tuberculosis therapy, demanding the use of second-line antitubercular drugs (fluoroquinolones, aminoglycosides, cycloserines and ethionamides/prothionamides) [34]. In this thesis two first-line drugs were used, INH and rifabutin. Their main characteristics are described below.
1.5.1. Isoniazid (INH)
INH, which chemically is pyridine-4-caboxylic acid hydrazide (Figure 1.4), is denoted with the formula C6H7N3O. It has a molecular weight of 137.14 g/mol and is highly soluble in water (125
mg/mL) [31]. This antitubercular agent is a hydrophilic pro-drug that is activated by the gene katG, encoding the catalase peroxidase enzyme which causes a lethal effect on intracellular pathogens. INH is only active against growing tubercle bacilli. Activated INH inhibits the synthesis of mycolic acids by inhibition of NADH-dependent enoyl-acyl carrier protein reductase encoded by the gene inhA [34].
Figure 1.4 – Chemical structure of isoniazid.
bacilli. Ser315Thr is the most common mutation, leading to the inactivation of catalase peroxidase enzyme. A high INH resistance has been observed in other mycobacterium strains, such as M.smegmatis and M.bovis, with MIC values ranging between 0.2 and 256 μg/mL. This high resistance values are mainly explained by katG mutations [32, 33]. InhA mutations are less frequent than katG mutations, often resulting in low-level resistance (MIC 0.2-1 μg/mL). If for instance, a resistant strain harbors both mutations, this will result in a synergetic outcome and higher levels of INH resistance. AhpC gene codes for an alkyl hydroperoxidase reductase, implying protection against reactive oxygen and nitrogen intermediates, avoiding the antimicrobial action due to the interruption of the defense macrophage mechanism [34].
1.5.2. Rifabutin (RFB)
Rifamycins (rifampicin, RFB and rifapentin) belong to the same family, represented by their unique molecular architecture composed by aromatic groups linked by aliphatic chains in non-adjacent positions. Figure 1.5 represents the specific chemical structure of RFB [36].
Figure 1.5 – Chemical structure of rifabutin.
RFB, has the molecular formula of C46H62N4O11, a molecular weight of 847.005 g/mol and is
model suggest additional advantages of RFB over RIF, such as minimal induction of CYP3A4/5 and a fast eradication of MTB infection [31]. The only valid disadvantage regarding the use of RFB over RIF is its higher cost [39].
RFB’s MIC for MTB susceptible strains is around 0.004 μg/mL, while resistant strains having resistance mutations in gene rpoB, show MIC values varying between 0.25 and 16 μg/mL, depending on the mutation [40].
1.6.
Pulmonary drug delivery
As mentioned above, the conventional treatment of TB usually involves systemic delivery of antitubercular drugs through the oral route. The major disadvantages related with this conventional approach are the undesirable side effects and toxicity associated to the administered doses. Taking into account that TB is an airborne infection, with a great accumulation of mycobacteria in the lung alveoli and, particularly, in the alveolar macrophages, pulmonary drug delivery could represent a great alternative to reach effective drug concentrations in the alveolar macrophages. With this strategy, lower doses could be administered, as the drugs would be co-localized with the infecting agents [38–40]. This would possibly reduce dose frequency and the duration of treatment, lowering the systemic toxicity, and ultimately improving patient compliance [15, 40].
Figure 1.6 –Lung particle deposition pattern according to particle size. Adapted from: Patton and Byron, Nature Reviews Drug Discovery, 2007 [46].
Although pulmonary drug delivery has been referred very frequently in the ambit of the design of therapeutic approaches for systemic diseases, this route is considered the most appropriate route for the treatment of pulmonary diseases like asthma and chronic obstructive pulmonary disease, and a very promising alternative in the case of lung cancer and tuberculosis [42].
1.7.
Polymeric microparticles of partially hydrolyzed guar gum
pharmaceutical field their application is mainly dedicated to tablet production and stabilization of processes [44, 45].
Guar gum is a natural water soluble, nonionic polysaccharide extracted from the endosperm of guar beans of Cyamopsis tetragonolobus, a leguminous plant cultivated essentially in India and Pakistan. Chemically, guar gum belongs to the galactomannan family, showing the structure that is represented in Figure 1.7 [47, 48]. FDA has approved gum guar for secure human usage, being normally utilized as a dietary fiber, thickener in lotions and creams, tablet binder, emulsion stabilizer and also as a controlled release polymer, due to its high hydration rate. Guar gum is constituted by long chains of α-D-mannopyranosyl units linked together by β -D-(1-4)-glycosidic linkage. Side groups of α-D-galactopyranose appear linked to the main mannose chain, in a ratio of mannose to galactose of approximately 2:1. The molecular weight of guar gum is estimated to be around 200.000 to 300.000 daltons [52].
Figure 1.7 – Chemical structure of guar gum.
Due to its high molecular weight and ability to incorporate water, guar gum forms very viscous solutions that impose various limitations in the processing and application of the molecule. There is a commercial variant consisting of partially hydrolyzed guar gum (PHGG), which is produced by partial hydrolysis with β-endo-mannanase or pectinase, which presents lower molecular weight (with an average of 20.000 daltons) and, consequently, viscosity [53]. The whole process of hydrolysis is described on a representative scheme below (Figure 1.8).
Figure 1.8 – Manufacture scheme of PHGG, step by step. Adapted from: Yoon et al, J Clin Biochem Nutr, 2008 [52].
Microencapsulation might be processed by a variety of physical and chemical methods,
Guar Bean Enzymatic
Hydrolysis
Separation and Purification
properties of the carriers [50]. Spray-drying is considered a mild technique and is one of the most used, particularly regarding applications in inhalation. It permits the control of microparticle properties (i.e. size, density and shape) depending on the operating conditions. Additionally, it offers rapid processing and is a continuous and one step process, which guarantees simplicity and cost effectiveness. The process consists firstly on the entrance of a drying gas (air, nitrogen) at the top of the spray-dryer apparatus (Figure 1.9), where it is heated to a previously set temperature. The gas interacts with the liquid formulation being simultaneously introduced in the nozzle of the equipment, resulting in the formation of a spray. The high temperature induces the evaporation of the liquid of each formed droplet, thus only remaining the solid content of each of the droplets, which corresponds to the microparticles. These are separated by a cyclonic separator and accumulate in the collecting vessel, from which they are collected at the end of the process, using a rubber and/or metallic spatula [50, 51].
Figure 1.9 – Diagram of spray-drying method. Aqueous solution is fed through Büchi B-290 Mini Spray Dryer, where the solvent is evaporated, and spray-dried powder (microparticles) is collected at the end of the process.
In some cases, spray-dried formulations include excipients such as mannitol (Figure 1.10), lactose or leucine, which are included to modulate the stability, drug release or flowing properties of the resulting powders [50].
Chapter II
–
Aims
2.1. Main aim
To evaluate PHGG microparticles as carriers of antitubercular drugs for delivery via inhalation.
2.2. Partial aims
To evaluate the crystallinity pattern of PHGG microparticles containing antitubercular drugs;
To determine drug association efficiency and drug release profiles;
To evaluate the cytotoxic behaviour of drug-loaded PHGG microparticles in relevant cell lines (A549, Calu-3 and differentiated THP-1 cells) for the objective of pulmonary delivery in the ambit of tuberculosis therapy;
To determine the minimum inhibitory concentrations of drug-loaded microparticles in relevant bacterial strains for the aim of tuberculosis therapy (M. bovis and M. smegmatis);
Chapter III - Materials and Methods
3.1. Microparticle preparation
Microparticles based on partially hydrolyzed guar gum (PHGG, Taiyo Kagaku, Japan) were prepared from solutions of the polymer at a concentration of 2% (w/v). A formulation of PHGG microparticles containing mannitol (Man, Sigma-Aldrich, Germany) was also prepared. In that case, a solution of PHGG at 2% (w/v) was prepared and mannitol dissolved directly in this solution to a final concentration of 0.5% (w/v).
Isoniazid (INH, Sigma-Aldrich, Germany) and rifabutin (RFB, Chemos GmbH, Germany) were the antitubercular drugs associated to the microparticles, either individually or in association. Microparticles containing INH were prepared using a matrix of PHGG:Man (PHGG at 2% and mannitol at 0.5% as described before). All other formulations, either containing rifabutin or the association of both drugs, were prepared in a matrix of PHGG only. In summary, 5 formulations were prepared, with the denominations described as follows (in parenthesis is indicated the mass ratio between materials): PHGG; PHGG:Man (10:2.5); PHGG:Man:INH (10:2.5:1); PHGG:RFB (10:1); PHGG:INH:RFB (10:1:1). In all cases, the final volume of the aqueous solution prepared for spray-drying was 30 mL. Both drugs required grinding in a mortar prior to solubilization in Milli-Q water. In the case of RFB, it was further needed to add HCl to obtain a clear solution. Briefly, in the case of INH-loaded microparticles (no RFB present), PHGG was solubilized in water at a concentration of 2% (w/v). Mannitol was then solubilized directly into this solution to a final concentration of 0.5 % (w/v). In parallel, INH was grinded in a porcelain mortar and then solubilized in water. The obtained INH solution was then added to the previous solution of PHGG:Man, and left under stiriring (Velp Scientifics, Italy) for 20 minutes. INH was added to have a final concentration of 10% with respect to the polymer, thus representing a polymer/drug ratio of 10:1 (w/w). For RFB-loaded microparticles, PHGG 2% (w/v) and RFB were simultaneously grinded in a glass mortar and then solubilized in Milli-Q water. In order to achieve an optimum dispersion in the presence of an hydrophobic drug such as RFB, the addition of HCl (Sigma-Aldrich, Germany) proved to be useful, as it protonates the drug. HCl was used at the concentration of 0.001 M and a satisfactory dispersion was obtained with 1.4 mL. The resulting solution was left under stirring for 40 minutes. RFB was added to obtain a final concentration of 10% with respect to the polymer, also representing a polymer/drug ratio of 10:1 (w/w). Finally, in the case of the formulation containing both drugs, PHGG 2% (w/v) and RFB were grinded simultaneously in a glass mortar, whereas the same amount of HCl 0.001 M was added. Another solution, with INH, was prepared separately as described above. Both solutions were mixed under stirring for 40 minutes. The final polymer/drug ratio for PHGG:INH:RFB microparticles was 10:1:1 (w/w).
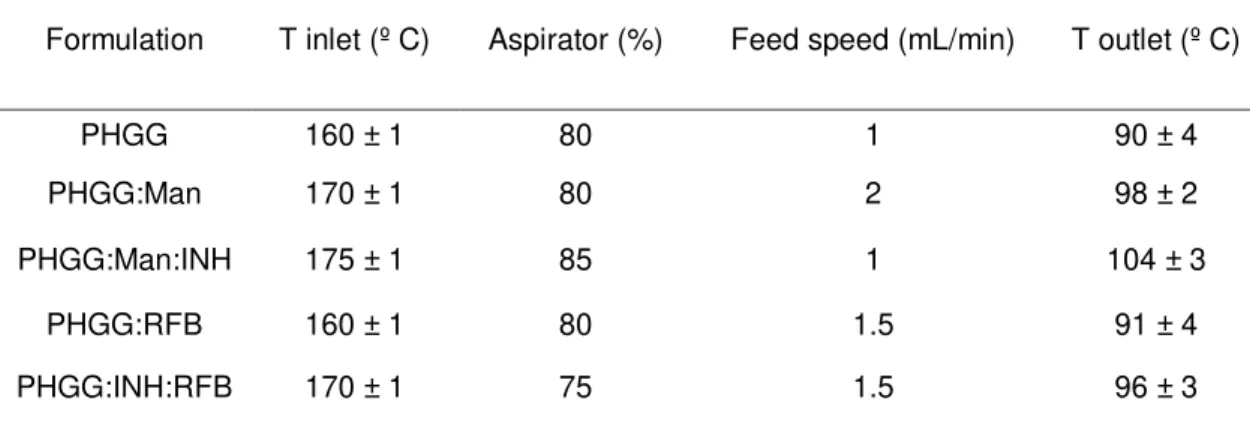
with compressed air used for the evaporation of the solvent of the aqueous solution. The parameters for the spray-drying of PHGG to obtain the MPs with the desired characteristics for deep lung delivery were previously optimized by Ana Grenha’s team and are shown in Table 3.1.
Table 3.1 – Spray-drying parameters for the production of PHGG-based microparticles (air flow set at 400 Nl/h).
Formulation T inlet (º C) Aspirator (%) Feed speed (mL/min) T outlet (º C)
PHGG 160 ± 1 80 1 90 ± 4
PHGG:Man 170 ± 1 80 2 98 ± 2
PHGG:Man:INH 175 ± 1 85 1 104 ± 3
PHGG:RFB 160 ± 1 80 1.5 91 ± 4
PHGG:INH:RFB 170 ± 1 75 1.5 96 ± 3
The production of each formulation was repeated in triplicate (n = 3). All dry powders were stored in desiccators until further use. The aqueous solutions and the resulting dry powders loaded with drugs were protected from light in every step of manipulation and storage.
3.2. Microparticle characterization
Microparticle surface morphology was characterized by field emission scanning electron microscopy (FESEM, Ultra Plus, Zeiss, Germany). Production yield of the process was calculated based on the comparison of total solids weight with the resultant powder weight after spray drying, through the following equation:
aerodynamic diameter was calculated using the values of real density and Feret’s diameter, through the following formula:
(Eq.2) Where dae represents aerodynamic diameter; dg is the geometric diameter (Feret’s diameter), ρreal is the real density and χ represents the shape factor of MP (1 for spherical microparticles; 2
for irregular microparticles). Carr’s Index is a parameter that measures the microparticles flowability. It derives from bulk density and tapped density data and values lower than 25% indicate an optimum flowing pattern, between 20-30% still indicates good powder flow properties [56, 57]. The Carr’s index was calculated based on the following formula:
(Eq.3)
3.3. Determination of powder cristallinity
The crystalline pattern of the original polymer (PHGG), pure drugs INH and RFB, and spray-dried microspheres was assessed by Powder X-ray diffraction. All the produced microparticle formulations, as referred in section 3.1., were analyzed. A representative replicate of each formulation was analyzed with a PANalytical X’Pert Pro diffractometer using CuKα radiation filtered by Ni and an X’Celerator detector. The patterns were obtained by reflection mode from 5º to 70º 2θ, at a step rate of 0.05º and 1500 seconds per step, with the diffractometer operating at 45 kV and 35 mA.
3.4. Drug association efficiency and loading capacity
(Eq. 4) The drug loading capacity (LC) was calculated as the recovered drug mass (real amount) as a function of MPs weight:
(Eq. 5)
3.5.
In vitro
drug release profile
The drug release profile of each formulation was determined in a medium representative of the lung lining fluid. This medium is composed of Phosphate Buffered Saline (PBS, VWR, USA) pH 7.4, thus representing the local pH of the lung, added of 1% (v/v) Tween 80 (Merck, USA), which represents the lung surfactant. The assays were conducted respecting sink conditions. An amount of 15 mg of PHGG:RFB and PHGG:INH:RFB microparticles were incubated in 10 mL of release medium and placed under stirring (100 rpm) at 37 ºC. At pre-established time intervals from 5 to 90 minutes, samples were collected, filtered (0.45 μm) and drugs quantified by UV-Vis, as described above. Adequate calibration curves were established. The assays were performed in triplicate.
3.6. Cell Lines
Cell lines representative of the lung epithelia were used. A549 cells (American Type Culture Collection – ATCC CCL-185, USA), representative of alveolar epithelium, were used between passages 35-45; and Calu-3 cells (ATCC HTB-55, USA), representative of bronchial epithelia were used between passages 20-31. THP-1 cells (DSMZ, ACC 16, Germany), a human monocytic cell line, were used between passages 12-22. Both A549 and Calu-3 cells were cultured in DMEM (Sigma-Aldrich, Germany), supplemented with 10% (v/v) Fetal bovine serum (FBS, Gibco, USA), 1% (v/v) non-essential aminoacids (Gibco, UK), 1% (v/v) L-glutamine 200 mM (Gibco, UK) and 1% (v/v) penicillin/streptomycin (VWR, Germany). THP-1 cell line was cultured in RPMI 1640 medium (VWR, Belgium), supplemented with 10% (v/v) FBS, 1% (v/v) L-glutamine 200mM and 1% (v/v) penicillin/streptomycin.
THP-1 cells remain in suspension, and were into macrophage-like cells upon a specific treatment. This consisted in adding 50 nM phorbol myristate acetate (PMA, Sigma-Aldrich, Germany) into the medium during 48 hours, followed by a period of 24 hours incubation in cell culture medium without PMA.
3.7. Evaluation of microparticle cytotoxicity
The cytotoxicity of microparticles was assessed on the cell lines mentioned above. The cytotoxic profile was evaluated using two different techniques, the 3-(4,5-dimethylthiazol-2-yl)-2,5-diphenyltetrazolium bromide (MTT, VWR, USA) assay and the determination of released lactate dehydrogenase (LDH). The MTT assay is based on the formation of formazan by the reduction of the tetrazolium salts by mitochondrial reductases present on metabolic active cells dependent of NAD(P)H, as is shown in Figure 3.1. The amount of formed formazan reflects the number of viable cells. Therefore, low cell viability results on a minor spectrophotometric signal.
Figure 3.1 – Basic principle of the MTT assay. Yellow tetrazolium salt is reduced by mitochondrial reductases into dark red/purple formazan.
Adapted from: Liu and Nair, J. Nat. Prod., 2010 [58].
promote a better dissolution. In that case, 96-well plates were read at 570 nm (background correction at 650 nm).
The following formula was used to determine the cell viability:
(Eq.6) Where Abs stands for absorbance of the test substance, CM is the absorbance upon incubation with culture medium, and S the absorbance for negative control SDS 2%.
The LDH assay is a procedure to measure either the number of cells via total cytoplasmatic LDH or membrane integrity as a function of the amount of cytoplasmic LDH released into the medium. LDH catalyzes the conversion of lactate to pyruvate, based on the reduction of NAD+ to NADH. Then diaphorase uses NADH to reduce iodonitrotetrazolium (INT) to a red formazan product (Figure 3.2). The resulting colored compound is measured spectrophotometrically. The greater the loss of integrity, the greater will be the read absorbance (reflecting higher amount of released LDH).
Figure 3.2 – Basic metabolic reaction occuring in LDH assay. Reprinted from: www.lifetechnologies.com
The formulations were generally tested at the concentration of 1mg/mL, although those containing rifabutin as sole drug and incorporated in formulations, were also tested at the concentration of 0.5 mg/mL. The same set of experiments used for the MTT assay (which directly used the cells for the assay procedure) was used for the LDH assay, in this case analyzing the supernatant of cells upon incubation with samples. A specific kit was used to perform the assay (LDH kit, Sigma-Aldrich, USA). CM and a lysis buffer provided in the kit were tested for the released LDH as controls, and a non-cytotoxic effect is described for a value until 100%. The value obtained for CM is considered 100% LDH and assumed as regular/normal LDH release.
Aliquots (100 μL) of cell supernatant samples were removed from the cell plates upon exposure to the formulations/drugs. The aliquots were placed into eppendorfs and centrifuged at 16.000 x
solution from the LDH kit) were added. After 20 minutes, the reaction was stopped with 15 μL of HCl 1.0M. The absorbance was measured by UV/Vis spectrophotometry, at 490 nm (background correction at 690 nm).
The % of released LDH was determined based on the formula:
(Eq. 7) Where Abs stands for absorbance corresponding to incubation with test samples and CM is that resulting from the incubation with culture medium.
3.8. Bacterial strains and growth conditions
The mycobacterial strains used were the M. smegmatis 4XR2 that was a gift from Professor Peter Andrew, Department of Infection, Immunity and Inflammation, at Leicester, UK; and the M. bovis BCG DSMZ 43990. Both strains were cultivated in Middlebrook 7H9 (M7H9) broth (Remel, Lenexa, USA) (users recommendation of 4.7 g per liter), supplemented with 10% OADC (oleic acid, albumin, dextrose and catalase) (Remel, Lenexa,USA). The addition of 0.5% (w/v) of aqueous kanamycin (0.005 mg/mL) (Fisher Scientific, China) and 0.2% (v/v) of glycerol (Sigma-Aldrich, Germany) was used for M. smegmatis growth. In fact, M. bovis does not degrade carbon sources like glycerol, so the medium for M. bovis was devoid of it [1]. The addition of 0.05 % of Tween80, allowed a better observation of growth of this strain.
Mycobacteria were manipulated observing safety rules, inside a laminar flux chamber (Bio48 Faster, Italy) to prevent infection. All the material in contact with the bacteria was sterilized by autoclave (Uniclave88, Portugal). The stocks of bacteria were conserved and stored inside an ultra-low temperature freezer -80 ºC (U725 Innova New Brunswick Scientific, USA).
M. smegmatis 4XR2 was grown at 37 ºC for 2 days in liquid medium (M7H9), then transferred to solid medium, M7H9 prepared with bacteriological agar type E (Biokar diagnostics, France) to ensure the purity of the colonies for 3 days. Then, it was again transferred to liquid medium to proceed with growth assays. The assays were conducted after achieving an optical density value (ODnm) of approximately 0.2., at 600 nm. The bacterial strain M. bovis was grown for 21
3.9. Minimal inhibitory concentration (MIC) determination
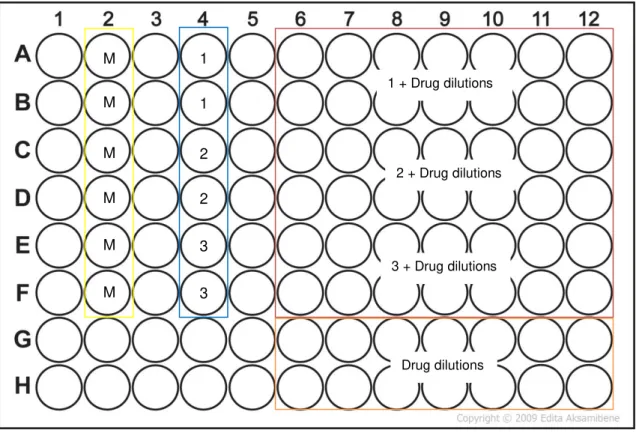
MIC is defined as the concentration of antimicrobial agent, such as an antibiotic, required to inhibit the bacterial growth [59]. Determination of antibiotic MIC plays an important role to measure their susceptibility to the drug. The MTT assay was adopted to quantify bacterial cell viability, as it is easily detected through colour change [60]. The INH (Sigma-Aldrich, Germany) stock solution was prepared at a concentration of 1 mg/mL in a solution of PBS. The RFB (Chemos GmbH, Germany) stock solution was prepared at the concentration of 1 mg/mL in a solution of DMSO. To guarantee sterility, the solutions were filtered with a disposable 0.22 μm sterile filter. When in association, a mixture of the antibiotics was dissolved in a 50:50 PBS:DMSO solution. Based on the calculations to achieve the desired concentrations, the stock solutions were then diluted in complete medium (M7H9). A solution of the higher drug(s) concentration was prepared in complete medium and 360 μL introduced directly in the designated wells of 96-well flat-bottom microplates (Orange Scientific, Belgium). Two-fold serial dilutions were continuously made using a multichannel pipette.
Figure 3.3 –The 96-well plate template in which column 2 had the medium (M) and column 4 the bacteria in triplicate, 1, 2 and 3 respectively. The columns 3-12 and rows A-F, contained the various drug dilutions with bacteria, and the rows G-H the drug dilutions in absence of the bacteria. The assay was done using 6 technical replicates (n=6).
The plates were covered, sealed with parafilm and incubated at 37 °C (Binder, USA). After 18 hours of incubation, 30 μL of MTT sterile solution were added to each well. A 6 hour period of incubation was allowed (completing 24 hours), after which 50 μL of DMSO were introduced into wells, resulting in a change of colour from yellow to dark gold for growing bacterial cells. Data was retrieved from the plate reader at 540 nm. Agar plates with solid media M7H9 were also used, in order to examine the recovery of viability. For this drops of 10 μL from the 96 well plates were transferred to the agar plates (before adding MTT). MICs were obtained based on these two methods. To test the MIC corresponding to MPs, the powders of each formulation were weighed into a test tube and sterilized by UV light, for 15 minutes. Then the samples were solubilised and the higher concentration was prepared in complete liquid medium M7H9 and added to the 96-well plates, based on the same protocol made for drug solutions. The established concentrations were on a range of 32 to 0.5 μg/mL (MPs with only INH), 0.8 to 0.025 μg/mL (MPs with only RFB), and 2 to 0.125 μg/mL (MPs with the association of drugs). The same process was carried out for M. bovis, but the outside lane (a frame-like) was all filled with fresh medium (or sterile water), thus avoiding the evaporation of liquid from the wells. The inside wells were used to proceed with the MIC determination. The established higher concentrations of individual drugs, drug association and MPs were established at 1 μg/mL and
M M
M
M
M
M
1
1
2
2
3
3
1 + Drug dilutions
2 + Drug dilutions
3 + Drug dilutions
diluted two-fold. After 7 days of incubation, MTT was added and 24 hours of incubation were allowed before adding DMSO in order to retrieve a reliable result.
3.10. Infection procedure
THP-1 human derived macrophage-like cells were cultivated in RPMI 1640 complete medium and incubated at 37 ºC in 5% of CO2, starting with a cellular density of 0.2x10⁶ cells/mL [60].
THP-1 cells were differentiated into macrophages with a treatment of 48 hours with 50 nM of PMA and left for an additional 24 hours in absence of PMA allowing the cell line to recover [61]. The resulting adherent host cells were counted for the 24 well plates (Orange Scientifics), where a procedure of 4 and 24 hours of infection took place. The cell medium was replaced with the bacterial growth medium.
In the case of M. smegmatis that forms clumps, a brief sonication of 5-10 minutes disaggregates them. An OD of 0.1 at 600 nm from the suspension corresponds to 1 x 10 7 bacteria per mL [62]. Based on this fact an estimated a multiplicity of infection (MOI) of 10 was achieved, obtaining the desired volume of bacteria to add into each well (approximately 100 μL in each well) [61, 62]. The cells were left in contact with the bacteria for 3 hours inside an appropriate incubator (Sanyo CO2 incubator MCO-18AIC, Japan) [56, 57]. The culture medium
was removed and the infected cells were washed three times with sterile PBS 1x, in order to remove the bacteria that were not captured by macrophages. The antibiotics and MPs were dissolved in bacterial medium at the MIC value previously determined for the formulation with both drugs. The solutions were added into the defined wells. The associated drugs and loaded MPs with INH and RFB were in contact with the infected macrophages, for 4 and 24 hours. The 24-well plates were divided into three groups, as presented in Figure 3.4.
Figure 3.4 – Scheme of the 24-well plate. Column 1: infected cells with M. smegmatis triplicates (1, 2 and 3); Columns 2 and 3: infected cells with associated drugs (INH and RFB), MIC =1 μg/mL. Columns 4, 5 and 6: infected cells with MPs loaded with both drugs, same MIC.
1
2
3
2 + Drugs 1 + Drugs
3 + Drugs
1 + MPs
2 + MPs
The lysis agent Triton X-100 (Ameresco, USA) was added (1 mL, 1:100) to each well after washing with PBS again, in order to lyse the cells but not the bacteria. The plate rested during 15 minutes, at room temperature. The suspension was mixed several times using an automatic pipette, 20 μL were taken from the suspension and added to 180 μL M7H9 on 96-well plates. Serial dilutions were made, passing 20 μL of the content. The dilutions ranged 10-1 – 10 -6. Drops of 10 μL were inoculated into agar plates and incubated at 37 ºC in a CO2 incubator to
allow the mycobacteria growth under these conditions, in order to observe the free drug effect and MPs effect against the mycobacteria. MTT procedure was performed on the 96-well plates, as described above, to determine bacterial viability. For counting the bacterial cells 10 μL of each dilution were inoculated into agar plates and incubated at 37 ºC. After 24-48 hours the colonies became visible and were counted with the help of a magnifier [62].
3.11. Statistical analysis
Chapter IV
–
Results and Discussion
4.1. Microparticle preparation and characterization
As stated in the methodology, several formulations of microparticles based on PHGG were produced aiming at an application as inhalable treatment of lung tuberculosis. The literature only refers the use of guar gum in pharma applications regarding the formulation of oral systems [50–52]. However, the majority of gum guar related works are devised to food applications. In this work, two model antitubercular drugs were associated (INH and RFB) with microparticles, which were produced with the required characteristics to enable inhalation. In this regard, considering that MTB is hosted by alveolar macrophages, the designed microparticles need to reach the alveolar zone, which requires good flowing properties.
The formulation comprising only PHGG was the only one not enabling adequate optimization, as the formation of large agglomerates could not be prevented by the combined modification of the parameters of the spray-dryer. In that case, poor flowing properties were macroscopically observed for the resultant dry powder, which was in line with the calculated Carr’s index, displayed in Table 4.1 (32 ± 6%). All other formulations had been previously optimized by Ana Grenha’s team, and were reproduced with success during this work. It was verified macroscopically that the presence of RFB improved the flowability of the dry powders (the Carr’s index of PHGG:RFB microparticles was the lowest, 26 ± 7%, while that of PHGG:INH:RFB microparticles was 31 ± 4%). Therefore, formulations containing this antibiotic could be developed comprising PHGG by itself as matrix material. On the contrary, as INH was not observed to induce the same effect on flowability, the formulation containing only INH (PHGG:Man:INH) had to be added of mannitol to achieve the desired flowing properties. Although the flowing ability of this formulation was satisfactory macroscopically, the relatively high Carr’s index value was 30 ± 5%. The inclusion of mannitol in order to improve flowing properties was previously reported in the literature and was also demonstrated in previous works of the group [50]. It is important to mention that, in spite of the obtained Carr’s index values above the recommended 25%, the flowability of the optimized microparticle formulations was considered reasonably good [56].
Figure 4.1 – FESEM microphotographs of different formulations of microparticles. A) PHGG, B) PHGG:Man, C) PHGG:Man:INH, D) PHGG:RFB, E) PHGG:INH:RFB.
In this figure, two kinds of morphology are perceptible. PHGG:Man MPs, displays a more spherical and smooth surface, while all the other formulations show various surface irregularities. PHGG MPs show a convoluted and irregular shape, which becomes more spherical when mannitol is added. This phenomenon is reported in other works where mannitol also produces spherical particles [65]. The surface of microparticles obtained by spray-drying pure INH has been reported to usually show corrugations [11]. However, PHGG MPs combining both INH and mannitol produced in this work, the surface has only a slight corrugated effect and the particles are almost spherical. Pure RFB also shows an irregular shape upon spray-drying, with rough surface [66]. The interaction of RFB with PHGG matrix in spray-drying was still resulting in microparticles with corrugated surface, as shown in this work. PHGG:INH:RFB microparticles show an even more corrugated morphology. This was expected based on the reports of irregular morphology for both antitubercular drugs upon spray-drying and because, in this formulation, mannitol is not present and it was seen to be the excipient improving the regularity of microparticles. Microparticles with a different matrix composition (polylactic acid), curiously described the same irregular surface when in presence of both associated drugs [31]. A corrugated morphology associated with low tap density (0.1 g/cm3) is reported to positively
A D
B E
C
1 μm
3 μm 5 μm
affect powder dispersibility by minimizing the contact areas, and also to lower the aerodynamic diameter, which is essential for an efficient pulmonary drug delivery [45].
The yield of the spray-drying process was calculated at the end of each process, reaching values considered very reasonable and in certain cases inclusive very good (68% - 85%). In fact, it is not very frequent to see in the literature such yield values, which is very relevant, because it means a low loss of materials and indicates the effectiveness of the technique. One of the reasons most likely contributing to this yield values was the use of the high performance cyclone, instead of the conventional cyclonic separator. This cyclone was already reported to improve the production yields [67].
Given the application in inhalation, the prepared formulations were characterized by their aerodynamic properties, which include the determination of the Feret’s diameter, tap and real densities, and aerodynamic diameter. The obtained results are shown in Table 4.1.
Table 4.1 – Aerodynamic characteristics of dry powders (Feret’s diameter, bulk, tap and real densities, theoretical aerodynamic diameter and Carr’s index). (Mean ± Standard deviation, n = 3).
Formulations
Feret’s
diameter (μm)
Bulk density (g/cm3)
Tap density (g/cm3)
Real density (g/cm3)
Aerodynamic diameter
(μm)
Carr’s
Index (%)
PHGG 1.60 ± 0.77 0.33 ± 0.04 0.50 ± 0.04 1.56 ± 0.08 1.41 ± 0.17* 32 ± 6
PHGG:Man 1.80 ± 0.99 0.32 ± 0.04 0.48 ± 0.02 1.54 ± 0.01 2.23 ± 0.04# 29 ± 7 PHGG:Man:INH 1.54 ± 0.82 0.32 ± 0.06 0.43 ± 0.06 1.52 ± 0.03 1.34 ± 0.03* 30 ± 5
PHGG:RFB 1.63 ± 0.82 0.26 ± 0.04 0.39 ± 0.01 1.51 ± 0.07 1.43 ± 0.05* 26 ± 7
PHGG:INH:RFB 1.75 ± 0.87 0.26 ± 0.01 0.37 ± 0.05 1.51 ± 0.06 1.52 ± 0.02* 31 ± 4
#Shape factor 1 used in calculation; *Shape factor 2 used in calculation.