Genetic parameters for growth, reproductive and maternal traits
in a multibreed meat sheep population
Ana Maria Bezerra Oliveira Lôbo
1, Raimundo Nonato Braga Lôbo
1,2, Samuel Rezende Paiva
3,
Sônia Maria Pinheiro de Oliveira
1and Olivardo Facó
21
Departamento de Zootecnia, Universidade Federal do Ceará, Fortaleza, CE, Brazil.
2Embrapa Caprinos e Ovinos, Sobral, CE, Brazil.
3
Embrapa Recursos Genéticos e Biotecnologia, Brasília, DF, Brazil.
Abstract
The genetic parameters for growth, reproductive and maternal traits in a multibreed meat sheep population were es-timated by applying the Average Information Restricted Maximum Likelihood method to an animal model. Data from a flock supported by the Programa de Melhoramento Genético de Caprinos e Ovinos de Corte (GENECOC) were used. The traits studied included birth weight (BW), weaning weight (WW), slaughter weight (SW), yearling weight (YW), weight gain from birth to weaning (GBW), weight gain from weaning to slaughter (GWS), weight gain from weaning to yearling (GWY), age at first lambing (AFL), lambing interval (LI), gestation length (GL), lambing date (LD -number of days between the start of breeding season and lambing), litter weight at birth (LWB) and litter weight at weaning (LWW). The direct heritabilities were 0.35, 0.81, 0.65, 0.49, 0.20, 0.15 and 0.39 for BW, WW, SW, YW, GBW, GWS and GWY, respectively, and 0.04, 0.06, 0.10, 0.05, 0.15 and 0.11 for AFL, LI, GL, LD, LWB and LWW, respectively. Positive genetic correlations were observed among body weights. In contrast, there was a negative ge-netic correlation between GBW and GWS (-0.49) and GBW and GWY (-0.56). Positive gege-netic correlations were ob-served between AFL and LI, LI and GL, and LWB and LWW. These results indicate a strong maternal influence in this herd and the presence of sufficient genetic variation to allow mass selection for growth traits. Additive effects were of little importance for reproductive traits, and other strategies are necessary to improve the performance of these ani-mals.
Key words:age at first lambing, genetic correlation, heritability, body weight, litter weight.
Received: December 19, 2008; Accepted: June 9, 2009.
Introduction
The Brazilian meat sheep industry has expanded in recent years mainly through an increase in the number of farmers. However, performance indexes are lower than those required to guarantee efficiency and competitiveness compared with other animal sectors. Dickerson (1970) sug-gested that increasing the number of lambs marketed per ewe per year is an important measure to improve the effi-ciency of meat sheep production. However, in Brazil, local breeds show low productivity, which leads breeders to cross these with exotic breeds. Crossbreeding programs have been so widely used in the tropics that very few within-breed selection experiments have been done (Kos-geyet al., 2004). Because selection to enhance
reproduc-tive traits in sheep is rather slow, the crossbreeding of local breeds with highly prolific breeds is widespread in several countries, the aim being to increase lamb production by
ex-ploiting the additive and non-additive effects of genes (El Fadili and Leroy, 2001). The study of these aspects in Bra-zilian multibreed populations is necessary since most in-vestigations have concentrated on performance analysis (Silva and Araújo, 2000; Silva, 2002; Barroset al., 2004,
2005). Consequently, the genetic variation in these popula-tions is unknown.
Hallet al.(1995) reported direct and maternal
heri-tabilities for birth weight of 0.03 and 0.24, respectively, in crossbred animals, whereas Pitono and James (1995) stated that for a tropical breed the corresponding values for these heritabilities were 0.13 and 0.08, respectively. Genetic pa-rameters for weaning weight, carcass traits and ovulation rates have been reported for crossbred and tropical breeds (Pollottet al., 1994; Hallet al., 1995; Pitono and James,
1995; Daviset al., 1998). Most studies of genetic
parame-ters in sheep have used purebred animals and have focused on body weights. Studies that have used crossbred and composite breeds include those of Waldronet al.(1992),
Fossceco and Notter (1995), Joneset al.(1999), El Fadili
and Leroy (2001) and Rosatiet al.(2002).
www.sbg.org.br
Send correspondence to Raimundo Nonato Braga Lobo. Embrapa Caprinos, Estrada Sobral Groaíras km 4, Caixa Postal 145, 62011-970 Sobral, CE, Brazil. E-mail: lobo@cnpc.embrapa.br.
Correct selection is one of the most important strate-gies to maximize production in animal breeding. However, the lack of estimates for the genetic parameters necessary to predict genetic gains is commonly cited as an obstacle in the design and implementation of conservation-based selective breeding programs in the tropics. As a result, there are few reports on successful selective breeding programs in this re-gion (Gizawet al., 2007). Estimates of genetic parameters
are necessary to determine the selection method to be used, to estimate the maximum genetic gain that can be achieved and to obtain correct estimates of breeding values. However, there have been few estimates of the genetic parameters for growth, reproductive and maternal traits in sheep in Brazil. Sousaet al. (1999, 2006) and Sarmento et al. (2006)
de-scribed results obtained with the purebred Santa Inês, but there have been no studies with crossbred sheep.
According to Robinsonet al(1981), the use of models
involving different genetic groups can account for all ge-netic influences, including non-linear and epistatic effects. However, additive genetic variance and heritability have been shown to be overestimated in an additive model with progeny groups in multibreed population. Van Der Werf and De Boer (1989) pointed out that crossbreeding parame-ters may be hard to estimate, particularly from field data, and that well-designed experiments are prerequisite for meaningful results. In their simulation study, the overesti-mation of additive variance and heritability was relatively small for levels of heterosis and recombination£5%. Ro-driguez-Almeidaet al.(1997) reported that the separation
of estimates of the mean genetic effects on traits in multi-breed populations of beef cattle into those attributable to the genetic make-up of the calf and those attributable to the genetic makeup of the dam required data from a variety of crosses. The authors considered that, in beef cattle, there are a limited number of breeds or crosses in any herd. Con-sequently, the estimation of direct and maternal breed ge-netic effects from field data sets may not be possible. The development of a system for evaluating crossbred records will require the incorporation of information from ade-quately designed crossbreeding experiments.
The lack of systematic record keeping by Brazilian sheep breeders means that there have been few studies of the genetic parameters related to reproductive and maternal traits in the Brazilian flock. This lack of information greatly hinders adequate development of the meat sheep industry in which the reproductive and maternal efficiencies of ewes must be con-stantly evaluated in order to ensure profitable production. The aim of this study was therefore to estimate the additive genetic parameters for growth, reproductive and maternal traits in meat sheep of a multibreed population raised in Brazil.
Materials and Methods
The data bank analyzed contained 12 years (1996-2007) of information from a flock maintained by Gaasa
Agropecuária Ltda. and supported by the Programa de Melhoramento Genético de Caprinos e Ovinos de Corte (GENECOC) of Embrapa Caprinos e Ovinos. This herd is located at Inhumas in the state of Goiás (altitude 770 m, 16° 21’ 28” S, 49° 29’ 45” W) with a tropical semi-humid climate.
The sheep underwent standard sanitary care and were vaccinated with Poli-Star®(against botulism,
enterotoxe-mia, gangrene and symptomatic carbuncle) at 50 and 80 days of age; all of the animals were vaccinated annually in March. Treatment for eimeriosis was done twice a year (March and October). Fecal egg counts and the Famacha method were used to control gastrointestinal nematodes. Footbaths (50 g of copper sulfate in 60 mL of 40% formal-dehyde) were used during the rainy season.
The breeding season was year round with ewes grouped by lots. The lambs were weaned at 60 days, con-fined, and fed with maize silage and corn and soy bran meal containing 21% crude protein (CP); they were slaughtered at 120-150 days. After weaning the lambs, the ewes under-went a 30-day breeding season in the presence of vasec-tomized rams. Ewes and rams were fed with Tifton 85 pasture, silage and meal containing 15% CP.
To understand the flock formation, initially purebred Santa Inês, Poll Dorset, Hampshire Down, Suffolk, Île de France, Brazilian Somali and Texel rams were acquired with Santa Inês, Poll Dorset, Morada Nova, Brazilian So-mali, Santa Inês x Morada Nova and Santa Inês x Brazilian Somali dams. Later, purebred Dorper, Primera and East Friesian rams were acquired. The matings were controlled but not designed. All rams of all breeds had the same oppor-tunity to mate ewes of all genetic groups (purebred and crossbred). As a result, within a few years the flock was a mixture of crossbred dams with a varied contribution from the different breeds. Only the rams and some Santa Inês, Poll Dorset and Brazilian Somali dams were purebred.
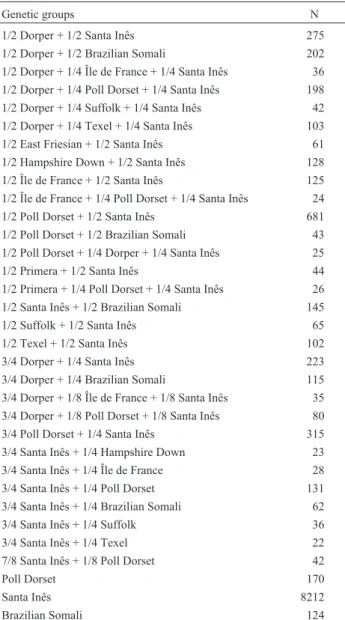
Data used in this study were obtained several years after formation of the flock, and already contained of the all breeds indicated above. However, many genetic groups were excluded from analysis because of insufficient infor-mation. The rams used included purebred Santa Inês (36), Poll Dorset (16), Hampshire Down (5), East Friesian (4), Dorper (4), Suffolk (3), Île de France (2), Brazilian Somali (2), Texel (1) and Primera (1). The dams used included purebred Santa Inês, Poll Dorset, Brazilian Somali and crossbreeds involving all of the breeds indicated above. Ta-ble 1 shows the genetic groups analyzed.
330-395 days old were considered as YW. The YW of lambs > 20 kg were excluded.
The reproductive and maternal traits analyzed included age at first lambing (AFL), lambing interval (LI), gestation length (GL), lambing date (LD; number of days between the start of breeding season and lambing), litter weight at birth (LWB) and litter weight at weaning (LWW). Data for animals with an AFL > 800 days and an LI > 550 days were excluded. Lambing orders from 1 to 8 were analyzed.
The MIXED procedure of SAS (SAS Institute Inc., 1996) was used to define fixed effects in the analysis. For each trait, many linear models were evaluated, with the use of con-temporary groups or effects being analyzed individually. The logarithm of the Restricted Maximum Likelihood, Aikaikes’s Information Criteria and Schwarz’s Bayesian Information Criteria were the criteria for choice of the best fit.
For growth traits, contemporary groups (CG) were formed by grouping animals born in the same year-season and with the same sex, genetic group and birth type (single, twin, triplet). Only CGs with a minimum of five animals were considered. The birth seasons were: season 1 - Janu-ary, February and March, season 2 - April, May and June, season 3 - July, August and September, and season 4 - Oc-tober, November and December.
For reproductive and maternal traits, two CGs were created: the first for AFL and the second for other traits. For AFL, the CG consisted of animals born in the same year-season, of the same genetic group, birth type (single, twin, triplet) and interaction of birth type with lamb sex (1 - one male lamb, 2 - one female lamb, 3 - two male lambs, 4 - two females lambs, 5 - one male lamb and one female lamb or 6 - more than two lambs, independent of sex). For the other traits, the CGs consisted of animals of the same genetic group, with lambing in the same year-season, the same birth type (1 to 6, as defined above) and the same lambing order. Only CGs with a minimum of five animals were con-sidered.
After preliminary analysis and based on criteria used to determine the best fit, the following fixed models were used, depending on the trait:
BW - contemporary group and age class of the dam at lambing (1 to 8 years);
WW and GBW - contemporary group, age class of the dam at lambing and lamb age (days) at weaning as linear and quadratic covariates;
SW and GWS - contemporary group and animal age (days) at slaughter as the covariate (linear and quadratic);
YW and GWY - contemporary group and animal age (days) on the date the animal was weighed as the covariate (linear and quadratic);
AFL, LI, GL, LD, TBW and TWW - contemporary groups.
The (co)variances and genetic parameters were esti-mated by the Average Information Restricted Maximum Likelihood method (AI-REML) using the software WOMBAT (Meyer, 2006), with single or multiple trait ani-mal models. WOMBAT assesses whether an analysis has converged, based on the following criteria: 1) a change in log L of < 5x10⁻⁴, 2) a change in parameters of < 10-8and 3)
a gradient vector norm < 10-3.
The relationship matrix included 16,808 animals. Of these, 75 were rams and 4,272 were ewes, 13,124 animals had a complete pedigree (sire and dam known) and 1,251 were from the basal flock; 224 animals had an unknown sire. There was an average of 156 lambs per ram and 901 lambs per ram breed.
The general model for growth traits was:
Y =Xb+Z a1 +Z m Z pe2 + 3 +e
whereYis a (N x 1) vector of observations,bis the vector of fixed effects related to the incidence matrixX, a is the
vec-Table 1- Genetic groups analyzed in this work and the number of
observa-tions (N).
Genetic groups N
1/2 Dorper + 1/2 Santa Inês 275
1/2 Dorper + 1/2 Brazilian Somali 202
1/2 Dorper + 1/4 Île de France + 1/4 Santa Inês 36 1/2 Dorper + 1/4 Poll Dorset + 1/4 Santa Inês 198 1/2 Dorper + 1/4 Suffolk + 1/4 Santa Inês 42 1/2 Dorper + 1/4 Texel + 1/4 Santa Inês 103
1/2 East Friesian + 1/2 Santa Inês 61
1/2 Hampshire Down + 1/2 Santa Inês 128 1/2 Île de France + 1/2 Santa Inês 125 1/2 Île de France + 1/4 Poll Dorset + 1/4 Santa Inês 24
1/2 Poll Dorset + 1/2 Santa Inês 681
1/2 Poll Dorset + 1/2 Brazilian Somali 43 1/2 Poll Dorset + 1/4 Dorper + 1/4 Santa Inês 25
1/2 Primera + 1/2 Santa Inês 44
1/2 Primera + 1/4 Poll Dorset + 1/4 Santa Inês 26 1/2 Santa Inês + 1/2 Brazilian Somali 145
1/2 Suffolk + 1/2 Santa Inês 65
1/2 Texel + 1/2 Santa Inês 102
3/4 Dorper + 1/4 Santa Inês 223
3/4 Dorper + 1/4 Brazilian Somali 115
3/4 Dorper + 1/8 Île de France + 1/8 Santa Inês 35 3/4 Dorper + 1/8 Poll Dorset + 1/8 Santa Inês 80
3/4 Poll Dorset + 1/4 Santa Inês 315
3/4 Santa Inês + 1/4 Hampshire Down 23
3/4 Santa Inês + 1/4 Île de France 28
3/4 Santa Inês + 1/4 Poll Dorset 131
3/4 Santa Inês + 1/4 Brazilian Somali 62
3/4 Santa Inês + 1/4 Suffolk 36
3/4 Santa Inês + 1/4 Texel 22
7/8 Santa Inês + 1/8 Poll Dorset 42
Poll Dorset 170
Santa Inês 8212
tor of direct genetic effects related to the incidence matrix
Z1,mis the vector of maternal genetic effects related to the
incidence matrixZ2, pe is the vector of permanent
environ-mental maternal effects related to the incidence matrixZ3,
andeis the vector of random residuals.
The fixed effects have already been described previ-ously. The general model presented above was used for BW, WW and GBW. The componentsZ2mandZ3pewere
not included in the analysis of SW, YW, GWS and GWY. BW, WW and SW were analyzed in a multiple trait model. YW was analyzed in a multiple trait model with BW and WW. GBW was analyzed with GWS in one analysis and with GWY in another analysis.
Using the same general model described previously for all reproductive and maternal traits, theZ2mcomponent
was not considered and theZ3pecomponent refers to
per-manent environmental effects on the animal and was in-cluded only for traits measured many times on the same animal (LI, GL, LD, TBW and TWW). These two compo-nents were not included for AFL. AFL, LI and GL were an-alyzed in a multiple trait model, as were TBW and TWW. LD was analyzed in a single trait model.
The crossbreeding in this population was completely random,i.e., there was no specific design in the breeding
pattern used. As an initial simplification in the data analy-sis, the average effect (additive and non-additive) of the ge-netic groups was considered to be fixed.
Results
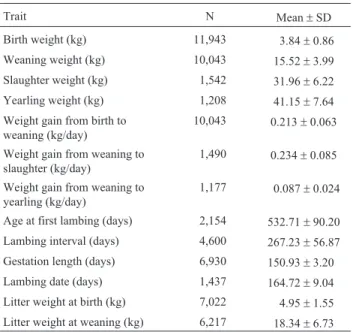
The number of observations and the means for the traits analyzed are shown in Table 2. The means for WW
and SW were 15.52 kg and 31.96 kg, respectively. In this flock, the average ages at weaning and slaughter were 55.68±12.41 days and 128.74±44.97 days, respectively, indicating a high potential for precocity under the feeding conditions used here.
The estimates of (co)variance, Log L value, herita-bilities and genetic correlations for a multiple trait analysis for BW, WW and SW are summarized in Table 3. Negative genetic covariances were observed between direct and ma-ternal effects for BW and WW. The direct heritabilities for
Table 2- Number of observations (N), means and standard deviations
(SD) for the traits analyzed in this work.
Trait N Mean±SD
Birth weight (kg) 11,943 3.84±0.86
Weaning weight (kg) 10,043 15.52±3.99 Slaughter weight (kg) 1,542 31.96±6.22 Yearling weight (kg) 1,208 41.15±7.64 Weight gain from birth to
weaning (kg/day)
10,043 0.213±0.063
Weight gain from weaning to slaughter (kg/day)
1,490 0.234±0.085
Weight gain from weaning to yearling (kg/day)
1,177 0.087±0.024
Age at first lambing (days) 2,154 532.71±90.20 Lambing interval (days) 4,600 267.23±56.87 Gestation length (days) 6,930 150.93±3.20 Lambing date (days) 1,437 164.72±9.04 Litter weight at birth (kg) 7,022 4.95±1.55 Litter weight at weaning (kg) 6,217 18.34±6.73
Table 3- Estimates of (co)variances (kg2), heritabilities and genetic correlations for birth weight (BW), weaning weight (WW) and slaughter weight
(SW) in the multiple trait model.
s2andsgenetic s2andspermanent
environmental
s2andsphenotypic
BW WW SW BWM WWM BW WW BW WW SW
BW 0.204 0.045 0.580
WW 1.076 8.144 0.080 0.534 1.074 10.080
SW 1.334 11.119 17.762 1.395 9.813 27.465
BWM -0.048 -0.214 0.123 0.098
WWM -0.403 -2.840 -2.611 0.306 2.093
Log L -17,606.62
Genetic correlations and heritabilities (off diagonal)
BW WW SW BWM WWM
BW 0.35±0.04
WW 0.83±0.04 0.81±0.05
SW 0.70±0.07 0.92±0.04 0.65±0.05
BWM -0.34±0.08 -0.24±0.06 0.09±0.09 0.17±0.03
WWM -0.62±0.07 -0.69±0.04 -0.43±0.09 0.68±0.07 0.21±0.03
BW, WW and SW were moderate to high (0.35-0.81). The maternal heritability for WW (0.21) was higher than for BW (0.17), indicating moderate genetic maternal variity in the flock that could be used to select for maternal abil-ity. The genetic correlations among these traits were high (0.70-0.92).
Table 4 shows the (co)variances, Log L value, herita-bilities and genetic correlations for multiple trait analysis with BW, WW and YW. As with BW, WW and SW, there were negative genetic covariances between genetic and ma-ternal effects for BW and WW. The direct heritabilities
ranged from moderate to high, indicating a potential for the selection of these traits in this flock. Heritability for BW was higher than in the previous analysis (0.42vs.0.35) but
was lower for WW (0.60vs.0.81). The genetic correlations
were high, with a maximum of 0.89 between BW and WW, as also observed in the analysis with BW, WW and SW. Comparison of Tables 3 and 4 shows that there were simi-larities between the two multiple trait analyses.
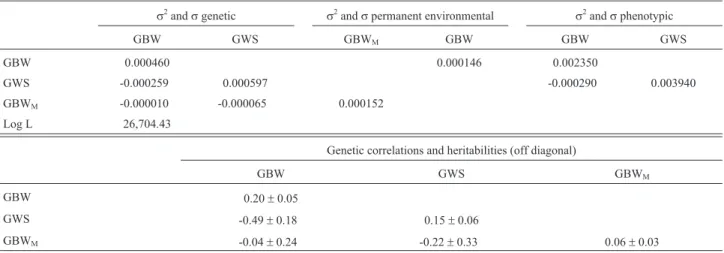
The (co)variances, Log L value, heritabilities and ge-netic correlations for multiple trait analysis with GBW and GWS are summarized in Table 5. The results for the
analy-Table 4- Estimates of (co)variances (kg2), heritabilities and genetic correlations for birth weight (BW), weaning weight (WW) and yearling weight (YW)
in the multiple trait model.
s2andsgenetic s2andspermanent
environmental
s2andsphenotypic
BW WW YW BWM WWM BW WW BW WW YW
BW 0.258 0.048 0.606
WW 1.071 5.622 0.096 0.600 1.043 9.426
YW 1.065 6.778 12.691 1.082 6.509 25.944
BWM -0.079 -0.258 0.035 0.109
WWM -0.421 -1.782 -0.538 0.311 1.581
Log L -17,072.48
Genetic correlations and heritabilities (off diagonal)
BW WW YW BWM WWM
BW 0.42±0.04
WW 0.89±0.03 0.60±0.05
YW 0.59±0.08 0.80±0.06 0.49±0.06
BWM -0.47±0.06 -0.33±0.06 0.03±0.09 0.18±0.03
WWM -0.66±0.07 -0.60±0.05 -0.12±0.11 0.75±0.07 0.17±0.03
s2= variances ands= covariances. BW = genetic direct effect for birth weight, BWM= genetic maternal effect for birth weight, Log L = logarithm of the Likelihood function, WW = genetic direct effect for weaning weight, WWM= genetic maternal effect for weaning weight and YW = genetic direct effect for yearling weight.
Table 5- Estimates of (co)variances (kg/day2), heritabilities and genetic correlations for weight gain from birth to weaning (GBW) and weight gain from
weaning to slaughter (GWS) in the multiple trait model.
s2andsgenetic s2andspermanent environmental s2andsphenotypic
GBW GWS GBWM GBW GBW GWS
GBW 0.000460 0.000146 0.002350
GWS -0.000259 0.000597 -0.000290 0.003940
GBWM -0.000010 -0.000065 0.000152
Log L 26,704.43
Genetic correlations and heritabilities (off diagonal)
GBW GWS GBWM
GBW 0.20±0.05
GWS -0.49±0.18 0.15±0.06
GBWM -0.04±0.24 -0.22±0.33 0.06±0.03
sis using GBW and GWY are shown in Table 6. Direct heritabilities were 0.15 and 0.39 for GWS and GWY, re-spectively. Direct and maternal heritabilities for GBW ranged from 0.20 to 0.36 and from 0.06 to 0.11, respec-tively, being lowest in the analysis with GBW and GWS. GBW was negatively correlated with posterior weight gains (-0.49 with GWS and -0.56 with GWY).
Table 7 shows the estimates of (co)variances, Log L value, heritabilities and genetic correlations for multiple trait analysis with AFL, LI and GL. The heritabilities were low, ranging from 0.04 to 0.10. The genetic correlation be-tween AFL and GL was negative (-0.33), but was positive between AFL and LI and between LI and GL (0.19 each). However, the errors associated with these correlations were very high.
The (co)variances, Log L value, heritabilities and ge-netic correlation for the maternal traits LWB and LWW are shown in Table 8. The was a high, positive genetic correla-tion between these traits (0.86) while the heritabilities were low (0.15 for LWB and 0.11 for LWW).
Table 9 shows the estimated parameters for LD. The heritability for this trait was low (0.05), indicating a strong influence of environmental and non-additive genetic ef-fects on the traits examined. This estimate was similar to that for the lambing interval.
Discussion
Direct additive variances and heritabilities were higher than maternal genetic variances and heritabilities for all growth traits. In general, direct heritabilities tend to be
Table 6- Estimates of (co)variances (kg/day2), heritabilities and genetic correlations for weight gain from birth to weaning (GBW) and weight gain from
weaning to yearling (GWY) in the multiple trait model.
s2andsgenetic s2andspermanent environmental s2andsphenotypic
GBW GWY GBWM GBW GBW GWY
GBW 0.000890 0.000152 0.002447
GWY -0.000162 0.000093 -0.000107 0.000235
GBWM -0.000243 0.000110 0.000269
Log L 27,511.90
Genetic correlations and heritabilities (off diagonal)
GBW GWY GBWM
GBW 0.36±0.08
GWY -0.56±0.10 0.39±0.09
GBWM -0.50±0.12 0.70±0.13 0.11±0.03
s2= variances ands= covariances. GBW = genetic direct effect for weight gain from birth to weaning, GBWM= genetic maternal effect for weight gain from birth to weaning, GWY = genetic direct effect for weight gain from weaning to yearling and Log L = logarithm of the Likelihood function.
Table 7- Estimates of (co)variances (day2), heritabilities and genetic correlations for age at first lambing (AFL), lambing interval (LI) and gestation
length (GL) in the multiple trait model.
s2andsgenetic s2andspermanent environmental s2andsphenotypic
AFL LI GL LI GL AFL LI GL
AFL 230.380 5161.200
LI 39.953 185.930 5.736 39.953 2985.800
GL -4.159 2.195 0.704 2.210 0.852 -4.159 2.195 7.247
Log L -36,507.19
Genetic correlations and heritabilities (off diagonal)
AFL LI GL
AFL 0.04±0.01
LI 0.19±0.40 0.06±0.03
GL -0.33±0.29 0.19±0.24 0.10±0.02
higher than maternal heritabilities for early growth traits (Hassen et al., 2003). Sarmento et al. (2006) observed heritabilities of 0.20 and 0.001 for birth weight and wean-ing weight, respectively, at 112 days of age in purebred Santa Inês sheep. Their estimate for BW was similar to that found here. This breed has a larger contribution in the popu-lation studied here (Table 1), which may explain this simi-larity. Tosh and Kemp (1994) estimated direct heritabilities of 0.39 and 0.22 for BW and WW in Hampshire Down purebred sheep. Lower direct heritabilities for BW and WW, respectively, have been reported by others,e.g., 0.12 and 0.21 for Poll Dorset sheep (Tosh and Kemp, 1994), 0.09 and 0.09 for composite sheep (Mousaet al., 1999), 0.13 and 0.04 for Santa Inês sheep (Sousaet al., 1999) and 0.24 and 0.19 for dual purpose (wool and meat) crossbred sheep (Hallet al., 1995). Genetic parameters depend on the historical formation, selective forces and environmental as-pects of a population, which partly explains differences among the results of different studies. However, it is possi-ble that the values reported here were overestimated by non-additive effects.
Safariet al.(2005) reviewed the genetic parameters
for growth, carcass and reproductive traits compiled from 165 studies in sheep published from 1992 to 2003, with es-timates generally derived from mixed model REML proce-dures, in addition to some Bayesian estimates. The weighted means for direct heritability associated with birth, weaning and post-weaning weights and daily gain were 0.15±0.02, 0.18±0.04, 0.21±0.01 and 0.17±0.01, re-spectively, for meat breeds. The estimates described here were greater than the weighted means reported by these au-thors, which suggests that bias in our analysis resulted in
overestimation of the parameters. According to Van Der Werf and De Boer (1989), additive genetic variance and heritability are overestimated when data from crossbred an-imals are analyzed by additive model without non-additive effects.
The maternal heritabilities for BW and WW were dif-ferent from those of Sousaet al.(1999) for a purebred Santa
Inês flock (0.12 for BW and 0.10 for WW) and of Mousaet al.(1999) for a composite breed, but were similar to those
of Mariaet al.(1993) for Romanov sheep. Tosh and Kemp
(1994) reported maternal heritabilities of 0.22, 0.31 and 0.13 for BW and 0.14, 0.19 and 0.06 for weight at 50 days of age in Hampshire Down, Poll Dorset and Romanov sheep, respectively. In dual purpose crossbred sheep, Hall
et al.(1995) reported maternal heritabilities of 0.08 for BW
and 0.05 for WW. As shown here, the maternal effect was strong for BW and WW, indicating the importance of ma-ternal ability in crossbred females in this population. Dif-ferences in the maternal effects among breeds have been attributed to variations in milk production (Meyeret al.,
1994; Tosh and Kemp, 1994).
The (co)variance and correlation estimates between animal and maternal genetic effects were generally nega-tive for all traits. Sarmentoet al.(2006) reported genetic
correlations (ram) of -0.47 and -0.24 between the direct and
maternal effects for BW and WW, respectively, in purebred Santa Inês. These values were similar to those observed here, possibly because this breed provided the largest con-tribution to the flock in our study. Sousaet al.(1999), who
also studied Santa Inês sheep, reported correlations of -0.15 and -0.10 between direct and maternal effects for birth weight and weaning weight, respectively, at 112 days of age. Hassenet al.(2003) likewise reported antagonism
be-tween direct and maternal effects: from -0.48 to -0.23 for BW and from -0.69 to -0.57 for WW. Tosh and Kemp (1994) observed ramof -0.56 and -0.35 for BW in
Hamp-shire Down and Poll Dorset sheep, respectively. Janssenset al.(2000) reported an ramof 0.03 for Belgian Texel sheep
and Maniatis and Pollott (2002) reported a value of -0.64 for Suffolk sheep. In contrast, there have been no estimates for this correlation in multibreed sheep populations. The value estimated here suggests that it may be difficult for breeders to select for both aspects. Selection for direct ef-fects allows a reduction in maternal efef-fects and vice-versa.
Table 8- Estimates of (co)variances (kg2), heritabilities (h2) and genetic correlation for litter weight at birth (LWB) and litter weight at weaning (LWW)
in the multiple trait model.
s2andsgenetic s2andspermanent environmental s2andsphenotypic
LWB LWW LWB LWW LWB LWW h2 r
g
LWB 0.144 0.053 0.947 0.15±0.02 0.86±0.08
LWW 0.604 3.431 0.315 1.857 0.920 31.239 0.11±0.02
Log L -16,105.35
s2= variances ands= covariances. h2= heritability, r
g= genetic correlation and Log L = logarithm of the Likelihood function.
Table 9- Estimates of variances (s2; day2), heritability (h2) and logarithm of the Likelihood function (-2Log L) for lambing date (LD) in the multiple trait model.
Parameters LD
s2genetic 3.3072
s2permanent environmental 0.2271
s2phenotypic 68.7890
h2 0.05
±0.05
There is a lack of information on the genetic parame-ters for YW in Brazilian flocks. Matikaet al.(2003)
ob-served a direct heritability of 0.26 for weight at 12 months. Miraei-Ashtiani et al. (2007) cited a heritability of
0.10±0.05 for yearling weight of Sangsari sheep in Iran, and Mokhtariet al.(2008) estimated the heritability of YW to be 0.15 in Kermani sheep. These values were lower than observed here, suggesting that we overestimated this pa-rameter, probably because of non-addictive effects.
The high correlations between BW and WW (0.83), BW and SW (0.70) and WW and SW (0.92) indicated the possibility of a correlated response with the selection for a given trait. The greater heritability of SW and the high cor-relation between WW and SW suggested that animals may be selected at an early age.
Genetic correlations ranging from -0.33 to 0.81 have been reported between BW and WW in different breeds and at different ages (Leweret al., 1994; Vaez Torshiziet al.,
1996; Anallaet al., 1997; Yazdiet al., 1997; Mousaet al.,
1999; Neseret al., 2001; Wulijiet al., 2001; Boujenane and
Kansari, 2002; Dugumaet al., 2002; Hanfordet al., 2002;
Simmet al., 2002). Correlations between BW and weight at
90 days of age (0.56) and post-weaning weight at 120 days of age (0.44) were reported by Nasholm and Danell (1996) in Swedish finewool sheep, and between BW and weight at 174 days of age (0.48) by Anallaet al.(1997) in Merino
sheep. High genetic correlations (0.83-0.98) between WW and post-weaning weights have also been reported (Nagyet al., 1999; Wulijiet al., 2001; Yazdiet al., 1997; Snymanet al., 1998). Miraei-Ashtianiet al.(2007) reported a genetic
correlation of 0.43 between WW and YW, and Gizawet al.
(2007) estimated this correlation to be 0.69±0.01. These estimates were lower than described here, probably be-cause we overestimated these values as a result of non-additive effects.
A knowledge of the magnitude and directions of the correlations among traits is important for establishing effi-cient selection strategies. As expected, the correlation be-tween WW and YW was greater than bebe-tween BW and YW. Nevertheless, in both cases, the correlations indicated that selection for one trait would positively affect the re-sponse to the other.
An understanding of the additive genetic variation for weight gain is extremely important for breeding programs. The direct (0.20) and maternal (0.06) heritabilities for GBW (Table 5) were similar to those reported by Mariaet al. (1993) for Romanov sheep. Matika et al.(2003)
re-ported direct and maternal heritabilities and correlation be-tween direct and maternal effects of 0.17, 0.04 and -0.08, respectively, for the pre-weaning average daily weight gain in Sabi sheep. Hagger (1998) observed a correlation of -0.45 between the direct and maternal effects for this same trait. The direct heritability estimated here for GWY was similar to that reported by Mousaet al. (1999) for
post-weaning average daily weight gain in a composite terminal sire breed.
The negative correlations between GBW and GWS/GWY may reflect the limited number of observa-tions for these parameters, partly because of the way the data were distributed. The animals in this flock were slaughtered between 120 and 150 days of age (128 on aver-age), with only the males and females selected for repro-duction reaching one year of age. Consequently, birth-to-weaning data were distributed into the birth-to- weaning-to-slaughter and weaning-to-yearling groups. In addition, some lambs did not reach weaning. These negative correla-tions may also reflect differences in the animals responses to pre- and post-weaning environmental conditions, such as occurs in genotypevs.environmental interactions. In the
pre-weaning period, the animals were maintained in con-fined conditions, whereas after weaning they had access to pasture and food supplementation.
AFL and LI were strongly influenced by environmen-tal effects, whereas GL showed little inter-individual varia-tion. Hence, the low heritabilities estimated for these traits were expected. A heritability of 0.27 for LI was estimated by McManus and Miranda (1998), but there was a high standard error (0.29). The low estimates observed here for reproductive traits did not mean that there was no possibil-ity for genetic improvement, but rather that the expected genetic gain was low if selection for these traits was also low.
According Rosatiet al.(2002), a low heritability for
reproductive traits probably reflects a proportionally greater influence of environmental effects, as well as a low genetic variability for fertility, litter size, lamb survival, lambing frequency and other reproductive traits (Turner and Young, 1969). Heritability for LWB was similar to that reported by McManus and Miranda (1998), but their esti-mate of heritability for LWW differed from that observed here. Rosatiet al.(2002) reported heritabilities of 0.40 and
0.17 for total litter weight at birth and total litter weight at weaning for purebred, composite and crossbred sheep based on an additive model in which the ewe breed effect was fixed (as done here). These authors commented on the high values they obtained for these traits and pointed out that heritability estimates may be influenced by other fac-tors not considered in the model; non-additive effects were not considered and their estimates were generally higher than observed here. The large positive genetic correlation between LWB and LWW suggests that productivity can also be selected based on LWW.
breeder-introduced bias,i.e., the ewes would be unable to
express their full reproductive potential because the mating season was limited to a particular period. However, since in this flock the mating season was essentially continuous the year round, all of the ewes had an opportunity to mate at eight-month intervals.
In conclusion, the results of this study show that there is strong maternal influence in this herd and the presence of sufficient genetic variation to allow mass selection for growth traits. Additive effects were of little importance for reproductive traits, and other strategies are necessary to im-prove the performance of these animals. However, the esti-mates presented here should be interpreted cautiously because of possible bias introduced by the absence of non-additive effects in the model used here. This model was chosen primarily because the lack of information on ge-netic parameters in Brazilian sheep precluded the choice of a more adequate one. Consequently, it is possible that the additive variance and heritability for some traits were over-estimated. Nevertheless, the results described here provide a starting point for more detailed studies on the genetic pa-rameters of multibreed sheep in Brazil.
Acknowledgments
Financial support was provided by Conselho Nacio-nal de Desenvolvimento Científico e Tecnológico (CNPq) and Embrapa Caprinos e Ovinos. The authors thank the anonymous reviewers for many helpful suggestions.
References
Analla M, Munoz-Serrano A and Serradilla JM (1997) Analysis of genetic relationships between litter size and weight traits in Segurena sheep. Can J Anim Sci 77:17-21.
Barros NN, Vasconcelos VR and Lobo RNB (2004) Caracte-rísticas de crescimento de cordeiros de cordeiros F1 para abate no semi-árido do Nordeste do Brasil. Pesq Agrop Bras 39:809-814 (Abstract in English).
Barros NN, Vasconcelos VR, Wander AE and Araújo MRA (2005) Eficiência bioeconômica de cordeiros F1 Dorper x Santa Inês para produção de carne. Pesq Agrop Bras 40:825-831 (Abstract in English).
Boujenane I and Kansari J (2002) Estimates of (co)variances due to direct and maternal effects for body weights in Timahdite sheep. Anim Sci 74:409-414.
Davis GH, Morris CA and Dodds KG (1998) Genetic studies of prolificacy in New Zealand sheep. Anim Sci 67:289-297. Dickerson GE (1970) Efficiency of animal production - Molding
the biological components. J Anim Sci 30:849-859. Duguma G, Schoeman SJ, Cloete SWP and Jordaan GF (2002)
Genetic parameter estimates of early growth traits in the Tygerhoek Merino flock. S Afric J Anim Sci 32:66-75. El Fadili M and Leroy PL (2001) Estimation of additive and
non-additive genetic parameters for reproduction, growth and survival traits in crosses between the Moroccan D’man and Timahdite sheep breeds. J Anim Breed Genet 118:341-353.
Fossceco SL and Notter DR (1995) Heritabilities and genetic cor-relations of body weight, testis growth and ewe lamb repro-ductive traits in crossbred sheep. Anim Sci 60:185-195. Gizaw S, Lemma S, Komen H and Van Arendonk JAM (2007)
Es-timates of genetic parameters and genetic trends for live weight and fleece traits in Menz sheep. Small Rum Res 70:145-153.
Hagger C (1998) Litter, permanent environmental, ram-flock, and genetic effects on early weight gain of lambs. J Anim Sci 76:452-457.
Hall DG, Fogarty NM and Gilmour AR (1995) Performance of crossbred progeny of Trangie Fertility Merino and Booroola Merino rams and Poll Dorset ewes. 1. Lamb birth weight, survival and growth. Aust J Exp Agric 35:1069-1074. Hanford KJ, van Vleck LD and Snowder GD (2002) Estimates of
genetic parameters and genetic change for reproduction, weight, and wool characteristics of Columbia sheep. J Anim Sci 80:3086-3098.
Hassen Y, Fuerst-Waltl B and Sölkner J (2003) Genetic parameter estimates for birth weight, weaning weight and average daily gain in pure and crossbred sheep in Ethiopia. J Anim Breed Genet 120:29-38.
Janssens S, Geysen D and Vandepitte W (2000) Genetic parame-ters for liveweight in Belgian Texel sheep. Proceedings of the 51st Annual Meeting of the European Association for Animal Production, Session 1.6.
Jones HE, Simm G, Dingwall WS and Lewis RM (1999) Genetic relationships between visual and objective measures of car-cass composition in crossbred lambs. Anim Sci 69:553-561. Kosgey IS, Van Arendonk JAM and Baker RL (2004) Economic
values for traits of meat sheep in medium to high production potential areas of the tropics. Small Rumin Res 50:187-202. Lewer RP, Woolaston RR and Howe RR (1994) Studies on
West-ern Australian Merino sheep 2. Genetic and phenotypic pa-rameter estimates for objectively measured traits on ram and ewe hoggets using different model types. Aust J Agric Res 45:829-840.
Maniatis N and Pollott GE (2002) Maternal effects on weight and ultrasonically measured traits of lambs in a small closed Suf-folk flock. Small Rum Res 45:235-246.
Maria GA, Boldman KG and Van Vleck LD (1993) Estimates of variance due to direct and maternal effects for growth traits of Romanov sheep. J Anim Sci 71:845-849.
Matika O, van Wyk JB, Erasmus GJ and Baker RL (2003) Genetic parameter estimates in Sabi sheep. Small Rum Res 79:17-28.
McManus C and Miranda RM (1998) Estimativas de parâmetros genéticos em ovinos Bergamácia. Braz J Anim Sci 27:916-921 (Abstract in English).
Meyer K (2006) WOMBAT - A program for mixed model analy-ses by restricted maximum likelihood. User notes. Animal Genetics and Breeding Unit, Armidale, 58 pp.
Meyer K, Carrick MJ and Donnelly BJP (1994) Genetic parame-ters for milk production of Australian beef cows and wean-ing of their calves. J Anim Sci 72:1155-1165.
Mokhtari MS, Rashidi A and Mohammadi Y (2008) Estimation of genetic parameters for pos-weaning traits of Kermani sheep. Small Rum Res 80:22-27.
Mousa E, Van Vleck LD and Leymaster A (1999) Genetic param-eters for growth traits for a composite terminal sire breed of sheep. J Anim Sci 77:1659-1665.
Nagy I, Solkner J, Komlosi I and Safar L (1999) Genetic parame-ters of production and fertility traits in Hungarian Merino sheep. J Anim Breed Genet 116:399-413.
Nasholm A and Danell O (1996) Genetic relationships of lamb weight, maternal ability, and mature ewe weight in Swedish finewool sheep. J Anim Sci 74:329-339.
Neser FWC, Erasmus GJ and van Wyk JB (2001) Genetic param-eter estimates for pre-weaning weight traits in Dorper sheep. Small Rum Res 40:197-202.
Pitono A and James JW (1995) Estimates of genetic parameters for lamb weights and growth traits of tropical sheep. Pro-ceedings of the Australian Association of Animal Breeding and Genetics 11:425-429.
Pollott GE, Guy DR and Croston D (1994) Genetic parameters of lamb carcass characteristics at 3 end-points: Fat level, age and weight. Anim Prod 58:65-75.
Robinson OW, McDaniel BT and Rincon EJ (1981) Estimation of direct and maternal additive and heterotic effects from cros-sbreeding experiments in animals. J Anim Sci 52:44-50. Rodriguez-Almeida FA, Van Vleck LD and Gregory KE (1997)
Estimation of direct and maternal breed effects for predic-tion of expected progeny differences for birth and weaning in three multibreed populations. J Anim Sci 75:1203-1212. Rosati A, Mousa E, van Vleck LD and Young LD (2002) Genetic
parameters of reproductive traits in sheep. Small Rum Res 43:65-74.
Safari E, Fogarty NM and Gilmour AR (2005) A review of genetic parameter estimates for wool, growth, meat and reproduc-tion traits in sheep. Livest Prod Sci 92:271-289.
Sarmento JLR, Torres RA, Sousa WH, Pereira CS, Lopes PS and Breda FC (2006) Estimação de parâmetros genéticos para características de crescimento de ovinos Santa Inês utili-zando modelos uni e multicaracterística. Braz J Vet Anim Sci 58:581-589 (Abstract in English).
SAS Institute Inc. (1996) SAS/STAT. User’s Guide v. 6.11. 4th edition, SAS Institute Inc., Cary, 842 pp.
Silva FLR (2002) Desempenho de ovinos deslanados e mestiços criados em pastagem nativa, na região semi-árida do nordes-te do Brasil. Rev Cient Prod Anim 4:71-76 (Abstract in Eng-lish).
Silva LR and Araújo AM (2000) Características de reprodução e de crescimento de ovinos mestiços Santa Inês no Ceará. Braz J Anim Sci 29:1712-1720 (Abstract in English). Simm G, Lewis RM, Grundy B and Dingwall WS (2002)
Re-sponses to selection for lean growth in sheep. Anim Sci 74:39-50.
Snyman MA, Erasmus GJ, van Wyk JB and Olivier JJ (1998) Ge-netic and phenotypic correlations among production and re-production traits in Afrino sheep. S Afr J Anim Sci 28:74-81.
Sousa JER, de Oliveira SMP, Lima FAM, Silva FLR and Silva MA (2006) Efeitos genéticos e de ambiente para caracterís-ticas de crescimento em ovinos Santa Inês no Estado do Ceará. Rev Ciênc Agron 37:364-368 (Abstract in English). Sousa WH, Pereira CS, Bergmann AG and Silva FLR (1999)
Estimativas de componentes de (co)variânica e herdabi-lidade direta e materna de pesos corporais em ovinos da raça Santa Inês. Braz J Anim Sci 28:1252-1262 (Abstract in Eng-lish).
Tosh JJ and Kemp RA (1994) Estimation of variance components for lamb weights in three sheep populations. J Anim Sci 72:1184-1190.
Turner HN and Young SY (1969) Quantitative Genetics in Sheep Breeding. MacMillan, Melbourne, 332 pp.
Vaez Torshizi R, Nicholas FW and Raadsma HW (1996) REML estimates of variance and covariance components for pro-duction traits in Australian Merino sheep, using an animal model, 1: Body weight from birth to 22 months. Aust J Agric Res 47:1235-1249.
Van Der Werf JHJ and De Boer W (1989) Influence of non-additive effects on estimation of genetic parameters in dairy cattle. J Dairy Sci 72:2606-2614.
Waldron DF, Clarke JN, Rae A, Kirton AH and Bennett GL (1992) Genetic and phenotypic parameter estimates for se-lection to improve lamb carcass traits. New Zealand J Agric Res 35:287-298.
Wuliji T, Dodds KG, Land JTJ, Andrews RN and Turner PR (2001) Selection for ultrafine Merino sheep in New Zealand: Heritability, phenotypic and genetic correlations of live weight, fleece weight and wool characteristics in yearlings. Anim Sci 72:241-250.
Yazdi MH, Nasholm A, Johansson K, Jorjani H and Liljedahl LE (1997) Population parameters for birth and ewe fleece weight at different parities in Baluchi sheep. J Anim Breed Genet 114:323-332.
Associate Editor: Pedro Franklin Barbosa