Bernardo L HortaI Denise P GiganteI Cesar G VictoraI Fernando C BarrosII Isabel OliveiraI Vera SilveiraI
I Programa de Pós-Graduação em Epidemiologia. Universidade Federal de Pelotas. Pelotas, RS, Brasil
II Programa de Pós-Graduação em Saúde e Comportamento. Universidade Católica de Pelotas. Pelotas, RS, Brasil
Correspondence: Bernardo Lessa Horta
Programa de Pós-Graduação em Epidemiologia – UFPEL R. Marechal Deodoro, 1160 96020-220 Pelotas, RS, Brasil E-mail: [email protected] Received: 2/6/2008 Revised: 9/22/2008 Approved: 9/24/2008
Early determinants of random
blood glucose among adults of
the 1982 birth cohort, Pelotas,
Southern Brazil
ABSTRACT
OBJECTIVE: To evaluate the effects of socioeconomic variables, birth
weight, duration of breastfeeding and income changes on random blood glucose levels among young adults.
METHODS: This was a study on the birth cohort from 1982, when the 5,914
hospital births that occurred in the city of Pelotas (Southern Brazil) were identifi ed and the mothers were interviewed. The children whose families lived in the urban area of the city were followed up several times. In 2004-5, 4,927 individuals of the cohort were interviewed and blood was collected from the fi ngertips of 3,730 of them for random blood glucose measurements. Associations between random blood glucose levels and skin color, family income at birth, maternal schooling, income change between 1982 and 2004-5, birth weight and duration of breastfeeding were evaluated.
RESULTS: The mean blood glucose level was 97.3 ± 15.1mg/dL, and it was
greater among the men. None of the variables studied was associated with the men’s blood glucose level. Among the women, maternal schooling, family income at 23 years of age and birth weight were inversely associated with blood glucose levels. However, birth weight lost its statistical signifi cance in the multivariable analysis.
CONCLUSIONS: Birth weight and duration of breastfeeding did not present
any long-term effect on random blood glucose levels. Only maternal schooling level and present income presented associations with random blood glucose levels among the women.
DESCRIPTORS: Adult. Blood Glucose. Birth Weight. Socioeconomic Factors. Cohort Studies. Brazil.
INTRODUCTION
Interest in the long-term effects of exposure occurring during gestation or the fi rst years of life arose following the study by Barker et al.2 Birth weight, nu-tritional status during infancy and diet during the fi rst years of life have been associated with occurrences of diseases during adulthood.9,13,14,20 It has been reported in several studies that low birth weight is associated with greater preva-lence of diabetes or glucose intolerance during adolescence or adulthood.8,16,21,24 Other studies have found lower risk of diabetes type 2 among individuals who had been breastfed.11,15,18,25
the fasting blood glucose level is, the lower the risk of developing ischemic cardiopathy is.1,5,6
On the other hand, in reviewing the literature, no papers evaluating the effect of socioeconomic conditions dur-ing the fi rst years of life on blood glucose levels or on the prevalence of diabetes were identifi ed.
The aim of the present study was to evaluate the effects of socioeconomic variables, birth weight, duration of breastfeeding and income change on random blood glucose levels among young adults.
METHODS
In 1982, the children who were born in the maternity hospitals in Pelotas, Southern Brazil, were identifi ed and the mothers were interviewed. Those children whose families lived in the urban area of the city were followed up and examined on different occasions. The description of these follow-ups was published previously.4,22,23
In 2004-5, 4,297 individuals from the cohort were interviewed. At the end of the interview, the subjects were invited to visit the research laboratory to give a blood sample. Another home visit was made, with the aim of obtaining blood samples from the interviewees who did not go to the laboratory. At the time of col-lecting the samples, both in the laboratory and in the homes, a measurement of random blood glucose was obtained from fi ngertip blood, using a portable glucose meter (Accu-Check Advantage – Roche). Information on the times of the last meal and the blood collection were recorded so that the time elapsed since the last meal could be calculated.
The analyses included the distribution and description of the means and dispersion of continuous variables.
The following were taken to be independent vari-ables: sex, skin color, family income at birth, maternal schooling, income change, birth weight and duration of breastfeeding. Analysis of variance was used for comparisons between the means for each category of variable. Stratifi cation according to sex was used in the crude and adjusted analyses. The latter followed a hier-archical model with skin color, family income at birth and maternal schooling in the fi rst level; birth weigh in the second level; and breastfeeding in the third level. Since the duration of fasting is associated with blood glucose levels (Figure), all the analyses were adjusted for the duration of fasting.
Verbal informed consent was obtained from the adults responsible for the children during the early phase of the study (from 1982 to 1986), as was the common practice at that time, when there was no ethics committee at the Federal University of Pelotas. For the more recent phas-es, the university’s research ethics committee, which is affi liated to the National Council for Research Ethics
(Conselho Nacional de Ética em Pesquisa, CONEP), approved the study and written informed consent was obtained from the participants.
RESULTS
Out of the 4,297 interviewees, 3,914 went to the labo-ratory for blood sample collection and random blood glucose levels could be measured in 3,730 cases. The mean blood glucose level was 97.3 ± 15.1 mg/dl and the median was 95.0 mg/dl, thus suggesting slight posi-tive asymmetry. The random blood glucose level was signifi cantly higher (p < 0.001) among the men (99.8 mg/dl) than among the women (94.8 mg/dl). The mean duration of fasting was 3.7 ± 3.0 hours.
Table 1 shows that skin color, family income at birth, maternal schooling, income change during the fol-low-up period and duration of breastfeeding were not associated with random blood glucose levels. On the other hand, only among the women, the mean blood glucose levels decreased with increasing birth weight, and the linear trend test for this was statistically sig-nifi cant (p = 0.05).
The results from the crude and adjusted analyses for the men (Table 2) confi rmed that, even after adjusting for possible confounding factors, none of the variables stud-ied was associated with random blood glucose level.
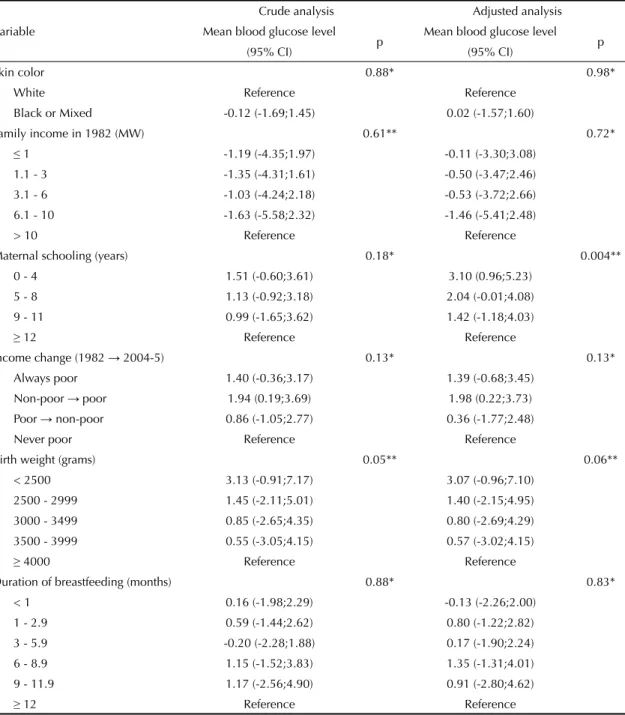
On the other hand, among the women, after adjusting for skin color and family income, an inverse relation-ship between maternal schooling and random glucose level was observed (Table 3). None of the income categories was associated with blood glucose level, although the income change over the study period sug-gested that random blood glucose levels at 23 years of age were more infl uenced by socioeconomic conditions in adulthood than by the conditions during childhood. Independent of socioeconomic level at birth, for the interviewees who were considered poor in 2004-5,
Figure. Mean blood glucose levels according to duration of fasting. Pelotas, Southern Brazil, 1982 to 2004-5.
110
105
100
95
90
85
80
9
1 2 3 4 5 6 7 8 10 11 12 13
Blood gl
ucose lev
el (mg/dl)
even after adjusting for skin color, the blood glucose level was 1.75 mg/dl (95% CI: 0.22; 3.28 mg/dl) higher than what was observed among the individuals who had never been poor. The linear relationship between birth weight and random glucose level did not maintain its statistical signifi cance after adjusting for skin color and other socioeconomic variables (p = 0.06).
DISCUSSION
The results from the present study showed that the mean random blood glucose level was higher among the men than among the women. For the women, the glucose level was infl uenced by maternal schooling and present income.
Table 1. Random blood glucose levels stratifi ed according to sex, in relation to birth weight, maternal skin color, family income at birth, maternal schooling and duration of breastfeeding. Pelotas, Southern Brazil, 1982 to 2004-5.
Variable
Men Women Total
n*
Mean blood glucose level (with standard deviation)
n*
Mean blood glucose level (with standard deviation)
n*
Mean blood glucose level (with standard deviation)
Skin color p = 0.93** p = 0.86** p = 0.70** White 1389 99.7 (15.6) 1393 94.8 (13.9) 2782 97.3 (15.0)
Black or Mixed 402 99.4 (15.7) 403 94.7 (15.1) 805 97.0 (15.5)
Family income in 1982 (MW) p = 0.46** p = 0.61*** p = 0.67**
≤ 1 376 100.3 (16.0) 382 94.8 (14.9) 758 97.5 (15.7) 1.1 - 3 925 99.3 (14.3) 942 94.7 (13.7) 1867 97.0 (14.1)
3.1 - 6 360 100.6 (18.4) 332 95.0 (14.4) 692 97.9 (16.8) 6.1 - 10 106 100.4 (17.0) 101 94.4 (14.8) 207 97.5 (16.2)
> 10 92 98.1 (13.2) 97 96.0 (14.1) 189 97.0 (13.7)
Maternal schooling (years) p = 0.17** p = 0.18** p = 0.29**
0 - 4 609 98.8 (13.7) 631 95.2 (14.6) 1240 96.9 (14.3)
5 - 8 818 100.6 (17.3) 787 94.8 (13.8) 1605 97.7 (15.9)
9 - 11 198 99.9 (15.6) 206 94.7 (14.0) 404 97.2 (15.0)
≥ 12 237 99.2 (13.5) 240 93.7 (14.3) 477 96.4 (14.2) Income change (1982 → 2004-5) p = 0.61** p = 0.13** p = 0.67**
Always poor 284 99.9 (15.7) 342 95.4 (15.4) 626 97.5 (15.6)
Non-poor → poor 286 100.8 (16.6) 350 96.0 (13.7) 636 98.1 (15.3)
Poor → non-poor 314 99.1 (15.0) 277 94.9 (14.8) 591 97.1 (15.0) Never poor 974 99.6 (15.5) 890 94.0 (13.6) 1864 97.0 (14.9)
Birth weight (grams) p = 0.70** p = 0.05*** p = 0.61**
< 2500 114 99.3 (14.1) 149 96.8 (14.3) 263 97.9 (14.3)
2500 - 2999 389 100.2 (17.2) 510 95.2 (14.6) 899 97.3 (16.0)
3000 - 3499 712 99.6 (15.2) 706 94.6 (14.6) 1418 97.1 (15.1)
3500 - 3999 519 99.3 (14.7) 431 94.2 (12.7) 950 97.0 (14.0)
≥ 4000 131 101.3 (17.5) 69 93.7 (14.3) 200 98.7 (16.8) Duration of breastfeeding (months) p = 0.42** p = 0.88** p = 0.73**
< 1 month 408 99.6 (14.8) 373 94.7 (14.9) 781 97.2 (15.0)
1 - 2.9 463 100.7 (16.5) 471 95.1 (14.9) 934 97.9 (16.0)
3 - 5.9 405 100.0 (16.6) 417 94.4 (13.1) 822 97.1 (15.2)
6 - 8.9 168 97.6 (12.8) 166 95.7 (13.9) 334 96.7 (13.4) 9 - 11.9 71 100.4 (16.7) 68 95.7 (12.1) 139 98.1 (14.8)
≥ 12 285 99.6 (15.5) 316 94.6 (14.4) 601 96.9 (15.1) MW: Minimum wage
* For some variables, it was not possible to obtain information regarding up to 65 men and 55 women ** Test for heterogeneity
Considering that blood glucose levels were evaluated for 66% of the individuals in the cohort, there is the possibility of selection bias. However, for such bias to explain the absence of association between duration of breastfeeding and blood glucose level, it would be necessary for the percentage of losses to be different for each category of duration of breastfeeding relating to blood glucose levels. Among the individuals breast-fed for shorter times, the collection percentage would be greater for those with lower blood glucose, while
among those who were breastfed for longer times, the collection percentage would be greater for those with higher blood glucose. In such a situation, the selection bias would tend to underestimate a possible protective effect from the duration of breastfeeding. However, the possibility that selection bias might occur is remote, considering that the percentage of in-dividuals with blood glucose measurements available in the present study was independent of the duration of breastfeeding.
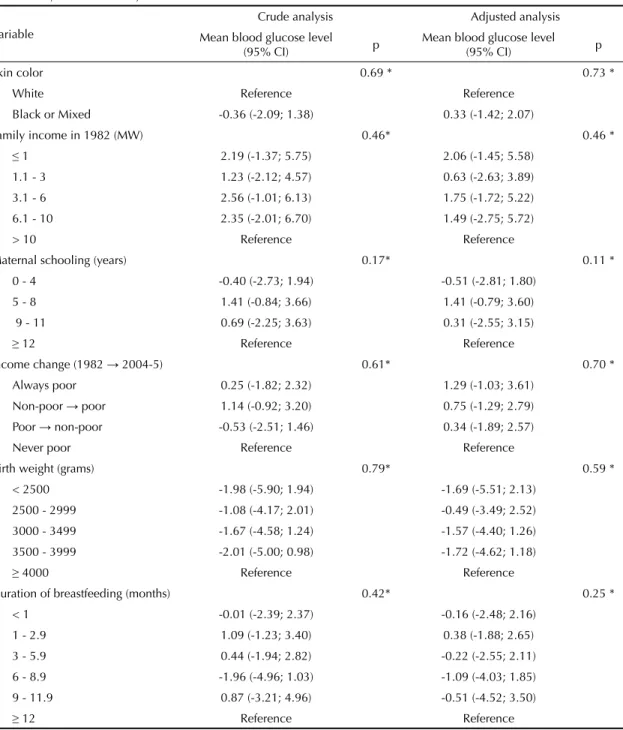
Table 2. Crude and adjusted analyses on the effect of the independent variables on random blood glucose levels among the men. Pelotas, Southern Brazil, 1982 to 2004-5.
Variable
Crude analysis Adjusted analysis
Mean blood glucose level (95% CI) p
Mean blood glucose level (95% CI) p
Skin color 0.69 * 0.73 *
White Reference Reference
Black or Mixed -0.36 (-2.09; 1.38) 0.33 (-1.42; 2.07)
Family income in 1982 (MW) 0.46* 0.46 *
≤ 1 2.19 (-1.37; 5.75) 2.06 (-1.45; 5.58) 1.1 - 3 1.23 (-2.12; 4.57) 0.63 (-2.63; 3.89)
3.1 - 6 2.56 (-1.01; 6.13) 1.75 (-1.72; 5.22)
6.1 - 10 2.35 (-2.01; 6.70) 1.49 (-2.75; 5.72)
> 10 Reference Reference
Maternal schooling (years) 0.17* 0.11 *
0 - 4 -0.40 (-2.73; 1.94) -0.51 (-2.81; 1.80)
5 - 8 1.41 (-0.84; 3.66) 1.41 (-0.79; 3.60)
9 - 11 0.69 (-2.25; 3.63) 0.31 (-2.55; 3.15)
≥ 12 Reference Reference
Income change (1982 → 2004-5) 0.61* 0.70 *
Always poor 0.25 (-1.82; 2.32) 1.29 (-1.03; 3.61) Non-poor → poor 1.14 (-0.92; 3.20) 0.75 (-1.29; 2.79)
Poor → non-poor -0.53 (-2.51; 1.46) 0.34 (-1.89; 2.57)
Never poor Reference Reference
Birth weight (grams) 0.79* 0.59 *
< 2500 -1.98 (-5.90; 1.94) -1.69 (-5.51; 2.13)
2500 - 2999 -1.08 (-4.17; 2.01) -0.49 (-3.49; 2.52) 3000 - 3499 -1.67 (-4.58; 1.24) -1.57 (-4.40; 1.26)
3500 - 3999 -2.01 (-5.00; 0.98) -1.72 (-4.62; 1.18)
≥ 4000 Reference Reference
Duration of breastfeeding (months) 0.42* 0.25 *
< 1 -0.01 (-2.39; 2.37) -0.16 (-2.48; 2.16) 1 - 2.9 1.09 (-1.23; 3.40) 0.38 (-1.88; 2.65)
3 - 5.9 0.44 (-1.94; 2.82) -0.22 (-2.55; 2.11)
6 - 8.9 -1.96 (-4.96; 1.03) -1.09 (-4.03; 1.85)
9 - 11.9 0.87 (-3.21; 4.96) -0.51 (-4.52; 3.50)
≥ 12 Reference Reference
The duration of fasting was less than the recommended 12 hours for almost all of the interviewees,19 and this can be considered to be a limitation of the study. Lower duration of fasting overestimates the mean blood glucose level, thus introducing a non-differential classifi cation error. This bias might explain the absence of any as-sociation between birth weight and blood glucose level among the women, for whom the inversely proportional relationship did not maintain its statistical signifi cance
in the adjusted analysis. On the other hand, the clas-sifi cation bias cannot be considered responsible for the absence of any association between duration of breast-feeding and blood glucose level, since no pattern that would suggest the existence of a linear relationship was observed. Possible differences in the duration of fasting were controlled for when this was included in the mul-tivariable analysis, thereby reducing the possibility that differential information bias might have occurred.
Table 3. Crude and adjusted analyses on the effect of the independent variables on random blood glucose levels among the women. Pelotas, Southern Brazil, 1982 to 2004-5.
Variable
Crude analysis Adjusted analysis Mean blood glucose level
p Mean blood glucose level p (95% CI) (95% CI)
Skin color 0.88* 0.98*
White Reference Reference
Black or Mixed -0.12 (-1.69;1.45) 0.02 (-1.57;1.60)
Family income in 1982 (MW) 0.61** 0.72*
≤ 1 -1.19 (-4.35;1.97) -0.11 (-3.30;3.08) 1.1 - 3 -1.35 (-4.31;1.61) -0.50 (-3.47;2.46)
3.1 - 6 -1.03 (-4.24;2.18) -0.53 (-3.72;2.66) 6.1 - 10 -1.63 (-5.58;2.32) -1.46 (-5.41;2.48)
> 10 Reference Reference
Maternal schooling (years) 0.18* 0.004**
0 - 4 1.51 (-0.60;3.61) 3.10 (0.96;5.23)
5 - 8 1.13 (-0.92;3.18) 2.04 (-0.01;4.08) 9 - 11 0.99 (-1.65;3.62) 1.42 (-1.18;4.03)
≥ 12 Reference Reference
Income change (1982 → 2004-5) 0.13* 0.13* Always poor 1.40 (-0.36;3.17) 1.39 (-0.68;3.45)
Non-poor →poor 1.94 (0.19;3.69) 1.98 (0.22;3.73) Poor → non-poor 0.86 (-1.05;2.77) 0.36 (-1.77;2.48)
Never poor Reference Reference
Birth weight (grams) 0.05** 0.06**
< 2500 3.13 (-0.91;7.17) 3.07 (-0.96;7.10)
2500 - 2999 1.45 (-2.11;5.01) 1.40 (-2.15;4.95) 3000 - 3499 0.85 (-2.65;4.35) 0.80 (-2.69;4.29) 3500 - 3999 0.55 (-3.05;4.15) 0.57 (-3.02;4.15)
≥ 4000 Reference Reference
Duration of breastfeeding (months) 0.88* 0.83*
< 1 0.16 (-1.98;2.29) -0.13 (-2.26;2.00) 1 - 2.9 0.59 (-1.44;2.62) 0.80 (-1.22;2.82) 3 - 5.9 -0.20 (-2.28;1.88) 0.17 (-1.90;2.24)
6 - 8.9 1.15 (-1.52;3.83) 1.35 (-1.31;4.01) 9 - 11.9 1.17 (-2.56;4.90) 0.91 (-2.80;4.62)
≥ 12 Reference Reference
1. Action to Control Cardiovascular Risk in Diabetes Study Group, Gerstein HC, Miller ME, Byington RP, Goff DC Jr, Bigger JT, et al. Effects of intensive glucose lowering in type 2 diabetes.N Engl J Med. 2008 Jun 12;358(24):2545-59
2. Barker DJP. Fetal and infant origins of adult disease. London: BMJ; 1992.
3. Barros AJ, Victora CG, Horta BL, Goncalves HD, Lima RC, Lynch J. Effects of socioeconomic change from birth to early adulthood on height and overweight. Int
J Epidemiol. 2006;35(5):1233-8. DOI: 10.1093/ije/
dyl160
4. Barros FC, Victora CG, Horta BL, Gigante DP. Metodologia do estudo da coorte de nascimentos de 1982 a 2004-5, Pelotas, RS. Rev Saude Publica.
2008;42(Supl 2):7-15.
5. Bowman L, Armitage J. Diabetes and impaired glucose tolerance: a review of the epidemiological and trial evidence for their role in cardiovascular risk. Semin
Vasc Med. 2002;2(4):383-9. DOI:
10.1055/s-2002-36767
6. Gerstein HC. Glucose: a continuous risk factor for cardiovascular disease. Diabet Med. 1997;14 (Suppl 3):S25-31. DOI: 10.1002/(SICI)1096-9136(199708)14:3+<S25::AID-DIA441>3.3.CO;2-T
7. Gigante DP, Minten GC, Horta BL, Barros FC, Victora CG. Avaliação nutricional de adultos da coorte de nascimentos de 1982, Pelotas, RS. Rev Saude Publica.
2008;42(Supl 2):60-69.
8. Hales CN, Barker DJ, Clark PM, Cox LJ, Fall C, Osmond C, et al. Fetal and infant growth and
impaired glucose tolerance at age 64. BMJ.
1991;303(6809):1019-22.
9. Horta BL, Barros FC, Victora CG, Cole TJ. Early and late growth and blood pressure in adolescence. J
Epidemiol Community Health. 2003;57(3):226-30.
DOI: 10.1136/jech.57.3.226
10. Khaw KT, Wareham N, Bingham S, Luben R, Welch A, Day N. Association of hemoglobin A1c with cardiovascular disease and mortality in adults: the European prospective investigation into cancer in Norfolk. Ann Intern Med. 2004;141(6):413-20.
11. Martin RM, Ebrahim S, Griffi n M, Davey Smith G, Nicolaides AN, Georgiou N, et al. Breastfeeding and atherosclerosis: intima-media thickness and plaques at 65-year follow-up of the Boyd Orr cohort.
Arterioscler Thromb Vasc Biol. 2005;25(7):1482-8.
DOI: 10.1161/01.ATV.0000170129.20609.49
12. Meigs JB, Nathan DM, D’Agostino RB Sr., Wilson PW. Fasting and postchallenge glycemia and cardiovascular disease risk: the Framingham Offspring Study.
Diabetes Care. 2002;25(10):1845-50. DOI: 10.2337/
diacare.25.10.1845
13. Newsome CA, Shiell AW, Fall CH, Phillips DI, Shier R, Law CM. Is birth weight related to later glucose and insulin metabolism? A systematic review. Diabet Med. 2003;20(5):339-48. DOI: 10.1046/j.1464-5491.2003.00871.x
14. Owen CG, Whincup PH, Odoki K, Gilg JA, Cook DG. Infant feeding and blood cholesterol: a study in adolescents and a systematic review. Pediatrics.
2002;110(3):597-608. DOI: 10.1542/peds.110.3.597
REFERENCES
There is controversy regarding evidence relating to the effect of breastfeeding on blood glucose levels. While most studies that have evaluated its association with type 2 diabetes have reported that breastfeeding de-creases the risk of diabetes occurrence,11,15,18,25 Plancou-laine et al17 observed that fasting blood glucose levels were not associated with the duration of breastfeeding among children aged fi ve to 11 years in France. Con-sidering that the studies in which the outcome was dia-betes type 2 were conducted among adult populations, insuffi cient length of follow-up to allow the effects of breastfeeding programs on glucose metabolism to be seen may explain the absence of any association in our study and in the study on French children.
Barros et al3 observed among the cohort of the present study that socioeconomic conditions during the fi rst years of life had a greater effect on the individuals’ heights at the age of 19 years than did the current socioeconomic level. In the present evaluation, cur-rent income had a greater infl uence on blood glucose levels than family income at birth had, but only among the women. The prevalence of obesity was found to be greater among women who were exposed to low
socioeconomic levels throughout life.7 Since obesity is one of the factors responsible for increased blood glucose levels, it might be considered to be a possible mediator in the relationship between income change and blood glucose levels. However, adjustment for obesity only had a small effect on the association between low socioeconomic level at 23 years of age and blood glu-cose level, reducing it from 1.75 mg/dl to 1.56 mg/dl. Therefore, the higher prevalence of obesity among the women of lower socioeconomic level was not respon-sible for the association between socioeconomic level in adulthood and blood glucose level.
15. Pettitt DJ, Forman MR, Hanson RL, Knowler WC, Bennett PH. Breastfeeding and incidence of non-insulin-dependent diabetes mellitus in Pima Indians.
Lancet. 1997;350(9072):166-8. DOI:
10.1016/S0140-6736(96)12103-6
16. Phipps K, Barker DJ, Hales CN, Fall CH, Osmond C, Clark PM. Fetal growth and impaired glucose tolerance in men and women. Diabetologia. 1993;36(3):225-8. DOI: 10.1007/BF00399954
17. Plancoulaine S, Charles MA, Lafay L, Tauber M, Thibult N, Borys JM, et al. Infant-feeding patterns are related to blood cholesterol concentration in prepubertal children aged 5-11 y: the Fleurbaix-Laventie Ville Sante study. Eur J Clin Nutr. 2000;54(2):114-9. DOI: 10.1038/sj.ejcn.1600904
18. Ravelli AC, van der Meulen JH, Osmond C, Barker DJ, Bleker OP. Infant feeding and adult glucose tolerance, lipid profi le, blood pressure, and obesity. Arch Dis
Child. 2000;82(3):248-52.DOI: 10.1136/adc.82.3.248
19. Report of the Expert Committee on the Diagnosis and Classifi cation of Diabetes Mellitus. Diabetes Care. 1997;20(7):1183-97.
20. Rich-Edwards JW, Stampfer MJ, Manson JE, Rosner B, Hankinson SE, Colditz GA, et al. Birth weight and risk of
cardiovascular disease in a cohort of women followed up since 1976. BMJ. 1997;315(7105):396-400.
21. Rich-Edwards JW, Colditz GA, Stampfer MJ, Willett WC, Gillman MW, Hennekens CH, et al. Birthweight and the risk for type 2 diabetes mellitus in adult women. Ann Intern Med. 1999;130(4 Pt 1):278-84.
22. Victora CG, Barros FC. Cohort profi le: the 1982 Pelotas (Brazil) birth cohort study. Int J Epidemiol.
2006;35(2):237-42. DOI: 10.1093/ije/dyi290
23. Victora CG, Barros FC, Lima RC, Behague DP, Gonçalves H, Horta BL, et al. The Pelotas birth cohort study, Rio Grande do Sul, Brazil, 1982-2001. Cad
Saude Publica. 2003;19(5):1241-56. DOI: 10.1590/
S0102-311X2003000500003
24. Wei JN, Sung FC, Li CY, Chang CH, Lin RS, Lin CC, et al. Low birth weight and high birth weight infants are both at an increased risk to have type 2 diabetes among schoolchildren in taiwan. Diabetes Care. 2003;26(2):343-8. DOI: 10.2337/diacare.26.2.343
25. Young TK, Martens PJ, Taback SP, Sellers EA, Dean HJ, Cheang M, et al. Type 2 diabetes mellitus in children: prenatal and early infancy risk factors among native canadians. Arch Pediatr Adolesc Med.
2002;156(7):651-5.
This article is based on data from the study “Pelotas birth cohort, 1982” conducted by Postgraduate Program in Epidemiology at Universidade Federal de Pelotas.
The 1982 birth cohort study is currently supported by the Wellcome Trust initiative entitled Major Awards for Latin America on Health Consequences of Population Change. Previous phases of the study were supported by the International Development Research Center, The World Health Organization, Overseas Development Administration, European Union, National Support Program for Centers of Excellence (PRONEX), the Brazilian National Research Council (CNPq) and Brazilian Ministry of Health.
This article underwent the same peer review process as for other manuscripts submitted to this journal. Both authors and reviewers are guaranteed anonymity. Editors and reviewers declare that there are no confl icts of interest that could affect their judgment with respect to this article.