High Throughput Sequencing Analysis of the
Immunoglobulin Heavy Chain Gene from
Flow-Sorted B Cell Sub-Populations Define
the Dynamics of Follicular Lymphoma Clonal
Evolution
Emanuela Carlotti1, David Wrench1, Guglielmo Rosignoli2, Jacek Marzec3,
Ajanthah Sangaralingam3, Lena Hazanov4, Miri Michaeli4, Simon Hallam1, Tracy Chaplin1, Sameena Iqbal1, Maria Calaminici1, Bryan Young1, Ramit Mehr4, Peter Campbell5,
Jude Fitzgibbon1, John G. Gribben1*
1Centre for Haemato-Oncology, Barts Cancer Institute - a CR-UK Centre Of Excellence, Queen Mary University of London, London, United Kingdom,2Flow Cytometry Core Facility, Barts Cancer Institute - a CR-UK Centre Of Excellence, Queen Mary University of London, London, United Kingdom,3Centre for Molecular Oncology, Barts Cancer Institute - a CR-UK Centre Of Excellence, Queen Mary University of London, London, United Kingdom,4The Mina & Everard Goodman Faculty of Life Sciences, Bar-Ilan University, Ramat-Gan, Israel,5Cancer Genome Project, Wellcome Trust Sanger Institute, Hinxton, United Kingdom
Abstract
Understanding the dynamics of evolution of Follicular Lymphoma (FL) clones during disease progression is important for monitoring and targeting this tumor effectively. Genetic profiling of serial FL biopsies and examples of FL transmission following bone marrow transplant sug-gest that this disease may evolve by divergent evolution from a common ancestor cell. How-ever where this ancestor cell resides and how it evolves is still unclear. The analysis of the pattern of somatic hypermutation of the immunoglobulin gene (Ig) is traditionally used for tracking the physiological clonal evolution of B cells within the germinal center and allows to discriminate those cells that have just entered the germinal center and display features of ancestor cells from those B cells that keep re-circulating across different lymphoid organs. Here we investigated the pattern of somatic hypermutation of the heavy chain of the immuno-globulin gene (IgH-VH) in 4 flow-sorted B cells subpopulations belonging to different stages of differentiation, from sequential lymph node biopsies of cases displaying diverse patterns of evolution, using the GS-FLX Titanium sequencing platform. We observed an unexpect-edly high level of clonality, with hundreds of distinct tumor subclones in the different subpop-ulations from the same sample, the majority detected at a frequency<10−2. By using a
lineage trees analysis we observed in all our FL and t-FL cases that the oligoclonal FL popu-lation was trapped in a narrow intermediate stage of maturation that maintains the capacity to undergo SHM, but was unable to further differentiate. The presence of such a complex architecture highlights challenges currently encountered in finding a cure for this disease. OPEN ACCESS
Citation:Carlotti E, Wrench D, Rosignoli G, Marzec J, Sangaralingam A, Hazanov L, et al. (2015) High Throughput Sequencing Analysis of the
Immunoglobulin Heavy Chain Gene from Flow-Sorted B Cell Sub-Populations Define the Dynamics of Follicular Lymphoma Clonal Evolution. PLoS ONE 10(9): e0134833. doi:10.1371/journal.pone.0134833
Editor:Jose Angel Martinez Climent, University of Navarra, Center for Applied Medical Research, SPAIN
Received:January 11, 2015
Accepted:July 14, 2015
Published:September 1, 2015
Copyright:© 2015 Carlotti et al. This is an open access article distributed under the terms of the Creative Commons Attribution License, which permits unrestricted use, distribution, and reproduction in any medium, provided the original author and source are credited.
Data Availability Statement:All sequencing files are available from the ENA database:http://www.ebi.ac. uk/ena/data/view/PRJEB9334(accession number(s) PRJEB9334).
Introduction
Follicular lymphoma (FL) is an indolent disease characterized by interspersed episodes of
remission and relapse, associated with a decreased sensitivity to therapeutic agents [1]. About
30% of cases undergo histological transformation to a more aggressive lymphoma, most
com-monly diffuse large B cell lymphoma (t-FL), an event associated with poor outcome [2,3].
It is well established that the t(14;18) translocation is the founder genetic aberration of this disease and it is observed in about 90% of patients at diagnosis. This rearrangement provides a
survival advantage to the B cell clone but it is not sufficient to initiate lymphoma [4,5]. More
recently, next generation sequencing studies have identified early driver mutations in chroma-tin regulator genes alongside genes that regulate the interaction of the tumor with its
microen-vironment [6]. These observations suggest that the second hit responsible for switching a long
living B cell into a lymphoma cell could reside either in an altered epigenetic program or in a
deviated interaction with other populations [6–9].
Cancer progression is now viewed as a genetic process that follows the same patterns
observed in evolutionary biology. Studies in other hematological malignancies, [10–13]
demon-strated that these tumors are characterized by an intra-tumor genetic heterogeneity and within individual patients, multiple subclones can coexist and initiate the disease. By investigating the
variable region of the immunoglobulin heavy chain gene (IgH-VH) [14,15] and performing
genome wide analysis [16,17], our group and others have proposed the existence of a more
immature common progenitor cell (CPC) shared by tumor clones that are detected at relapse and transformation. It appears that this cell (or pool of cells) is rare and, based on the somatic hypermutation (SHM) pattern of IgH-VH, has already experienced the germinal center (GC).
Indeed two reports of donor-derived FL occurring after bone marrow transplantation, [14,18]
including a study from our group, independently showed that this particular cell is long lived, with donors and recipients developing clonally related FL several years after transplant (range
3–10 years). Nevertheless, there are currently no distinctive markers capable of specifically
tar-geting this ancestor. Even if it is plausible that the CPC has retained some properties of healthy GC B cells (i.e. proliferation/differentiation) little is known about the biological features that allow this committed cell to persist for extended periods of time or its role in lymphomagenesis.
In order to determine if we could detect this CPC and to gain insight into the dynamics of clonal evolution of FL tumor cells we investigated the SHM of IgH-VH using a high-through-put technology and DNA extracted from 4 flow-sorted subpopulations, corresponding to 4 dif-ferent stages of B cell maturation, on sequential biopsies from 3 patients. Tumor infiltrating cells were detected in all the four subpopulations investigated and the level of clonality was far
more complex than expected, with the majority of the clones present at frequencies below 10−2.
Lineage tree analysis depicted a picture of a tumor cell population, entrapped in the GC with its SHM capacity intact. This complexity did not change when relapsed or FL transformed cases were compared. Irrespective of the huge number of different tumor related clones, in none of the sorted sub-populations were we able to identify a clone with a pattern of SHM compatible with that of the inferred CPC.
Material and Methods
Patient samples
All biopsies were obtained after written informed consent in accordance with the Declaration of Helsinki and approval from the North East London Research Committee. Tumor samples were selected on the basis of the availability of viable frozen cells and the presence of a clonal
rearrangement of IgH-VH detectable by homo/heteroduplex analysis (HH) [14,19]. In total 9
biopsies from 3 patients were included in the study: two had a pattern compatible with direct
evolution (Fig 1) and one with the existence of a CPC. Seven biopsies were included in the
high-throughput analysis of IgH-VH and seven samples (of which five were overlapping) were studied using a SNP array strategy. All samples carried an IgH-VH3 rearranged major tumor
clone (MC) (Table 1). Additional clinical information is provided inS1 Table.
Isolation and characterization of different B-cells subpopulations
Four different sub-populations were flow-sorted from reactive tonsils and FL biopsies cryopre-served cell suspensions and fluorescently labeled using the monoclonal antibodies:
CD38-PE-Cy7 (clone HB7), CD10-PE (clone HI10a), CXCR4 PE-Cy5 (clone 12G5), IgD biotin (clone IA6-2), (Becton Dickinson; San Jose, CA, USA), CD77 FITC (clone 5B5) and anti-biotin APC (clone Bio3-18E7) (Miltenyi Biotec). Non-viable cells were excluded by simultaneously staining with DAPI (Sigma-Aldrich). Gates to distinguish the different subsets were set using cells suspensions from tonsils and the fluorescence minus one control. By flow sorting using a FACS Aria II (Becton Dickinson) fluorescently labeled cells were separated into four different
subsets (Fig 2). Data acquisition and analysis was performed using DIVA software, version
6.13 (Becton Dickinson). The average purity in each sub-population was>90%. A further
characterization of these populations was performed by staining with CD27 APC (clone M-T271) and CD20 FITC (clone 2H7) antibodies (Becton Dickinson; San Jose, CA, USA), cell
cycle analysis, and Real-Time PCR analysis ofAICDAandmir155h6expression (S1A–S1E
Fig). Briefly, cell cycle analysis was carried out on frozen cell suspensions from tonsils, using
the fixation and permeabilization buffers (eBioscience) and DAPI staining according to the commercial protocol (cells were re-suspended in 1.5mL of 2% FBS/PBS and 3μl of DAPI). RNA was extracted from tonsils and primary FL cell suspensions and the lymphoblastoid cell line NcNc, using the commercial kit RNAeasy Mini Kit (Qiagen). Standard cDNA synthesis was performed using the SuperscriptII Reverse Transcriptase and Random Primers (Invitro-gen), according to the manufacturer's instructions and using 100 ng of RNA per reaction.
Pre-designed TaqMan Gene Expression assays forAICDA,mir155h6and18Sgenes were obtained
from Applied Biosystem.18Swas used as endogenous control. Both the target and the control
genes were run in duplicate. The quantitative PCR was performed using the Taqman 7900HT
Fast Real Time PCR System and the recommended manufacturer’s conditions. Gene
expres-sion values were then calculated using theΔΔCt method.
Preparation of the libraries and pyrosequencing
Genomic DNA was extracted with the DNeasy Blood and Tissue kit (Qiagen, UK).
Thirty-eight libraries, from 32 different samples, (Fig 1) were prepared starting from 20–45 ng of
DNA and using JH consensus and VH3-FR1 primers [19], modified with unique multiplex
identifier (MID) tags (S2 Table). The PCR reaction was performed following a previously
pub-lished protocol [14] with an amended annealing temperature of 61°C and 32 cycles. A control
library was prepared with DNA from the A375 melanoma cell line and primers designed on
the IgH germline locus. [20] In order to check for any bias introduced due to the different MID
sequences used during the amplification, we generated 6 identical libraries performing inde-pendent PCR amplifications using a single set of primers and DNA extracted from the sample
R8403NS and 2 different libraries using the sample R1381NS and 2 different primers (S2
Table). Thirty-eight amplicons (24 from flow-sorted sub-populations, 13 from NS samples and 1 control library) were purified and then pooled and sequenced using the Roche 454 Life
Sci-ences Genome Sequencer FLX, following the manufacturer’s instructions for the Titanium
High-density SNP array
Five hundred ng of DNA, from sequential FL/t-FL biopsies (5 samples for pt1 and 2 for pt2) and from peripheral blood collected at the time of remission (pt1) were prepared and hybrid-ized to Affymetrix Genome-Wide Human SNP Array Version 6.0 (Affimetrix, Santa Clara, CA, USA) according to the manufacturer's recommendations. Signal copy number variation (CNV) analysis was performed using the in house Genome Orientated Laboratory File (GOLF)
platform. The IgH, IgL (κandλ) loci (14q32, 2p11 and 22q11.2), the T cell receptor (TCRα,
TCRβ, TCRδand TCRγ) loci (14q11.2, 7q34 and 7p14) and sex chromosomes were excluded
from the analysis. CNV for samples from pt2 (for which a germline sample was not available) was determined based on the log2 ratio of signal intensity from each lymphoma sample versus the pooled signal intensity of 16 unrelated control DNA samples.
Data analysis
The sequential steps involved in the analysis of 454 reads are shown inS3 Fig. Tumor related
reads (defined as the reads identical to the MC plus those sequences that based on the IgH-VH mutation pattern were clonally related) were identified according to the sequences detected by HH analysis. Sequences were separated according to each MID barcode and exported
consider-ing the first 8 bases of the sequence correspondconsider-ing to the first 8 bases of the primer (i.e. the 4–5
bases of the barcode plus the 3–4 bases of the IGH primer) and a sequence length>60 bases.
Data generated from the A375 melanoma cell line were used to distinguish genuine SHM from
artifacts according to a previously published algorithm [20]. Reads captured at least twice
(either forward and reverse or only forward or reverse) that after manual examination of the pyrograms (Staden 2.0) showed a high quality trace were included in the study. Clones with SHM falling outside the IgH-VH region (DH-JH) (19% of total, range 0%- 65%, in R9129 ME and R0012 PGC respectively) and clones with a homology to the germline sequence higher than 90% (less than 1% of total) were excluded from the subsequent analysis. The IgH-VH
reads were analyzed using IMGT/V-QUEST (http://www.imgt.org/). Sequences were aligned
with ClustalW2 (http://www.ebi.ac.uk/Tools/msa/clustalw2/) and lineage trees generated using
IgTree [21]. During the reconstruction we restricted alignment and analysis to the IgH-VH
region. Amplicon sequences can be downloaded from the European Nucleotide Archive (ENA) using the accession number PRJEB9334.
Results
High-throughput sequencing analysis of flow-sorted B cells
sub-populations
FL is a GC tumor and consists of an oligoclonal population. Taking advantage of this feature we decided to explore the complexity and to trace the clonal evolution of this disease over time by investigating the IgH-VH region in the whole tumor as well as in the selected sub-popula-tions, using a high throughput sequencing strategy. We examined the IgH-VH repertoire in 7 lymph node biopsies, from three patients selected as showing patterns of direct evolution (pt1
and pt2) and CPC (pt3) (Fig 1A and 1B). In total 37 libraries (from 32 different samples)
sequence as black circles and the putative CPC sequence as a dashed grey circle. The 2 samples not included in the deep sequencing of IgH-VH gene are depicted as dotted circles. Each vertical arrow represents a line of therapy; the left hand vertical bar shows the time of diagnosis and the right hand vertical bar the time of death. FL = Follicular Lymphoma; t-FL = transformed Follicular Lymphoma; WW = watch and wait.
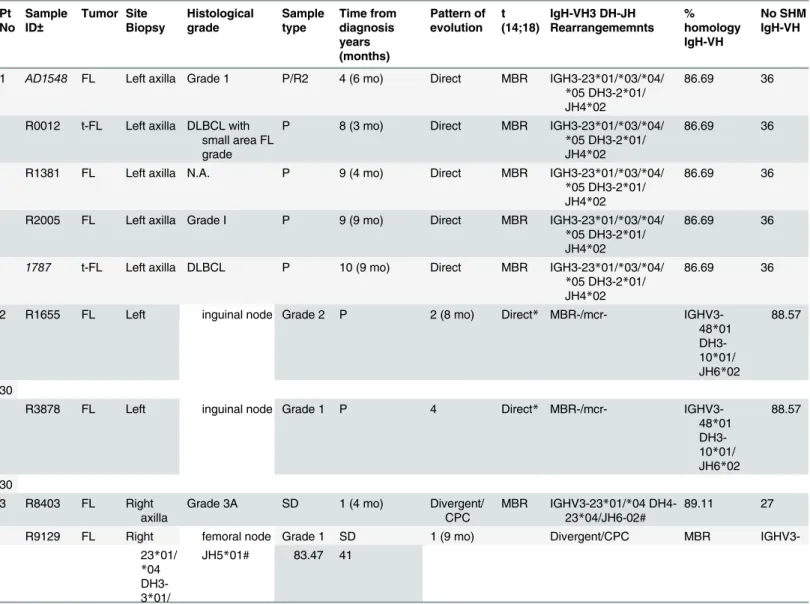
Table 1. Clinical and molecular features of the 3 patients investigated by high-throughput sequencing. Pt No Sample ID± Tumor Site Biopsy Histological grade Sample type Time from diagnosis years (months) Pattern of evolution t (14;18) IgH-VH3 DH-JH Rearrangememnts % homology IgH-VH No SHM IgH-VH
1 AD1548 FL Left axilla Grade 1 P/R2 4 (6 mo) Direct MBR IGH3-23*01/*03/*04/
*05 DH3-2*01/ JH4*02
86.69 36
R0012 t-FL Left axilla DLBCL with small area FL grade
P 8 (3 mo) Direct MBR IGH3-23*01/*03/*04/
*05 DH3-2*01/ JH4*02
86.69 36
R1381 FL Left axilla N.A. P 9 (4 mo) Direct MBR IGH3-23*01/*03/*04/
*05 DH3-2*01/ JH4*02
86.69 36
R2005 FL Left axilla Grade I P 9 (9 mo) Direct MBR IGH3-23*01/*03/*04/
*05 DH3-2*01/ JH4*02
86.69 36
1787 t-FL Left axilla DLBCL P 10 (9 mo) Direct MBR IGH3-23*01/*03/*04/
*05 DH3-2*01/ JH4*02
86.69 36
2 R1655 FL Left inguinal node Grade 2 P 2 (8 mo) Direct* MBR-/mcr-
IGHV3-48*01 DH3-10*01/ JH6*02
88.57
30
R3878 FL Left inguinal node Grade 1 P 4 Direct* MBR-/mcr-
IGHV3-48*01 DH3-10*01/ JH6*02
88.57
30
3 R8403 FL Right
axilla
Grade 3A SD 1 (4 mo) Divergent/
CPC
MBR IGHV3-23*01/*04 DH4-23*04/JH6-02#
89.11 27
R9129 FL Right femoral node Grade 1 SD 1 (9 mo) Divergent/CPC MBR
IGHV3-23*01/
*04 DH3-3*01/
JH5*01# 83.47 41
Three patients, 2 showing a pattern compatible with a direct evolution and 1 consistent with the existence of a CPC, all having a IgH-VH3 family clonal rearrangement were included in the study.
Samples AD1548 and 1787 from pt1, shown in italic, were not included in the high-throughput sequencing analysis of IgH-VH but only in the SNP CNV study.
±
The sample ID corresponds to the cell suspension vial ID or DNA identification number.
P = progression, R = relapse, SD = stable disease; subsequent number relate to episode e.g. R2 = second relapse N.A. = not available SHM = somatic hypermutation
FL = Follicular Lymphoma; t-FL = transformed Follicular Lymphoma MBR stands for Major Breakpoint Region and mcr for minor cluster region
*Pt2 has 2 different mutations at the same base (a pattern compatible with direct evolution)
#Samples R8403FL1 and R9129FL2 had 2 different DH/JH rearrangements but when aligned they showed the a similar CDR3 region, with additional 21
insertions in the sample R8403FL1 (seeS6 Fig)
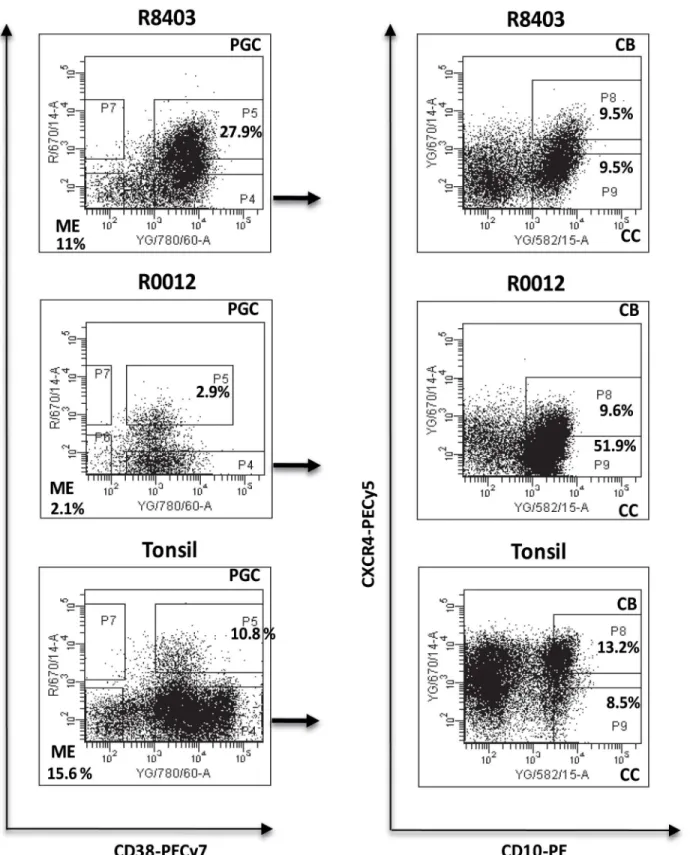
Fig 2. Flow-sorting of the 4 different B cell sub-populations.Lymph nodes cell suspensions from sequential biopsies obtained from patients with FL/t-FL were stained and sorted in 4 different populations according to the expression of IgD, CD38, CD10 and CXCR4. ME: IgD-CD38-; PGC: IgD+CD38+, CB: IgD-CD38+CD10+CXCR4+; CC: IgD-CD38+CD10+CXCR4-. Flow-cytometric identification of the 4 sub-populations in the sample R8403, patient 3 (top), sample R0012, patient 1 (middle) and tonsils (bottom). In the 2 patients samples the numbers indicate the percentage of the gated and sorted subsets whilst in the tonsil example the numbers are representative of 8 independent experiments on as many different biopsies.
obtained from the whole biopsy (Not Sorted sample, NS) and from 4 distinct flow-sorted popu-lations (pre-germinal center (PGC) (IgD+CD38+) centroblasts (CB) (IgD+CD38+CD10 +CXCR4+), centrocytes, (CC) (IgD+CD38+CD10+CXCR4-) and memory enriched (ME)
(IgD-CD38-) were prepared (S2 TableandFig 2). As the conventional CB marker CD77 has
been reported as an unreliable discriminator of CB and CC [22,23] we used instead the more
recently described marker CXCR4 [23,24]. To confirm the ability of CXCR4 to distinguish
between CB and CC we performed a cell cycle analysis on cells suspensions from tonsils and we observed a significant higher number of cells cycling (S/M phase) in the CB sub-population (IgD-CD38+CD10+CXCR4+) as compared to the CC (IgD-CD38+CD10+CXCR4-) (p = 0.01) (S2C Fig); in addition, by real Time Quantitative PCR, we detected an average 7 fold increased
level of AID transcript in the CB and 6.5 fold increase ofmir155h6in CC from tonsils and FL
cell suspensions (S1D Fig), confirming an enrichment of the 2 sub-populations. The staining of
the ME (IgD-CD38-) sub-population with the conventional human marker for memory cells
CD27 showed that more than 50% of these cells expressed this marker (S1B Fig). No
associa-tion was observed between the percentage of flow-sorted CB and the histological grade of the
biopsies (Table 1).
Our sequencing approach produced937,000 sequences (average per library:31,200;
range 16,372–132,147). Good quality sequences were generated in 35 of these libraries whereas
two (R20012NS and R0012CC CD77-) failed the filtering process (S2A Fig). As expected, the
highest number of reads was obtained from the R8403NS library prepared performing 6 inde-pendent amplifications. To ensure detection of all tumor subclones we utilized VH3 family oli-gonucleotides rather than tumor specific primers; therefore we observed a heterogeneous level of contaminating sequences from normal B cells ranging between 23% (R2005NS) to 91%
(R0012PGC) (Fig 3A). We did not find any correlation between the amount of DNA (or
num-ber of cells) used in the preparation of each library and the final numnum-ber of tumor related reads generated (Spearman correlation coefficient r = -0.3, p = NS) or the numbers of clones detected (Spearman correlation coefficient r = -0.2, p = NS). These data suggest that the diversity observed reflects the load of tumor infiltrating cells and is not a consequence of errors intro-duced during the preparation of the libraries or the pyrosequencing process.
Analysis of tumor related clones
Tumor related clones were observed in the CB and CC sub-populations but also in the PGC
and ME sorted cells (S3 Table); this result is consistent with the presence of CD10 positive cells
(since CD10 is a standard immunodiagnostic marker of FL) not only in the GC compartment
but also in the PGC and ME sorted populations (S1E Fig). Clones identical to the MC
represented70% of the tumor related sequences in 69% (20/29) of the amplicon libraries,
40–70% in 24% (7/29) and less than 40% in the remaining 7% (2/29) (S2B Fig). Compared to
the MC sequences, we detected 812 clones in pt1 (13 libraries), 500 in pt2 (6 libraries) and 975
in pt3 (10 libraries) (Fig 3B). Subclones could be detected down to a frequency of 5x10⁻³
(calcu-lated as number of reads identified in a library versus total number of tumor re(calcu-lated reads).
The prevalence of individual subclones varied by several logs across the libraries (range 10−1/
10−4) and, with the exception of R8403ME, more than 80% were present at a frequency less
than 10−2(Fig 3C). We observed a certain degree of inter-patient variability regarding the type
of clones detected (e.g. more germline related sequences in the PGC populations of pt1 and in the ME library of FL1 R8403 from pt3) and the region targeted by the SHM machinery (35% of subclones identified in pt1 displayed SHM in the DH-JH region versus only 6% in pt3), possi-bly reflecting the different amount of tumor infiltrating cells and the time the biopsies were
Fig 3. High throughput sequencing results and analysis of the tumor related clone.(A) Histogram showing the tumor related reads generated in the 29 different sub-sets that passed the filtering process. In black are shown the not tumor related reads, generated using VH3 family primers (S1 Table), in white the reads identical to the MC and in grey reads that are clonally related to the MC.*indicates the library prepared performing 6 independent PCRs, using the same primer whilst**prepared by performing 2 independent PCR and using 2 different MID primers (B) Histogram showing the number of MC related subclones generated per library.*symbol indicates the library prepared by performing 6 independent PCRs with the same primer whilst**symbol refers to the library prepared by performing 2 independent PCR and using 2 different MID primers. (C) Histogram showing the frequency of the clones per library. The black squares represent the number of clones detected at a frequency between 0.1 and 0.01, the dark grey squares the clones detected at a frequency between 0.01 and 0.001 and the light grey squares the number of clones detected at a frequency between 0.001 and 0.0001.
There were a high number of distinct subclones (range 27% for pt1 to 55% for pt3) shared among libraries from the same biopsy. By looking specifically at these shared and unique reads we observed that in pt1 the majority of these clones resided in the more mature B cell
popula-tions CB/CC/ME whilst in pt3 these belonged to the PGC/CB/CC sub-populapopula-tions (S4A–S4G
Fig). These features suggest that the subclones detected in pt1 may be enriched in a more
differ-entiated tumor population, trapped in the GC for longer or alternatively that had been re-circu-lating several times through the same lymph node.
The dominant MC was detected in sequential biopsies from all cases. The sequential biop-sies obtained from pt1 displayed the same MC in all samples investigated and showed 17 sub-clones, more or less mutated compared to the MC, that co-segregate with the dominant clone (total prevalence ranging from 0.0001 to 0.16) However we could not detect a consistent pat-tern of clonal evolution, with 7 clones more prevalent in the first biopsy (R0012-tFL), 6 more
prevalent in the second (R1381 FL1) and 4 more prevalent in the third biopsy (R2005 FL2)(S5
Table). On the contrary for pt2 we detected the MC from FL1 R1655 in the NS and CB libraries from FL2 R3878 (frequency 0.0004 and 0.0026 respectively) and the MC FL R3878 in the FL1 R1655 NS and CB (frequency 0.0002 and 0.0015). When we compared CB and CC libraries from FL1 and FL2 samples from pt2 we detected 5 additional clones apart the 2 MC that were
shared between the 2 biopsies (prevalence range 0.0003–0.0688) The prevalence for all these
sub-clones was higher in the second biopsy (S5 Table). In pt3 we identified in 3/5 libraries
from the FL1 R8403 samples (PGC, ME and NS) an identical clone to FL2 R9129 MC and one with 1 additional SHM at a frequency between 0.0003 and 0.002. In addition we observed in 4/ 5 libraries from FL2 R9129 (PGC, CC, ME and NS) a clone identical to the FL1 R8403 and one with 1 more SHM (in NS) at a frequency ranging between 0.003 and 0.007. These results fit with the hypothesis that several minor subclones have the capacity to evade treatment and repopulate the tumor bulk at relapse or transformation.
Lineage trees analysis
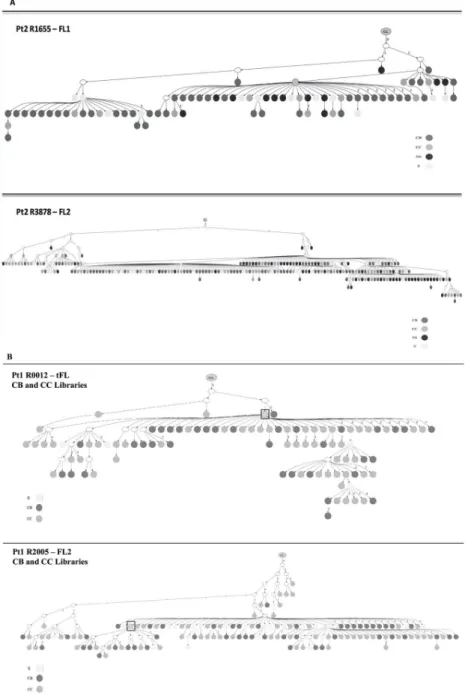
To understand the dynamics associated with the maturation of lymphoma cells in secondary lymphoid organs we reconstructed lineage trees from sequence data obtained from individual and from combined libraries; these latter trees, denoted merged trees, were generated using
reads detected in more than one sub-population and in the whole tumor sample (Fig 4A and
4BandS5A–S5D Fig).
We observed lineage trees with long trunks (for merged trees, average 23, range 19–31, from
samples FL1 R8403 and tFL R0012 respectively), suggestive of the existence of a B cell that had already undergone several rounds of mutation and differentiation before becoming FL and com-pact but wide branches indicative of an oligoclonal FL population trapped in a narrow stage of maturation, capable of undergoing SHM but unable to further differentiate. Because of the
hetero-geneity observed in the PGC and ME sub-populations from pt1 and pt3 (S4 Table) and due to the
lack of PGC and ME libraries from pt2, we decided to focus our analysis on the CB, CC and NS compartments. There seemed to be no difference in the architecture of the trees and the distribu-tion of the subclones among CB, CC and NS individual trees from the same patient. In all samples investigated we observed a rise in the level of complexity when merged trees were generated. Indeed, whilst in the lineage trees generated from individual libraries the MC maps upstream to the majority of the minor subclones, in the merged trees this clone may move to the bottom of the
tree and have a reduced number of descendants (Fig 4B,S5A–S5C Fig). Therefore, it appears that
an understanding of the clonal architecture is improved by an increased number of sequences. When merged trees from individual biopsies were drawn the CB and CC sub-clones did not
4BandS5C Fig). We did not observe any difference between merged trees generated from the
GC (CB/CC) populations from t-FL and FL samples from pt1 (Fig 4B), or when we compared
the merged trees from pt1 (showing a direct evolution pattern and only post-treatment samples included in the analysis) with those from pt3 (displaying a CPC pattern and 2 pre-treatment Fig 4. Merged Lineage Trees showing the dynamics of evolution of the sub-clones.(A) Merged lineage trees generated from the 2 biopsies R1655 FL1 and R3878 FL2 from pt2. G.L. means germline; the dark grey circles represent the CB clones, the medium grey circles the CC, the light grey circles the clones shared (S) among 2 or more populations and the black circles those from the not sorted (NS) whole biopsy. (B) Merged lineage trees obtained from the combination of the CB and CC libraries from the samples R0012 t-FL and R2005 FL2 from pt1. The dark grey circles represent the CB subclones, the medium grey circles the CC and the light grey circles the clones shared (S) by CB and CC. The white circles represent subclones not detected with the 454 sequencing. Squares highlight the MC.
samples) (S5B Fig). These results suggest that these features are intrinsic to the FL B cell population.
Pt2 displayed a pattern compatible with a direct evolution when analyzed by the heterodu-plex analysis, whereas analysis of the merged tree using subclones generated by high through-put sequencing from both biopsies clearly showed a pattern more consistent with a CPC, with the two MC clones mapping on two separated branches and few clones from the FL2 R3878
sample mapping on the same branch of FL1 R1655 clones (S4D Fig). Pt3 also showed a CPC
profile, but in this case the two dominant clones (with their corresponding minor subclones) mapped on 2 distant forks of the trees (upstream in the FL1 R8403 and downstream in the FL2 R9129). Interestingly, it was not possible to identify clones with a sequence identical to or with a pattern of SHM similar to the inferred CPC in any of the libraries from these 2 patients.
Genome wide SNP array of sequential biopsies
The analysis of genomic copy number variation (CNV) represents an alternative method that
our group [16] and others [17] have used to trace the evolution of tumor clones associated with
FL at relapse or transformation. To test whether the CNV pattern was concordant with the pro-file detected by IgH-VH deep sequencing and in order to identify genomic events characteristic of the FL/t-FL samples, a genome wide analysis using the Affymetrix SNP 6.0 array was per-formed on the FL/t-FL samples from pt1 and pt3. For pt1 two additional samples (AD1548
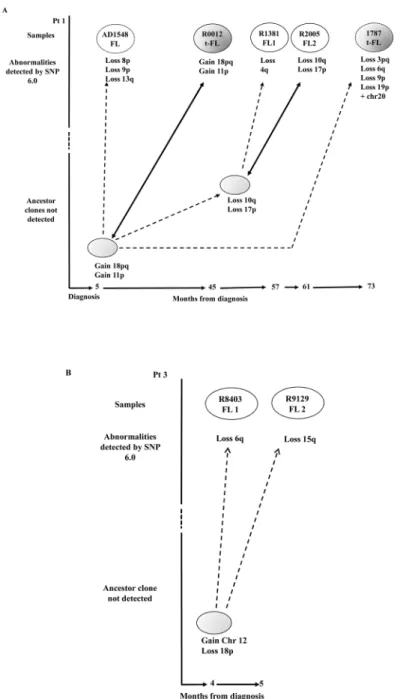
and 1787) were also included (Figs1Aand5A). In pt1, who displayed a pattern compatible
with a direct evolution, we observed two samples (t-FL R0012 and FL R2005) with fewer CN changes as compared to the immediate preceding biopsy and identical to those of predicted
progenitor clones (Fig 5A); this non-linear CPC pattern is consistent with a model of clonal
selection and assumes the presence of subclones that persist over time and may become domi-nant under certain selection pressures such as therapy. Instead, the SNP 6.0 array results of pt3 confirm the existence of a CPC with 2 CNV gains of the entire chromosome 12 and loss of 18p (Fig 5B). This CPC subsequently acquired a further loss of 6q detected in the R8403 FL biopsy and a loss of 15q in the R9129 FL biopsy.
Discussion
FL is an indolent disease characterized by the clonal expansion of mature B cells from GC of
secondary lymphoid organs. Several studies of sequential biopsies from the same patient [6,7,
14,15,17,25,26] and two published BMT models [14,18] revealed the existence of at least two
patterns of clonal evolution: direct, through the acquisition of additional mutations over time,
and divergent, in which a less differentiated CPC gives rise to different tumor clones [14,27].
Recent published NGS studies have established that mutations in several genes involved in
his-tones modification [8] play key roles in the early stages of clonal evolution of FL, but little is
known regarding the degree of entanglement of FL cells and the dynamics of emergence and disappearance of tumor related variants. Here, for the first time, we attempt to micro-dissect the complexity of FL clones, investigating whole biopsies and selected B cells belonging to dif-ferent stages of maturation from sequential FL/t-FL samples, using IgH-VH as marker and the 454 sequencing technology.
As in other cancers [20,28], this technology has proven to be very effective in detecting rare
variants. Indeed, by simultaneously investigating the whole biopsy and selected sub-popula-tions we increase significantly the number of unique tumor related clones detected per biopsy,
typically at a frequency below 10−2(Fig 3C). The presence of such a large number of variants,
Fig 5. Models of clonal evolution developed by the CNV analysis.FL and t-FL samples are represented in white and dark grey ovals respectively. The CNVs occurring at each stage are shown below the ovals. (A) In pt1 two additional samples (AD1548 FL and 1787 t-FL) that were not investigated during the 454 deep sequencing experiments were analyzed and are shown as dotted ovals. We observed a model of clonal selection, where more primitive ancestor cells not detected in the first biopsy (depicted in light grey) later become the R0012 t-FL and R2005 FL dominant clones. The time course between clinical episodes (bottom) indicates that these precursor cells can persist for many months before disease presents clinically. The dotted arrows represent the evolution from an ancestor subclone into a more mutated tumor cell, whilst the bold arrows show the emergence of an ancestor cell, by clonal selection, identical to the R0012 t-FL and R2005 FL respectively. (B) In pt3 we observe a model of divergent evolution. The more primitive progenitor cell (light grey oval) has already acquired 2 CNV and subsequently acquires the loss of 6q and the loss of 15q arms captured within the R8403 FL1 and R9129 FL2 tumors respectively.
additional mutations increasing the risk of subsequent relapse or transformation. Despite the high number of subclones detected in the different sub-populations, we were not able to line-arly stratify the tumor clones according to the conventional B cell differentiation pattern. In particular, when we focused on the SHM profile of the PGC and the ME compartments from pt1 and pt3 we observed a high level of heterogeneity across the samples, in terms of homology to the germline VH gene and number of SHM in the DH-JH region, across the different
sam-ples (S4 Table). A possible explanation for such variability may be the lack of expression of the
conventional B cell markers on the surface of tumor cells, the use of CD27 and IgD to sort PGC and ME sub-populations, or a possible cross-contamination during the flow-sorting.
The investigation of the IgH-VH SHM patterns and clonal relationships provided insight into the transition from normal to malignant B cells. We observed lineage trees with a structure consistent with a long mutational history and high intraclonal diversification. A qualitative analysis of merged trees generated using CB and CC subclones from the same biopsy showed that these two populations do not map on separated branches or sides of the same lineage tree but instead are mixed and scattered throughout. The identification of increased expression of
AICDAin the CB andmir155h6in the CC compartments, in combination with the detection
of a greater percentage of cycling cells in the CB compartment (S1C and S1D Fig) suggest that
any potential contamination between the 2 compartments is at a level below the sensitivity of the RQ-PCR assay and confirms previous published data, generated using a multiphoton laser-scanning microscopy technology that show a continuous interplay between these two
sub-pop-ulations. [29,30] The detection of an increased number of CD10 positive cells in both the PGC
and ME compartments from FL samples, as compared to tonsils and t-FL (S1D Fig) is
consis-tent with the detection of tumor clones within all our sorted populations and fits with the recent mouse models describing B memory cells being able to circulate and disseminate not
only in peripheral blood but also in lymphoid organs.[31]
The simultaneous comparison of sequential biopsies from the same individual and from dif-ferent patients is crucial for understanding the patterns of clonal evolution. Of note, we observed no difference in the shape of the lineage trees or distribution of the subclones across the libraries, suggesting that precursor lymphoma B cells continue to follow the dynamics of non malignant B cells, in all the FL and t-FL samples analyzed.
Despite the elevated number of unique variants detected across all the libraries we were not
able to identify a sequence compatible with the putative CPC. Our group and others [14,17]
have previously suggested that such cells may be present either below the levels of detection or may have left the lymph node entirely. The first model is compatible with the pattern observed in pt2. In this case the merged lineage trees showed that the two tumors were related by an ancestor cell that was not itself detected during the 454 sequencing. Since both biopsies were excised from the same location (left inguinal biopsy) and the two MCs displayed a closely related pattern of SHM, we may hypothesize that this CPC still co-exists within the tumor pop-ulations, but at a level below even the sensitivity of detection here. The presence of 5 sub-clones
apart the two MC in both the biopsies, at higher prevalence in the second biopsy (S5 Table)
suggests that other clones, apart the MC are capable of surviving treatment. The second model perfectly depicts the scenario observed in pt3. In this case the biopsies were excised from two
distinct lymph nodes (right axilla, FL1-R8403 and right femoral node, FL2-R9129) (Table 1).
Merged lineage trees clearly showed that the MC and tumor related clones from FL1 preceded the FL2 tumor populations and were related by a CPC, that was not detected). However, when we extended the sequence analysis to the DH-JH region and to the tumor specific t(14;18) rear-rangement we identified 21 insertions in the FL1 N1 and N2 regions of CDR3 as compared to
FL2 R9129, and an identical BCL2/IgH rearrangement, carrying a mutation in the 3’of BCL2
precursor cell that migrated from one lymph node to the other where the two lymphomas developed independently. However by SNP profiling the R8403 and R9129 FL samples we
observed two copy number variations in common between the two biopsies (Fig 5B) suggestive
of an ancestor that had already acquired some genomic lesions. The inability of this putative cell to proliferate and develop into overt lymphoma is consistent with the latency observed in
the BMT model [14,18] and fits with the model of an immune-system capable of regulating
the pace of FL and restraining the expansion of the CPC. [32,33] The detection of the 2 MCs
in both the biopsies (S6B Fig), albeit at very low levels, can be explained by the ability of FL
cells to leave the original GC and migrate to other lymphoid organs.
Interestingly the pattern of evolution observed in pt1 was more complex and the sequencing strategy revealed a direct evolution pattern, unraveling the existence of an identical common dominant clone in each of the biopsies tested (t-FL R0012, FL1 R1381 and FL2 R2005) amongst a pool of 17 additional clones, either more mature or immature compared to the MC. Con-versely, the SNP 6.0 genotyping data supported a CPC pattern compatible with the selection of subclones over a period of 6 years that were not detected in the first biopsy investigated, but, according to the CNV data, were inferred to have existed in earlier biopsies. These apparently discordant results may reflect the different sensitivity of the techniques, with IgH-VH profiling, the complexity of the tumor populations following the physiological mechanism of SHM of the
IgHgene and the SNP 6.0 array depicting a snapshot of clonal genetic aberrations present in
the whole biopsy. It is not yet clear whether clones defined according to the pattern of SHM share any of the lesions observed by SNP profiling and could represent the rare variant not detected at diagnosis becoming the dominant clone at relapse and transformation. Recently by using a genome sequencing approach and simultaneously analyzing different genetic muta-tions detected in paired FL-tFL samples, our group has shown the existence of a CPC pattern in all the samples investigated and re-defined the patterns of evolution observed as a "sparse" CPC with very little mutations shared by FL and t-FL and a "rich" CPC, with high clonal
resem-blance between the two paired samples [6].
The high-throughput sequencing analysis of the IgH-VH gene performed on different sorted sub-populations corresponding to different stages of B cell maturation did not prove to be suc-cessful in terms of identification of distinct clonal populations but captured a hitherto unre-ported level of tumor cell diversity. Our observations demonstrate the existence of an entangled architecture in FL, with different tumor clones able to evolve following diverse patterns. The investigation of different sub-populations showed an increase in the level of intermingling of the tumor related clones but not a change in the lineage trees' architecture. This, in combination with the lack of detection of a CPC, suggests that this precursor (defined by IgH-VH) may have acquired additional SHM and therefore display a more mutated IgH-VH from the one pre-dicted. The comparison of sequential samples has unraveled some rare variants that evade treat-ments and co-segregate with the MC (17 subclones in pt1 and 5 in pt2). The contribution of these cells to the formation and evolution of FL is still unknown, but as observed by SNP 6.0 profiling of samples from pt1, the possible existence of rare variants, that becomes dominant at relapse or transformation, strengthen the importance of eradicating all tumor related cells at first treatment. The discordant patterns observed in pt1 also highlight the importance of includ-ing multiple sequential samples from the same patient and all the somatic mutations detected in
the tumor when tracing the pattern of disease clonal evolution. As for other malignancies [34,
35], such genetic heterogeneity within the tumor population may represent a major challenge
observed an evolution of the lymphoma clones following similar dynamics to that observed
when metastatic solid tumors are simultaneously investigated. [36,37] Future data coming from
NGS of selected tumor sub-populations from different anatomical compartments and single cell analysis will allow us to capture the complexity of the genetics of FL in its entirety and offer the possibility to identify and characterize the cell of origin of FL.
Supporting Information
S1 Fig. Flow Characterization of the 4 sub-populations investigated by high-throughput sequencing.(A) Staining with CD20. Cell suspensions from tonsils were stained with the same antibodies used for flow-sorting (IgD, CD38, CD10 and CXCR4) plus CD20-FITC. Data shown are representative of experiments performed on 6 different tonsil samples. IgD-CD38- population
20.5% (range 10–32%); IgD-CD38+ population 4.2 (range 2.0–9.2%); IgD-CD38+CD10+CXCR4
+ (range 0.6–14.6%); IgD-CD38+CD10+CXCR4- population 8.6 (range 1.6–14.2%). (B): Staining
of the IgD-CD38- sub-population with the antibody CD27. Tonsil cell suspensions were stained for the indicated surface molecules and analyzed by flow cytometry. The antibody IgD-PE was
used instead of IgD-APC. Data are representative of 6 different samples. (range 38.8–80.7%) (C)
Cell cycle analysis in the CB (IgD-CD38+CD10+CXCR4+) and CC (IgD-CD38+CD10+CXCR4-) subsets, defined using IgD-FITC, CD38-PECy7, CD10-PE and CXCR4-APC antibodies. The percentage of cells in the S/M phase is representative of 3 independent experiments and p was cal-culated using t-test. The flow-cytometry analysis was performed with FlowJo software. (D) Expression of AID (on the top left) and microRNA-155 (on the top right) in the CB (CXCR4+) and CC (CXCR4-) GC subpopulations from patients and tonsils. Results are representative of 5 different FL and 3 tonsils cell suspensions samples for AID and of 4 FL and 3 tonsils for micro-RNA155. Results of Real Time PCR analysis are expressed relative to gene expression detected in cells from the lymphoblastoid cell line NcNc and as a fold changes (at the bottom), calculated as
fold change expression of AID transcripts from CBvsCC and microRNA155 transcripts detected
in CC vs CB. As expected, AID and microRNA155 are inverted regulated in the CB and CC
pop-ulations, with AID (AICDA) being 7 times more expressed in the CB compartment and
micro-RNA155 (mir155h6) being 6.5 times more expressed in the CC sub-set. (E) Percentage of CD10
positive cells in tonsils, FL and t-FL samples. An increased percentage of CD10 positive cells was
detected in the PGC (Kruskal-Wallis test p = 0.049, Dunn’s Multiple Comparison Test p = NS)
and in the MEsub-populations (Kruskal-Wallis test p = 0.0117, Dunn’s Multiple Comparison
Test: tonsils vs FL p<0.05, tonsil vs t-FL and FL vs t-FL = NS). The analysis was performed on
cell suspensions from tonsils (7 samples), FL (6 samples) and t-FL (4 samples). (ZIP)
S2 Fig. Total reads and tumor related reads.(A) Histogram of the number of reads generated per library; in black are shown all the reads generated with Roche 454 GS-FLX Titanium and in white the corresponding sequences that passed the filtering control. (B) Histogram showing the percentage of tumor related reads (defined as all the reads identical to the sequence of the dominant clone plus those that according to the SHM pattern are clonally related) per library. The two dotted arrows separate the libraries in 3 different groups: first group, with MC making
up for>80% of tumor related reads, second between 40–80% and last group with MC reads
being<40% of total tumor reads.
(TIF)
S3 Fig. Flowchart of the different steps involved in the generation of the final reads included in the analysis.
S4 Fig. Schematic representation of the shared and unique clones detected in the NS and sorted sub-populations from pt3 and pt1.(A) R8403 NS sample, (B) R8403 sub-populations, (C) R9129 NS, (D) R9129 sub-populations, (E) R0012 sub-populations, (F) R2002 NS sample and (G) R2005 sub-populations. The pie graphs show the percentage of unique clones (dark grey), clones shared with the NS sample (medium grey) and clones shared with other sub-pop-ulations from the same biopsy (light grey). The Venn diagrams depict number of unique and shared clones between two, three, four or five (in the case of the NS sample) different libraries. According to the Venn diagram we observed that the majority of clones in the samples from pt3 belonged to the PGC, CB and CC subpopulations, whilst those from pt1 to the CB, CC and ME sub-sets. When we evaluated the prevalence of shared sub-clones within a sub-population we could not discriminate a consistent pattern of evolution.
(TIF)
S5 Fig. Merged Lineage trees.(A) Lineage trees generated from the R2005 FL2 biopsy from pt. G.L. means germline; the dark grey circles represent the CB clones, the medium grey circles the CC, the light grey circles the clones shared (S) among 2 or more populations and the black cir-cles those from the not sorted (NS) whole biopsy. The square depicts the MC. (B) Lineage trees generated from the different libraries of R8403 FL1 and R9129 FL2 from pt3. On the top, the dark grey circles represent the CB subclones, the medium grey circles the CC, the light grey cir-cles shared clones and the black circir-cles the clones detected in the PGC and NS libraries. The squares depict the MC from the biopsy while the dotted rectangles the MC and the clones iden-tical to the MC plus 1 SHM from the other biopsy (C) Merged lineage trees obtained from the CB and CC libraries from the sample R8403 FL1 from pt3. The dark grey circles represent the CB subclones, the medium grey circles the CC and the light grey circles the clones shared (S) by CB and CC. (D) Merged lineage trees from not sorted NS libraries from the samples R1655 FL1 and R3878 FL2 from pt2. The dark grey circles represent the shared clones (S), the medium grey circles the R3878 NS clones, the light grey circles the R1655 NS clones and the black circles the 2 MCs. The white circles represent subclones not detected with the 454 sequencing. Squares highlight the MCs samples.
(TIF)
S6 Fig. Characterization of the clones detected in pt3.(A) Alignment of the CDR3 region of the IgH-VH3 MC reads from samples R8403 and R9129 from pt3. (B) Comparison of the MBRBCL2/IgHrearrangement from samples R8403 and R9129. (C) Frequency of detection of the R8403MC in the libraries from R9129 and vice versa of the R9129MC in the libraries from R8403.
(TIF)
S7 Fig. Alignment of the MC sequences from pt1 and pt2.Sequences, detected by HH analy-sis, were aligned using ClustelW2. The alignment of the MCs sequences from the samples R0012 t-FL, R1381 FL1 and R2005 FL2 from pt1 (at the top) showed an identical dominant clone in all the 3 biopsies. The alignment of the MC sequences from R1655 FL1 and R3878 FL2 samples from pt2 instead (at the bottom) showed 3 bases mutated. Because all these 3 muta-tions were also different from the germline sequence (germline bases showed in bold on the top) and fall in a hotspot region (data not shown) it is possible that the same clone is mutated twice in the same bases. In both these cases therefore the presence of a pattern of direct evolu-tion cannot be ruled out.
(TIF)
S2 Table. List of samples and sequence of the primers used for the high-throughput sequencing.
(DOC)
S3 Table. Number and % of clones detected in the NS and sorted populations. (DOC)
S4 Table. Characteristics of the PGC and ME sub-populations. (DOC)
S5 Table. Prevalence of the haplotypes shared among the Pt1 samples and Pt2 samples. (DOC)
Acknowledgments
We would like to thank our patients for consenting to the use of their tissue for research and J.
Matthews for retrieving patients’data.
Author Contributions
Conceived and designed the experiments: EC JGG. Performed the experiments: EC DW GR TC. Analyzed the data: EC JM AS PC. Contributed reagents/materials/analysis tools: LH MM SI BY RM. Wrote the paper: EC JF JGG. Provided clinical/histopathological data: SH MC.
References
1. Gribben JG. How I treat indolent lymphoma. Blood. 2007; 109(11):4617–26. Epub 2007/02/22. doi:10. 1182/blood-2006-10-041863PMID:17311989.
2. Montoto S, Davies AJ, Matthews J, Calaminici M, Norton AJ, Amess J, et al. Risk and clinical implica-tions of transformation of follicular lymphoma to diffuse large B-cell lymphoma. J Clin Oncol. 2007; 25 (17):2426–33. Epub 2007/05/09. JCO.2006.09.3260 [pii] PMID:17485708.
3. Lossos IS, Gascoyne RD. Transformation of follicular lymphoma. Best Pract Res Clin Haematol. 2011; 24(2):147–63. Epub 2011/06/11. S1521-6926(11)00013-2 [pii] doi:10.1016/j.beha.2011.02.006PMID: 21658615; PubMed Central PMCID: PMC3112479.
4. Strasser A, Harris AW, Bath ML, Cory S. Novel primitive lymphoid tumours induced in transgenic mice by cooperation between myc and bcl-2. Nature. 1990; 348(6299):331–3. Epub 1990/11/22. doi:10. 1038/348331a0PMID:2250704.
5. Mamessier E, Song JY, Eberle FC, Pack S, Drevet C, Chetaille B, et al. Early lesions of follicular lym-phoma: a genetic perspective. Haematologica. 2014; 99(3):481–8. Epub 2013/10/29. doi:10.3324/ haematol.2013.094474PMID:24162788; PubMed Central PMCID: PMC3943311.
6. Okosun J, Bodor C, Wang J, Araf S, Yang CY, Pan C, et al. Integrated genomic analysis identifies recurrent mutations and evolution patterns driving the initiation and progression of follicular lymphoma. Nature genetics. 2014; 46(2):176–81. Epub 2013/12/24. doi:10.1038/ng.2856PMID:24362818; PubMed Central PMCID: PMC3907271.
7. Green MR, Gentles AJ, Nair RV, Irish JM, Kihira S, Liu CL, et al. Hierarchy in somatic mutations arising during genomic evolution and progression of follicular lymphoma. Blood. 2013; 121(9):1604–11. Epub 2013/01/09. doi:10.1182/blood-2012-09-457283PMID:23297126; PubMed Central PMCID: PMC3587323.
8. Morin RD, Mendez-Lago M, Mungall AJ, Goya R, Mungall KL, Corbett RD, et al. Frequent mutation of histone-modifying genes in non-Hodgkin lymphoma. Nature. 2011; 476(7360):298–303. Epub 2011/07/ 29. nature10351 [pii] doi:10.1038/nature10351PMID:21796119.
9. Pasqualucci L, Trifonov V, Fabbri G, Ma J, Rossi D, Chiarenza A, et al. Analysis of the coding genome of diffuse large B-cell lymphoma. Nature genetics. 2011; 43(9):830–7. Epub 2011/08/02. ng.892 [pii] doi:10.1038/ng.892PMID:21804550.
11. Anderson K, Lutz C, van Delft FW, Bateman CM, Guo Y, Colman SM, et al. Genetic variegation of clonal architecture and propagating cells in leukaemia. Nature. 2011; 469(7330):356–61. Epub 2010/ 12/17. nature09650 [pii] doi:10.1038/nature09650PMID:21160474.
12. Keats JJ, Chesi M, Egan JB, Garbitt VM, Palmer SE, Braggio E, et al. Clonal competition with alternat-ing dominance in multiple myeloma. Blood. 2012. Epub 2012/04/14. blood-2012-01-405985 [pii] doi: 10.1182/blood-2012-01-405985PMID:22498740.
13. Jiang Y, Redmond D, Nie K, Eng KW, Clozel T, Martin P, et al. Deep sequencing reveals clonal evolu-tion patterns and mutaevolu-tion events associated with relapse in B-cell lymphomas. Genome biology. 2014; 15(8):432. Epub 2014/08/16. doi:10.1186/s13059-014-0432-0PMID:25123191; PubMed Central PMCID: PMC4158101.
14. Carlotti E, Wrench D, Matthews J, Iqbal S, Davies A, Norton A, et al. Transformation of follicular lym-phoma to diffuse large B-cell lymlym-phoma may occur by divergent evolution from a common progenitor cell or by direct evolution from the follicular lymphoma clone. Blood. 2009; 113(15):3553–7. Epub 2009/ 02/10. blood-2008-08-174839 [pii] doi:10.1182/blood-2008-08-174839PMID:19202129.
15. Aarts WM, Bende RJ, Bossenbroek JG, Pals ST, van Noesel CJ. Variable heavy-chain gene analysis of follicular lymphomas: subclone selection rather than clonal evolution over time. Blood. 2001; 98 (1):238–40. Epub 2001/06/22. PMID:11418487.
16. Fitzgibbon J, Iqbal S, Davies A, O'Shea D, Carlotti E, Chaplin T, et al. Genome-wide detection of recur-ring sites of uniparental disomy in follicular and transformed follicular lymphoma. Leukemia. 2007; 21 (7):1514–20. Epub 2007/05/15. 2404696 [pii] doi:10.1038/sj.leu.2404696PMID:17495976.
17. Eide MB, Liestol K, Lingjaerde OC, Hystad ME, Kresse SH, Meza-Zepeda L, et al. Genomic alterations reveal potential for higher grade transformation in follicular lymphoma and confirm parallel evolution of tumor cell clones. Blood. 2010; 116(9):1489–97. Epub 2010/05/28. blood-2010-03-272278 [pii] doi:10. 1182/blood-2010-03-272278PMID:20505157.
18. Weigert O, Kopp N, Lane AA, Yoda A, Dahlberg SE, Neuberg D, et al. Molecular ontogeny of donor-derived follicular lymphomas occurring after hematopoietic cell transplantation. Cancer Discov. 2012; 2 (1):47–55. Epub 2012/05/16. 2159-8290.CD-11-0208 [pii] PMID:22585168.
19. van Dongen JJ, Langerak AW, Bruggemann M, Evans PA, Hummel M, Lavender FL, et al. Design and standardization of PCR primers and protocols for detection of clonal immunoglobulin and T-cell recep-tor gene recombinations in suspect lymphoproliferations: report of the BIOMED-2 Concerted Action BMH4-CT98-3936. Leukemia. 2003; 17(12):2257–317. Epub 2003/12/13. doi:10.1038/sj.leu.2403202 [pii]. PMID:14671650.
20. Campbell PJ, Pleasance ED, Stephens PJ, Dicks E, Rance R, Goodhead I, et al. Subclonal phyloge-netic structures in cancer revealed by ultra-deep sequencing. Proc Natl Acad Sci U S A. 2008; 105 (35):13081–6. Epub 2008/08/30. 0801523105 [pii] PMID:18723673; PubMed Central PMCID: PMC2529122.
21. Barak M, Zuckerman NS, Edelman H, Unger R, Mehr R. IgTree: creating Immunoglobulin variable region gene lineage trees. J Immunol Methods. 2008; 338(1–2):67–74. Epub 2008/08/19. S0022-1759 (08)00233-0 [pii] doi:10.1016/j.jim.2008.06.006PMID:18706908.
22. Hogerkorp CM, Borrebaeck CA. The human CD77- B cell population represents a heterogeneous sub-set of cells comprising centroblasts, centrocytes, and plasmablasts, prompting phenotypical revision. J Immunol. 2006; 177(7):4341–9. Epub 2006/09/20. PMID:16982868.
23. Caron G, Le Gallou S, Lamy T, Tarte K, Fest T. CXCR4 expression functionally discriminates centro-blasts versus centrocytes within human germinal center B cells. J Immunol. 2009; 182(12):7595–602. Epub 2009/06/06. 182/12/7595 [pii] PMID:19494283.
24. Yoshida N, Kitayama D, Arima M, Sakamoto A, Inamine A, Watanabe-Takano H, et al. CXCR4 expres-sion on activated B cells is downregulated by CD63 and IL-21. J Immunol. 2011; 186(5):2800–8. Epub 2011/01/29. PMID:21270405.
25. Ruminy P, Jardin F, Picquenot JM, Parmentier F, Contentin N, Buchonnet G, et al. S(mu) mutation pat-terns suggest different progression pathways in follicular lymphoma: early direct or late from FL progen-itor cells. Blood. 2008; 112(5):1951–9. Epub 2008/06/03. blood-2007-11-124560 [pii] doi:10.1182/ blood-2007-11-124560PMID:18515657.
26. Pasqualucci L, Khiabanian H, Fangazio M, Vasishtha M, Messina M, Holmes AB, et al. Genetics of fol-licular lymphoma transformation. Cell reports. 2014; 6(1):130–40. Epub 2014/01/07. doi:10.1016/j. celrep.2013.12.027PMID:24388756; PubMed Central PMCID: PMC4100800.
27. Martinez-Climent JA, Fontan L, Gascoyne RD, Siebert R, Prosper F. Lymphoma stem cells: enough evidence to support their existence? Haematologica. 2010; 95(2):293–302. Epub 2010/02/09. 95/2/293 [pii] doi:10.3324/haematol.2009.013318PMID:20139392; PubMed Central PMCID: PMC2817033. 28. Guffanti A, Iacono M, Pelucchi P, Kim N, Solda G, Croft LJ, et al. A transcriptional sketch of a primary
1471-2164-10-163 [pii] doi:10.1186/1471-2164-10-163PMID:19379481; PubMed Central PMCID: PMC2678161.
29. Schwickert TA, Lindquist RL, Shakhar G, Livshits G, Skokos D, Kosco-Vilbois MH, et al. In vivo imaging of germinal centres reveals a dynamic open structure. Nature. 2007; 446(7131):83–7. Epub 2007/02/ 03. nature05573 [pii] doi:10.1038/nature05573PMID:17268470.
30. Victora GD, Schwickert TA, Fooksman DR, Kamphorst AO, Meyer-Hermann M, Dustin ML, et al. Ger-minal center dynamics revealed by multiphoton microscopy with a photoactivatable fluorescent reporter. Cell. 2010; 143(4):592–605. Epub 2010/11/16. S0092-8674(10)01236-5 [pii] doi:10.1016/j. cell.2010.10.032PMID:21074050; PubMed Central PMCID: PMC3035939.
31. Sungalee S, Mamessier E, Morgado E, Gregoire E, Brohawn PZ, Morehouse CA, et al. Germinal center reentries of BCL2-overexpressing B cells drive follicular lymphoma progression. The Journal of clinical investigation. 2014; 124(12):5337–51. Epub 2014/11/11. doi:10.1172/JCI72415PMID:25384217; PubMed Central PMCID: PMC4348942.
32. Strothmeyer AM, Papaioannou D, Duhren-von Minden M, Navarrete M, Zirlik K, Heining-Mikesch K, et al. Comparative analysis of predicted HLA binding of immunoglobulin idiotype sequences indicates T cell-mediated immunosurveillance in follicular lymphoma. Blood. 2010; 116(10):1734–6. Epub 2010/ 06/05. doi:10.1182/blood-2010-02-270199PMID:20522710.
33. Dave SS, Wright G, Tan B, Rosenwald A, Gascoyne RD, Chan WC, et al. Prediction of survival in follic-ular lymphoma based on molecfollic-ular features of tumor-infiltrating immune cells. The New England jour-nal of medicine. 2004; 351(21):2159–69. Epub 2004/11/19. 351/21/2159 [pii] doi:10.1056/
NEJMoa041869PMID:15548776.
34. Mullighan CG, Phillips LA, Su X, Ma J, Miller CB, Shurtleff SA, et al. Genomic analysis of the clonal ori-gins of relapsed acute lymphoblastic leukemia. Science. 2008; 322(5906):1377–80. Epub 2008/11/29. 322/5906/1377 [pii] PMID:19039135; PubMed Central PMCID: PMC2746051.
35. Choi S, Henderson MJ, Kwan E, Beesley AH, Sutton R, Bahar AY, et al. Relapse in children with acute lymphoblastic leukemia involving selection of a preexisting drug-resistant subclone. Blood. 2007; 110 (2):632–9. Epub 2007/03/21. blood-2007-01-067785 [pii] doi:10.1182/blood-2007-01-067785PMID: 17371950.
36. Campbell PJ, Yachida S, Mudie LJ, Stephens PJ, Pleasance ED, Stebbings LA, et al. The patterns and dynamics of genomic instability in metastatic pancreatic cancer. Nature. 2010; 467(7319):1109–13. Epub 2010/10/29. nature09460 [pii] doi:10.1038/nature09460PMID:20981101; PubMed Central PMCID: PMC3137369.