Soil Water-Stable Aggregates Content in Semiarid
Regions of Northwest China
Peng Zhang1,2., Ting Wei1,2., Zhikuan Jia1,2
*, Qingfang Han1,2, Xiaolong Ren1,2, Yongping Li3
1The Chinese Institute of Water-Saving Agriculture, Northwest A&F University, Yangling, Shaanxi, China,2Key Laboratory of Crop Physi-Ecology and Tillage Science in Northwestern Loess Plateau, Ministry of Agriculture, Northwest A&F University, Yangling, Shaanxi, China,3Guyuan Institute of Agricultural Sciences, Guyuan, Ningxia, China
Abstract
The soil degradation caused by conventional tillage in rain-fed areas of northwest China is known to reduce the water–use efficiency and crop yield because of reduced soil porosity and the decreased availability of soil water and nutrients. Thus, we investigated the effects of straw incorporation on soil aggregates with different straw incorporation rates in semiarid areas of southern Ningxia for a three-year period (2008–2010). Four treatments were tested: (i) no straw incorporation (CK); (ii) incorporation of maize straw at a low rate of 4 500 kg ha21(L); (iii) incorporation of maize straw at a medium rate of 9000 kg ha21(M); (iv) incorporation of maize straw at a high rate of 13 500 kg ha21(H). The results in the final year of treatments (2010) showed that the mean soil organic carbon storage of the 0–60 cm soil layers were significantly (P,0.05) increased with H, M, and L, by 21.40%, 20.38% and 8.21% compared with CK, respectively. Straw incorporation increased
.0.25 mm water-stable macroaggregates level, geometric mean diameter, mean weight diameter and the aggregate stability, which were ranked in order of increasing straw incorporation rates: H/M . L . CK. Straw incorporation significantly (P,0.05) reduced the fractal dimension in the 0–40 cm soil layers compared with CK. Our results suggest that straw incorporation is an effective practice for improving the soil aggregate structure and stability.
Citation:Zhang P, Wei T, Jia Z, Han Q, Ren X, et al. (2014) Effects of Straw Incorporation on Soil Organic Matter and Soil Water-Stable Aggregates Content in Semiarid Regions of Northwest China. PLoS ONE 9(3): e92839. doi:10.1371/journal.pone.0092839
Editor:Raffaella Balestrini, Institute for Plant Protection (IPP), CNR, Italy
ReceivedJuly 19, 2013;AcceptedFebruary 26, 2014;PublishedMarch 24, 2014
Copyright:ß2014 Zhang et al. This is an open-access article distributed under the terms of the Creative Commons Attribution License, which permits unrestricted use, distribution, and reproduction in any medium, provided the original author and source are credited.
Funding:This work was supported by the China Support Program (2012BAD09B03, 2011AA100504, and 2011BAD29B09) for Dryland Farming in the 12th 5-year plan period, the Youth project of National Natural Science Fund (31201156), and the Basic Science Research Fund in Northwest A&F University (QN2013005). The funders had no role in study design, data collection and analysis, decision to publish, or preparation of the manuscript.
Competing Interests:The authors have declared that no competing interests exist.
* E-mail: jiazhk@126.com
.These authors contributed equally to this work.
Introduction
Soil infertility [1], soil erosion, and water deficiency [2] are the major factors that limited crop growth in semiarid areas of northwest China. The rates of crop straw use for fuel and forage have declined significantly since the 1980s and crop straw is increasingly burned after the harvest, which leads to high losses of soil organic substances [3,4], and increased emission of CO2that
pollute the environment [5]. Furthermore, this practice has led to the degradation of the agricultural ecological environment [6].
The soil organic matter (SOM) content is one of the major factors that affects soil properties and functions including a range of physical characteristics such as the water-holding capacity [7], water infiltration [8], and aggregate stability [9]. SOM is considered to be a major binding agent that stabilizes soil aggregates [10,11]. Soil aggregates are the basic units of the soil structure [12], which are composed of primary particles and binding agents that determine the microbial biomass and mineral nutrient reserves [13–15]. These soil properties are also affected by soil organic matter decomposition processes [16,17].
Many studies have shown that crop straw is rich in organic material and soil nutrients, so it is increasingly considered to be an important natural organic fertilizer [18–20]. Straw can be
incorporated to soil either directly or indirectly, which can promote the production of a favorable soil environment. Straw also maintains the physicochemical condition of the soil and improves the overall ecological balance of the crop production system [20,21]. Nelson [22] and Wilhelmet al.[23] showed that the incorporation of crop residues into soil significantly prevented soil erosion and enhanced the soil quality. Sonnleitneret al. [24] found that straw incorporation also improved the aggregate stability and other soil properties compared with farmyard manure. Mulumba and Lal [25] also reported that the addition of crop residues to cultivated soil had positive effects on the soil porosity, available water content, soil aggregation, and bulk density. Bhagat and Verma [26] showed that the incorporation of crop straws for five years significantly increased the crop yield and improved the soil properties.
straw application rates combined with conventional planting on SOC, the .0.25 mm water-stable macroaggregate rate, and various soil properties in the southern Ningxia region of China.
Materials and Methods
Ethics Statements
The study was carried out on the private land, we rent the farmland from the local farmers, and contracts and deeds are signed. No specific permissions were required in this area to run the experiment as the study sites are farming area without any protection zone, and the farming activities won’t hurt the local animals. And we only plant the grain crop in the field, so the field studies did not involve endangered or protected species.
Site description
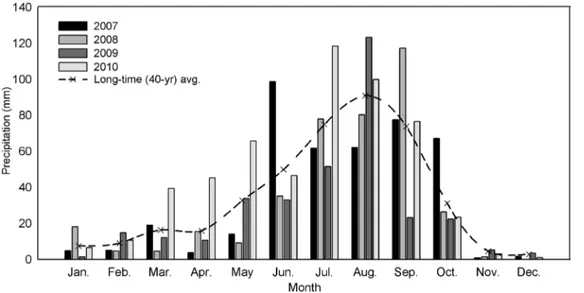
The experiment was conducted between 2008 and 2010 at the Dryland Agricultural Research Station, Pengyang County, Ningxia, China (106u45’N, 35u79’E and 1800 m a.s.l.). The experimental area was in a hilly and gully region of the Loess Plateau, which was characterized by a semiarid, warm temperate, continental monsoon climate. The average annual rainfall was 435 mm, which fell mainly from June to September. The annual mean evaporation was 1050 mm and the annual temperature average was 8.1uC with a frost-free period of 155 days.
Rainfall during the experimental period was measured using an automatic weather station (WS-STD1, England) at the experi-mental site. Monthly precipitation distributions during the experimental period are shown in Fig. 1. The total precipitation for 2008, 2009, and 2010 was 390.9, 335.2, and 537 mm, while the precipitation during the maize-growing season was 362, 298.2, and 476.1 mm, respectively.
The soil at the experimental site was a loessal soil with a pH of 8.5. In the 0–40 cm soil layer, the organic matter, total N, P, and K were 8.32 g kg21
, 0.61 g kg21
, 0.58 g kg21
, and 5.4 g kg21
, respectively, while the available N, P, and K were 46.25 mg kg21
, 10.41 mg kg21
, and 104.82 mg kg21
. In 2007, the site was planted with maize prior to the experiment
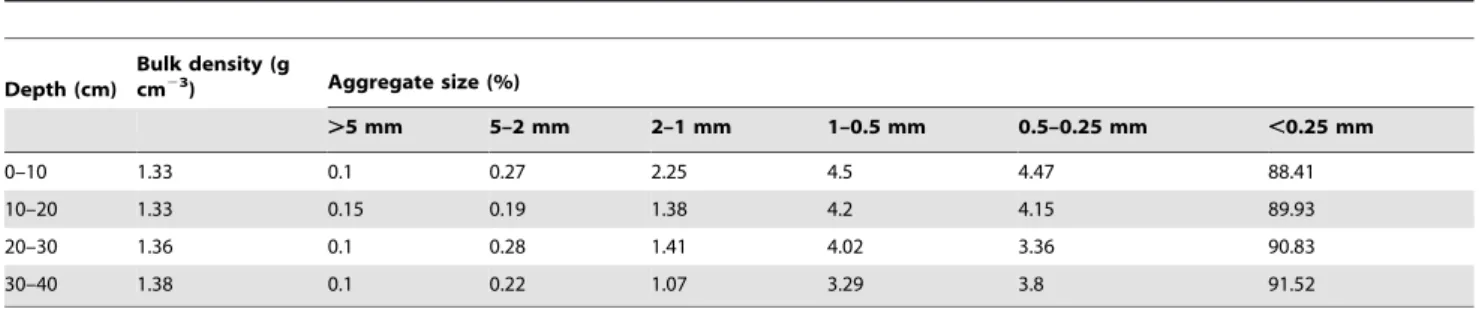
The experimental field was flat and, according to the FAO/ UNESCO Soil Classification [27], the soil was a Calcic Cambisol (sand 14%, silt 26%, and clay 60%) with low fertility. The key
physical properties of the soil layers (0–40 cm depth) are shown in Table 1.
Experimental design and field management
The experiment used a randomized block design with three replicates. Each plot was 3 m wide and 6 m long. The experiment included four straw incorporation rate treatments: (i) no straw incorporation (CK); (ii) incorporation of maize straw at a low rate of 4 500 kg ha21
(L); (iii) incorporation of maize straw at a medium rate of 9000 kg ha21 (M); (iv) incorporation of maize straw at a high rate of 13 500 kg ha21
(H).
The maize straws were mixed manually with the top 25 cm of soil in the field. Before mixing with the soil, the maize straws were chopped into 5 cm pieces and then applied to the soil six months before the crop was planted to facilitate decomposition of the straw. The straw was incorporated into the soil layer on 15 October 2007 and after the crop harvests during 2008–2010.
Ten days before sowing, a basis fertilizer containing 102 kg N ha21
and 90 kg P ha21
, was spread evenly over the each plot and plowed into soil layer. Maize (cv. Shendan 16) was sown at a rate of 5.25 seed m22on 18 April 2008, 15 April 2009 and 20 April
2010 using a holesowing (3 cm in diameter) machine. An additional 102 kg N ha21 was applied as a top dressing in late June. And on 7 October 2008, 5 October 2008, and 10 October 2010. No irrigation was provided during the experimental years. Manual weeding was performed throughout the experiment.
Sampling and measurement
Rainfall data were recorded using a standard weather station located at the experimental site. After the maize harvest in 2008 and 2010, soil samples were collected for the four incorporation treatments. A soil sample was collected from each plot at depths of 0–20 cm, 20–40 cm and 40–60 cm to determine the soil organic matter. A similar soil sample was collected at depths of 0–10 cm, 10–20 cm, 20–30 cm and 30–40 cm to determine the aggregate stability. The soil samples were collected from four points in each plot replicate and mixed to produce a composite sample. Each soil samples was passed through an 8 mm sieve by gently breaking the soil clods, whereas pebbles and stable clods .8 mm were discarded. Soil samples were air-dried for 24 h in the laboratory before analysis.
Figure 1. Distribution of mean monthly precipitation at the experimental site during 2007–2010.
Soil organic carbon was determined by the K2Cr2O7–H2SO4
digestion method, and SOM content was calculated as a portion of SOC which has been described by Wanget al.[28].
OMi~Oi|A ð1Þ
Ci~
di|ri|Oi
10 ð2Þ
whereOMiis the soil organic matter content (g kg21),Oiis the
soil organic carbon content (g kg21
),Ciis the soil organic carbon
storage (Mg C ha21
),diis the soil depth (cm),ri is the soil bulk
density (g cm23
),Ais Van Bemmelen coefficient (A = 2) [29]. The size distribution of water-stable aggregates was determined by placing a soil sample on a stack of sieves (5,2, 1, 0.5 and 0.25 mm) fitted with a soil aggregate analyzer (Japan, QD24– DIK–2001). The stacked sieves were immersed in water and moved up and down by 3.5 cm at a frequency of 30 cycles 60s21
for 15 min. The proportions of aggregates that measured.5, 5–2, 2–0.5, 0.5–0.25 and,0.25 mm were calculated [30].
Table 1.Physical properties of the tilth soil (0–40 cm depth) in the experimental site.
Depth (cm)
Bulk density (g cm23
) Aggregate size (%)
.5 mm 5–2 mm 2–1 mm 1–0.5 mm 0.5–0.25 mm ,0.25 mm
0–10 1.33 0.1 0.27 2.25 4.5 4.47 88.41
10–20 1.33 0.15 0.19 1.38 4.2 4.15 89.93
20–30 1.36 0.1 0.28 1.41 4.02 3.36 90.83
30–40 1.38 0.1 0.22 1.07 3.29 3.8 91.52
doi:10.1371/journal.pone.0092839.t001
Figure 2. Soil organic carbon storage with different straw incorporation treatments (Mg C ha21).Note: CK, no straw incorporation; L, incorporation of straw at a low rate of 4 500 kg ha21maize straw; M, incorporation of straw at a medium rate of 9 000 kg ha21maize straw; H, incorporation of straw at a high rate of 13 500 kg ha21
maize straw; Sum, the sum value of the 0–60 cm soil layers; Bars with different lower case letters indicate significant differences atP,0.05.
And the proportions of aggregates were used to calculate the water-stable macroaggregates content with a diameter of
.0.25 mm [31], mean weight diameter (MWD) [32,33], geomet-ric mean diameter (GMD) [34], and the soil aggregate stability (WSAR) [35]. These parameters were calculated as follows:
macroaggregates(w0:25mm)~X
n
i~1
Wi ð3Þ
MWD~X
n
i~1
XiWi ð4Þ
GMD~exp Xn
i~1WilogXi Xn
i~1Wi !
ð5Þ
WSAR~WSA=A|100% ð6Þ
where macroaggregates(w0:25mm) is the volume of soil particles with a diameter of .0.25 mm, Wiis weight of the
aggregates in that size range as a fraction of total dry weight of the sample analysed, and n is number of sieves, Xi is the mean
diameter of aggregates over each sieve size,WSAis the mass of macroaggregates(w0:25mm), and A is the mass of the soil aggregates with a diameter of.0.25 mm.
Fractal dimension D were then obtained to describe the characteristics of soil aggregate size distribution. As suggested by Tyler and Wheatcraft [36] and Zhanget al., [37], the volume of soil with particle diameterwdi(diwdiz1,i~1,2,. . .)is defined as:
VðdwdiÞ~A1{ di=k)3{D
, ð7Þ
wheredis yard measure,kandAare the constants representing size and shape, respectively, andDis the fractal dimension. For a given soil,direpresents the average value of soil particles between
di and diz1.Generally, variations of particle density r among different soil particles could be ignored. And henceris a constant. Therefore, another expression (Eq. (8)) is derived from Eq. (7):
WðdwdiÞ~VðdwdiÞr~rA1{ di=k)3{D
, ð8Þ
whereWðdwdiÞis the cumulative mass of particles with sizes dwdi, andW0is the total mass of any sizes of soil particles. The fractal equation, reflecting the relationship between the mass distributions of soil particles and average particle diameter, can be obtained as follows:
WðdwdiÞ W0
~1{ di dmax 3{D
or WðdwdiÞ W0
~ di dmax 3{D
ð9Þ
Then after regression analysis between log didmax and log W dvdiW0, the fractal dimensionDcan be calculated.
Statistical analysis
Statistical analysis was carried out by using the SPSS 13.0 (Statistical Package for the Social Sciences) package. The effects of treatments on the measured parameters were evaluated using a one-way ANOVA. Duncan’s new multiple range test was used to calculate the least significant difference (LSD) between means
Table 2.WR0.25with different straw incorporation treatments (%).
Year Treatment Soil depth (cm) 0–40 AVG
0—10 10—20 20—30 30—40
2008 H 13.37a160.33B2 10.57a
61.283A 7.72ab60.27B 7.33a60.51A 9.75a60.31B
M 11.79b61.05A 9.28a
60.60B 7.97a
60.65A 6.62ab
60.85B 8.91b
60.26B
L 10.10c60.46A 7.39b
60.58A 6.53bc
61.08A 6.07ab
60.81A 7.52c
60.16A
CK 9.12c60.70A 6.93b
60.78A 5.89c
60.57A 5.68b
60.63A 6.91d
60.44A
2009 H 14.64a60.49AB 11.46a
60.17A 9.51a
60.26AB 7.85a
61.00A 10.86a
60.19AB
M 14.93a60.89A 11.22a
60.14AB 9.34a
60.32A 7.06ab
61.46AB 10.64a 60.27AB
L 10.39b60.26A 9.48b
61.49A 7.02b
61.18A 6.48ab
61.10A 8.34b
60.32A
CK 9.75b60.26A 7.18c
60.73A 6.40b
61.00A 5.65b
60.35A 7.25c
60.10A
2010 H 15.81a61.20A 12.76a
60.44A 11.50a
60.20A 8.57a
60.05A 12.16a
60.59A
M 16.72a61.36A 12.81a
60.05A 11.30a
61.10A 8.81a
60.44A 12.41a
60.72A
L 11.00b60.78A 9.06b
60.81A 8.03b
62.14A 6.96b
60.81A 8.76b
60.66A
CK 10.23b60.46A 7.79b
60.23A 6.07b
60.46A 5.71c
60.23A 7.45c
60.25A
Note: CK, no straw incorporation; L, incorporation of straw at a low rate of 4 500 kg ha21maize straw; M, incorporation of straw at a medium rate of 9 000 kg ha21 maize straw; H, incorporation of straw at a high rate of 13 500 kg ha21maize straw; AVG, the mean value of the 0–40 cm soil layers.
1Values followed by the same lowercase letter in the same line are not significantly different according to Duncan’s multiple range test (P
,0.05) between the four straw incorporation treatments in the same year.
2Values followed by the same uppercase letter in the same line are not significantly different according to Duncan’s multiple range test (P
,0.05) between the different years of the same straw incorporation treatment.
3Means
when F-values were significant. In all cases, differences were deemed to be significant ifP,0.05.
Results
Soil organic carbon storage (SOC)
The effect of straw incorporation on SOC storage is shown in Fig. 2, where the soil organic carbon storage increased with the straw incorporation. The sum of SOC storage in 0–60 cm layers with the three incorporation treatments were higher than CK, i.e., 7.71% (P,0.05), 11.14% (P,0.05) and 1.70% in 2008, 15.15%
(P,0.05), 24.00% (P,0.05) and 6.86% in 2009, and 21.40% (P,0.05), 20.38% (P,0.05) and 8.21% (P,0.05) in 2010, respectively. The SOC storage increased with the number of years of incorporation, i.e., the SOC storage (0–60 cm depth) in 2010 had increased by 6.19–12.48% compared with 2008, and decreased with the soil layer depth, i.e., by 3.75–25.68% in 2008, 11.85–21.70% in 2009 and 13.51–26.64% in 2010. The SOC storage of H and M was slightly higher than CK in 2008, although the difference was significant in 40–60 cm layer only. In 2009, compared with CK, H and M significantly increased the SOC storage by 11.01% and 21.74% (P,0.05) in 0–20 cm layer,
Figure 3. MWD values with wet sieving under the different straw incorporation treatments.Note: MWD, weight mean diameter; CK, no straw incorporation; L, incorporation of straw at a low rate of 4 500 kg ha21maize straw; M, incorporation of straw at a medium rate of 9 000 kg ha21 maize straw; H, incorporation of straw at a high rate of 13 500 kg ha21
maize straw; Average, the mean value of the 0–40 cm soil layers. Bars with different lower case letters indicate significant differences atP,0.05.
14.94% and 18.81% (P,0.05) in 20–40 cm layer, and 20.40% and 32.47% (P,0.05) in 40–60 cm layer, respectively, and L was significantly increased by 7.89% (P,0.05) in 40–60 cm layer only. There was a significant difference between straw incorporation treatments and CK for each of the three soil layers in 2010, but there were no significant differences between H and M.
Water-stable macroaggregates (.0.25 mm)
The effects of straw incorporation on.0.25 mm macroaggre-gates are shown in Table 2. The mean .0.25 mm macroaggre-gates contents of the 0–40 cm layers of incorporation treatments
were significantly (P,0.05) higher than CK during 2008–2010, i.e., 8.91–41.14%, 15.13–49.94%, and 17.64–66.58%, respectively. The
.0.25 mm macroaggregates content also decreased with the soil layer depth, and increased with the number of years of incorpora-tion,, i.e., the H, M, L and CK in 2010 was 24.72% (P,0.05), 39.28% (P,0.05), 16.49% and 7.81% higher than that in 2008. Compared with CK, the.0.25 mm macroaggregates content of three straw incorporation treatments in the 0–10 cm layer was increased by 10.75–46.60% in 2008, 6.56–53.13% in 2009, and 7.53–63.44% in 2010, respectively, while the differences between L and CK were not significant (P.0.05) during 2008–2010. The
Figure 4. GMD values with wet sieving under the different straw incorporation treatments.Note: GMD, geometric mean diameter; CK, no straw incorporation; L, incorporation of straw at a low rate of 4 500 kg ha21maize straw; M, incorporation of straw at a medium rate of 9 000 kg ha21 maize straw; H, incorporation of straw at a high rate of 13 500 kg ha21
maize straw; Average, the mean value of the 0–40 cm soil layers. Bars with different lower case letters indicate significant differences atP,0.05.
.0.25 mm macroaggregates content showed the same trends in the 10–20 and 20–30 cm layers, and the H and M treatments had the significant difference (P,0.05) with CK. The H, M and L increased by 29.05% (P,0.05), 16.55% and 6.87% in 2008, 38.94% (P,0.05), 24.96% and 14.69% in 2009, and 50.09% (P,0.05), 54.29% (P,0.05), 21.89% (P,0.05) in 2010, respectively. A linear correla-tion was found between the.0.25 mm macroaggregates and soil organic carbon (R2.0.64,P,0.01).
Mean weight diameter (MWD) and Geometric mean diameter (GMD)
Fig. 3 & 4 show that theMWDandGMDvalues with the three incorporation treatments increased significantly throughout the three-year study. The averageMWDandGMDvalues under the incorporation treatments were higher in the 0–40 cm layers than CK during 2008–2010, i.e., 1.46–3.65% and 0.39–1.54% in 2008, 1.09–2.90% and 0.62–1.55% in 2009, 1.77–11.35% and 0.77– 3.83% in 2010, respectively. There was no significant difference (P.0.05) between L and CK during the study period. TheMWD
andGMDvalues decreased with the soil layer depth and increased with the number of years of incorporation, i.e., the H, M, L and CK in 2010 was 10.56% (P,0.05) and 3.04% (P,0.05), 7.47% (P,0.05) and 2.29% (P,0.05), 3.24% and 1.15%, and 2.92% and 0.77% higher than that in 2008. TheMWDandGMD values of treatments in the 0–10 and 10–20 cm layers were ranked in the order: H.M.L.CK. The H and M levels were significantly higher than CK while H and M levels were similar during 2008– 2010 (Fig. 3–4). TheMWDandGMDexhibited the same trends in 20–30 cm layers and there were no significant (P.0.05) differ-ences among incorporation treatments during 2008–2009, the
MWDvalues with the H were significantly (P,0.05) higher than the other three treatments during 2010, i.e., by 5.50%, 10.04%, and 10.43%, respectively. The GMD did not differ significantly among the four treatments, with the exceptions of H and L, and H and CK in 2010. The MWDand GMDvalues in the 30–40 cm
layers under the incorporation treatments were increased by 1.87%, 3.75% (P,0.05), 3.37% (P,0.05) and 0.76%, 1.76% (P,0.05), 0.78% in 2008, 0.37%, 0.01%, 0.73% and 0.73%, 0.45%, 0.45% in 2009, 8.09% (P,0.05), 7.35% (P,0.05), 2.21% (P,0.05) and 2.32% (P,0.05), 1.93% (P,0.05), 0.77% (P,0.05) in 2010, compared with CK, respectively. There was no significant difference (P.0.05) between H and M during the study period.
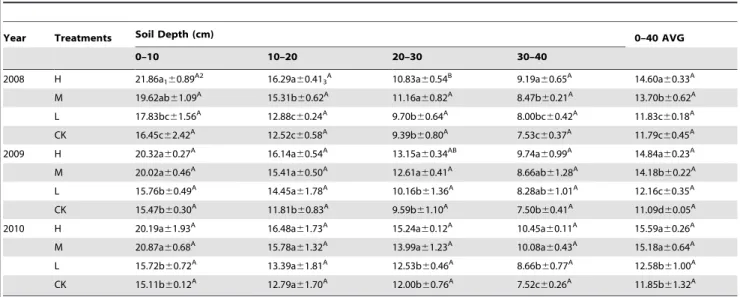
Soil aggregate stability(WSAR)
The straw incorporation significantly affected theWSAR after three years (Table 3). TheWSARvalues in the 0–40 cm layers of incorporation treatments was significantly higher than CK during 2008–2010, i.e., 0.34–19.80%, 9.65–33.79%, and 6.16–35.08%, respectively. TheWSARalso decreased with the soil layer depth, while it increased with the number of years of incorporation. The
WSAR in the 0–10 cm layers increased significantly with the amount of straw and theWSARwas highest with H throughout 2008–2010, i.e., the WSAR significantly (P,0.05) increased by 28.35%, 28.93% and 25.78% compared with L, respectively, and by 33.62%, 31.35% and 32.89% (P,0.05) compared with CK, respectively. Compared with L and CK, the WSAR values with M increased significantly by 20.08–24.67% and 26.87–29.78% during 2008–2010, respectively, but there were no significant (P.0.05) differences between H and M, and L and CK. With the four treatments, the WSAR values in the 10–20 and 20–30 cm layers were lower than the 0–10 cm layers, which were ranked in the order: H . M . L . CK. There were no significant differences (P.0.05) among the four treatments in the 30–40 cm layers throughout the three years, and the WSARmaintained at 7.50–10.45%.
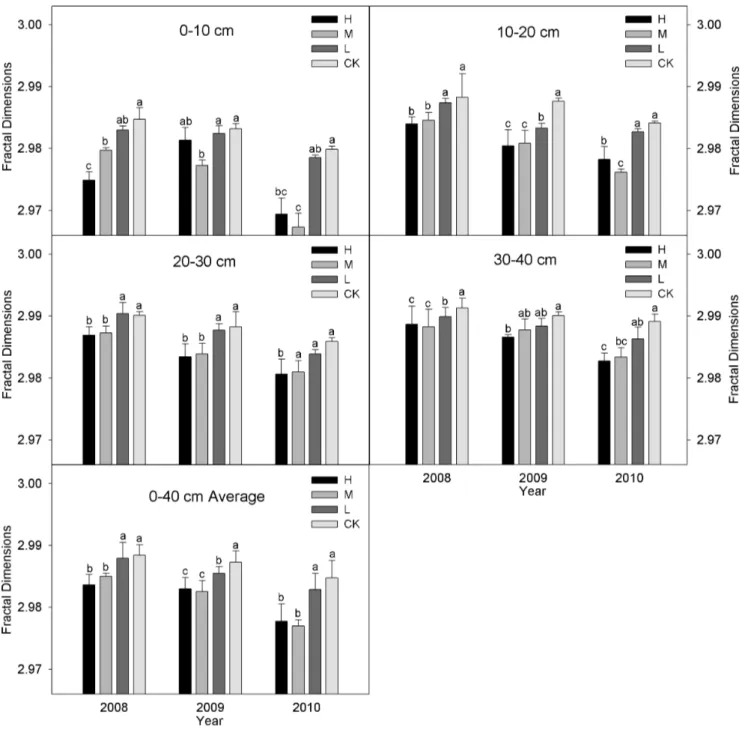
Fractal dimension (D)
Fig. 5 shows that the fractal dimensions with the three incorporation treatments decreased significantly (P,0.05) after three years of straw incorporation (the R2 of fitting curve is:
Table 3.Effects on the soil aggregate stability rate with different straw incorporation treatments (%).
Year Treatments Soil Depth (cm) 0–40 AVG
0–10 10–20 20–30 30–40
2008 H 21.86a160.89A2 16.29a
60.413A 10.83a60.54B 9.19a60.65A 14.60a60.33A
M 19.62ab61.09A 15.31b
60.62A 11.16a
60.82A 8.47b
60.21A 13.70b 60.62A
L 17.83bc61.56A 12.88c
60.24A 9.70b
60.64A 8.00bc
60.42A 11.83c 60.18A
CK 16.45c62.42A 12.52c
60.58A 9.39b
60.80A 7.53c
60.37A 11.79c 60.45A
2009 H 20.32a60.27A 16.14a
60.54A 13.15a
60.34AB 9.74a
60.99A 14.84a 60.23A
M 20.02a60.46A 15.41a
60.50A 12.61a
60.41A 8.66ab
61.28A 14.18b 60.22A
L 15.76b60.49A 14.45a
61.78A 10.16b
61.36A 8.28ab
61.01A 12.16c 60.35A
CK 15.47b60.30A 11.81b
60.83A 9.59b
61.10A 7.50b
60.41A 11.09d 60.05A
2010 H 20.19a61.93A 16.48a
61.73A 15.24a
60.12A 10.45a
60.11A 15.59a 60.26A
M 20.87a60.68A 15.78a
61.32A 13.99a
61.23A 10.08a
60.43A 15.18a 60.64A
L 15.72b60.72A 13.39a
61.81A 12.53b
60.46A 8.66b
60.77A 12.58b 61.00A
CK 15.11b60.12A 12.79a
61.70A 12.00b
60.76A 7.52c
60.26A 11.85b 61.32A
Note: CK, no straw incorporation; L, incorporation of straw at a low rate of 4 500 kg ha21maize straw; M, incorporation of straw at a medium rate of 9 000 kg ha21 maize straw; H, incorporation of straw at a high rate of 13 500 kg ha21maize straw; AVG, the mean value of the 0–40 cm soil layers.
1Values followed by the same lowercase letter in the same line are not significantly different according to Duncan’s multiple range test (P
,0.05) between the four straw incorporation treatments in the same year.
2Values followed by the same uppercase letter in the same line are not significantly different according to Duncan’s multiple range test (P
,0.05) between the different years of the same straw incorporation treatment.
3Means
0.92,0.99). The fractal dimensions (0–40 cm layer) with the
incorporation treatments were lower than those of CK during 2008–2010, i.e., 0.16% (P,0.05), 0.11% (P,0.05) and 0.02% in 2008, 0.14% (P,0.05), 0.16% (P,0.05) and 0.06% (P,0.05) in 2009, and 0.24% (P,0.05), 0.26% (P,0.05) and 0.06% in 2010, respectively. The fractal dimensions also increased with the soil layer depth and decreased with the number years of incorporation, i.e., the H, M, L and CK in 2010 was 0.20% (P,0.05), 0.27% (P,0.05), 0.17% (P,0.05) and 0.12% higher than that in 2008. The fractal dimensions in the 0–10 cm layers with the four treatments were ranked in the order: H,M,L,CK in 2008. The
fractal dimensions with H and M were significantly (P,0.05) lower than CK, i.e., 0.33%, 0.17% and 0.06%, respectively. However, the ranking was M,H,L,CK during 2009–2010, i.e., 0.06%, 0.20% (P,0.05), 0.02% in 2009, 0.35% (P,0.05), 0.42% (P,0.05) and 0.04% in 2010, respectively. While the differences between L and CK were not significant (P.0.05) during 2008– 2010. Compared with L and CK, the fractal dimensions in the 10– 20 cm layers under H was significantly (P,0.05) reduced the fractal dimensions by 0.11% and 0.14% in 2008, and 0.10% and 0.24% in 2009,, while M significantly (P,0.05) reduced by 0.09% and 0.12% in 2008, and 0.08% and 0.23% in 2009, respectively.
Figure 5. Fractal dimensions (D) of soil aggregates with different straw incorporation treatments.Note: CK, no straw incorporation; L, incorporation of straw at a low rate of 4 500 kg ha21
maize straw; M, incorporation of straw at a medium rate of 9 000 kg ha21
maize straw; H, incorporation of straw at a high rate of 13 500 kg ha21maize straw; Average, the mean value of the 0–60 cm soil layers; Bars with different lower case letters indicate significant differences atP,0.05; 0.92,R2,0.99.
The fractal dimension was lowest with M during 2010, i.e., it was decreased by 0.22% (P,0.05) compared with L, and by 0.27% (P,0.05) compared with CK. The differences among the four treatments decreased gradually in the 20–40 cm layer and the fractal dimension remained at 2.987,2.991.
Data fitting detected a linear correlation between the indexes of soil aggregates and the fractal dimension (Fig. 6).
Discussion
Results of this study demonstrated that application of crop straws had positive effects on the soil physico-chemical properties. On the other hand, there are Loess plateau regions at northwest China with intensive cultivation systems and poor soil manage-ment strategies. Therefore, crop residual managemanage-ment is very important for preserving natural ecosystems [38]. Another problem for this area is conventional tillage that reduces the soil water storage and destroys the aggregates and soil structure [39] which prompts deterioration of crop yield.
The results indicated that the SOC storage increased signifi-cantly in the 0–60 cm layers after three years of straw incorporation (Fig. 2). Rasmussen and Collins [40] reported that the soil organic matter content was strongly related to the amount of residues added and only weakly related to the type of residue
applied. The H and M treatments were significantly different from the L throughout the three years and the soil organic matter level increased as the straw incorporated and decomposed [20], which effectively mitigated the loss of soil organic carbon from in the agroecosystem caused by intensive cropping [41]. The SOC storage decreased gradually in all the treatments with the soil layer depth because the degree of straw incorporation was lower in the deeper layers compared with the surface layers (0–20 cm) of the soil [42]. This was because the amount of straw incorporated in the topsoil was greater than that in the deeper layers [40,43].
Soil aggregates are the basic units of the soil structure and they are composed of primary particles and binding agents [12]. They are also necessary soil conditions for high crop yields [44]. Conventional tillage disturbs the soil and increase the effects of drying–rewetting and freezing–thawing, which increases the susceptibility of the macroaggregate (.0.25 mm) to disruption [45–47]. Pinheiroet al.[48] showed that soil exposure with tillage and the lack of residue inputs led to a decline in aggregation and organic carbon, both of which made the soil susceptible to erosion. Our study showed that the straw incorporation of straws determined significantly more and larger soil aggregates than CK, thus indicating an improvement of soil physical quality. This may have been attributable to the significant increase in the SOC storage (an average increase by 8.21–21.40% in 2010), the lower
Figure 6. Correlations between D and.0.25 mm macroaggregates, MWD, GMD, WSAR of the soil aggregates.Note: MWD, weight mean diameter of soil aggregates; GMD, geometric mean diameter of soil aggregates; WSAR, soil aggregate stablility rate; D, Fractal dimension of soil aggregates. 95% CI, 95% confidence interval.**P,0.01.
soil bulk density (an average decreased by 1.80–4.13% in 2010, data no shown) [49], and increased soil porosity (an average increased by 1.70–3.90% in 2010, data no shown) [50] after straw incorporation. It also stimulated the activity of soil microorganisms [51] and an abundance of polyose metabolites were produced during the straw decay process [52]. These soil physical and chemical conditions may have accelerated the incorporated SOM decomposing process and increased soil aggregation [24].
Soil aggregate structural stability is widely recognized as a key indicator of soil quality, which is closely related to a number of soil properties, processes, and functions, e.g., the quantity and composition of SOM [48], infiltration capacity [53], soil biotic activity [54] and the resistance to erosion [55,56]. Weiet al.[57] showed that the addition of crop residues was the most effective measure for increasing the rhizosphere aggregate stability. Sonnleitner et al. [24] and Karami et al. [41] also found that straw application improved the aggregate stability and other soil properties. In our study, the soil aggregate stability of the straw incorporation treatments were significantly higher than CK in 2010, and it was decreased with the soil layer depth. These results agreed with studies by Tripathy and Singh [42] and Karamiet al.
[41]. Our results also indicated that straw incorporation was positively related to the physical protection of organic matter [20] and an increased aggregate quantity [58], but it also improved the soil aggregate stability [20] and reduced soil degeneration [22,23]. Many studies have shown that soil is a porous medium with fractal characteristics [59–60]. Thus, fractal theory can be used to describe the complex characteristic of soil structure [61]. Castrignano` and Stelluti [62] reported that a higher fractal dimension indicated the heavier texture of a soil and its inferior permeation properties. This showed that fractal theory is an effective method to describing the soil aggregate distribution [37] and changed with different levels of straw incorporation [31]. The fractal dimensions of the 0–40 cm layers with the four treatments
after three years were ranked in the order: H,M,L,CK and the three straw incorporation treatments were significantly different from CK. These results agreed with Zhanget al.[37] and Zhanget al. [31]. The low values of D indicated a size distribution dominated by a large number of macroaggregates (.0.25 mm) [59,63]. This improvement in the fractal dimension may have been accelerated by the incorporation of straw, which improved the soil structure, increased the SOM content and microbial activity [64], and significantly increased the mount and size of soil aggregates [37]. Our results indicated there were significant improvements in the soil macroaggregates and the aggregate structure after straw incorporation [20].
Conclusion
The incorporation of different amount of straw significant increased the SOC storage, .0.25 mm macroaggregates, MWD
and GMD in a semiarid soil. The SOC storage, .0.25 mm macroaggregates, MWD and GMD also increased with higher straw incorporation rates. The fractal dimension decreased with increasing straw incorporation rates. Therefore, the incorporation of straw into the soil in semiarid areas is an effective practice for improving the soil aggregate content and stability.
Acknowledgments
We are grateful to Mr Li Yongping and Liu Shixin for managing the field experiments and professional English editor Jackson who is from UK, and kind help with the language of this manuscript.
Author Contributions
Conceived and designed the experiments: ZJ QH. Performed the experiments: PZ TW. Analyzed the data: PZ. Contributed reagents/ materials/analysis tools: XR YL. Wrote the paper: PZ.
References
1. Hu KL, Li BG, Lin QM, Li GT, Chen DL (1999) Spatial variabi lity of soil nutrient in wheat field. Transactions of the Chinese Society of Agricultural Engineering 15:33–38. (in Chinese with English abstract)
2. Mupangwa W, Twomlow S, Walker S (2008) The influence of conservation tillage methods on soil water regimes in semi-arid southern Zimbabwe. Phys Chem Earth, Parts A/B/C 33: 762–767.
3. Biederbeck V, Campbell C, Bowren K, Schnitzer M, McIver R (1980) Effect of burning cereal straw on soil properties and grain yields in Saskatchewan. Soil Sci Soc Am J 44: 103–111.
4. Wuest SB, Caesar-TonThat T, Wright SF, Williams JD (2005) Organic matter addition, N, and residue burning effects on infiltration, biological, and physical properties of an intensively tilled silt-loam soil. Soil Tillage Res 84: 154–167. 5. Duan F, Liu X, Yu T, Cachier H (2004) Identification and estimate of biomass
burning contribution to the urban aerosol organic carbon concentrations in Beijing. Atmos Environ 38: 1275–1282.
6. Mandal KG, Misra AK, Hati KM, Bandyopadhyay KK, Ghosh PK, et al. (2004) Rice residue-management options and effects on soil properties and crop productivity. J Food Agric Environ 2: 224–231.
7. Carter MR (2002) Soil quality for sustainable land management. Agron J 94: 38–47.
8. Hillel D (2004) Encyclopedia of Soils in the Environment: London, Elsevier, v. 4, p. 295–303.
9. Six J, Bossuyt H, Degryze S, Denef K (2004) A history of research on the link between (micro) aggregates, soil biota, and soil organic matter dynamics. Soil Tillage Res 79: 7–31.
10. Tisdall J, Oades J (1982) Organic matter and water-stable aggregates in soils. J Soil Sci 33:141–163. doi:10.1111/j.1365-2389.1982.tb01755.x
11. Haynes R, Beare M (1997) Influence of six crop species on aggregate stability and some labile organic matter fractions. Soil Biol Biochem 29: 1647–1653. 12. Scanlon BR, Andraski BJ, Bilskie J (2002) Methods of Soil Analysis: Part 4
Physical Methods: Soil Science Society of America. 643–668 p.
13. Herna´ndez-Herna´ndez R, Lo´pez-Herna´ndez D (2002) Microbial biomass, mineral nitrogen and carbon content in savanna soil aggregates under conventional and no-tillage. Soil Biol Biochem 34: 1563–1570.
14. Villar M, Petrikova V, Dıaz-Ravina M, Carballas T (2004) Changes in soil microbial biomass and aggregate stability following burning and soil rehabili-tation. Geoderma 122: 73–82.
15. Ashagrie Y, Zech W, Guggenberger G (2005) Transformation of aPodocarpus falcatudominated natural forest into a monocultureEucalyptus globulusplantation at Munesa, Ethiopia: soil organic C, N and S dynamics in primary particle and aggregate-size fractions. Agric Ecosyst Environ 106: 89–98.
16. Jastrow J (1996) Soil aggregate formation and the accrual of particulate and mineral-associated organic matter. Soil Biol Biochem 28: 665–676.
17. Chevallier T, Blanchart E, Albrecht A, Feller C (2004) The physical protection of soil organic carbon in aggregates: a mechanism of carbon storage in a Vertisol under pasture and market gardening (Martinique, West Indies). Agric Ecosyst Environ 103: 375–387.
18. Duiker S, Lal R (1999) Crop residue and tillage effects on carbon sequestration in a Luvisol in central Ohio. Soil Tillage Res 52: 73–81.
19. Saroa G, Lal R (2003) Soil restorative effects of mulching on aggregation and carbon sequestration in a Miamian soil in central Ohio. Land Degrad Dev 14: 481–493.
20. Tan DS, Jin JY, H SW, Li ST, He P (2007) Effect of long-term application of K fertilizer and wheat straw to soil on crop yield and soil K under different planting systems. Agric Sci in China 6: 200–207.
21. Li Q, Chen X, Zhang F, Ro¨mheld V (2002) Study on balance of phosphorus and potassium in winter wheat and summer maize rotation system. Plant Nutr Fert Sci 8: 152–156. (in Chinese with English abstract)
22. Nelson RG (2002) Resource assessment and removal analysis for corn stover and wheat straw in the Eastern and Midwestern United States—rainfall and wind-induced soil erosion methodology. Biomass Bioenergy 22: 349–363. 23. Wilhelm W, Johnson JMF, Karlen DL, Lightle DT (2007) Corn stover to sustain
soil organic carbon further constrains biomass supply. Agron J 99: 1665–1667. 24. Sonnleitner R, Lorbeer E, Schinner F (2003) Effects of straw, vegetable oil and whey on physical and microbiological properties of a chernozem. App Soil Ecol 22: 195–204.
25. Mulumba LN, Lal R (2008) Mulching effects on selected soil physical properties. Soil Tillage Res 98: 106–111.
27. FAO/UNESCO (1993) ’World soil resources. An explanatory note on the FAO World Soil Resource Map at 1 : 25,000,000 scales.’ (FAO: Rome)
28. Wang S, Tian H, Liu J, Pan S (2003) Pattern and change of soil organic carbon storage in China: 1960s–1980s. Tellus B 55: 416–427.
29. Pribyl DW (2010) A critical review of the conventional SOC to SOM conversion factor. Geoderma 156: 75–83.
30. Oades J, Waters A (1991) Aggregate hierarchy in soils. Soil Res 29: 815–828. 31. Zhang P, Jia ZK, Wang W, Lu WT, Gao F, et al. (2012) Effects of straw
returning on characteristics of soil aggregates in semi-arid areas in southern Ningxia of China. Sci Agric Sin 45:1513-1520. (in Chinese with English abstract) 32. Van Bavel C (1949) Mean weight diameter of soil aggregates as a statistical index
of aggregation. Soil Sci Soc Am Proc. pp. 20–23.
33. Youker R, McGuinness J (1957) A short method of obtaining mean weight-diameter values of aggregate analyses of soils. Soil Sci 83: 291–294. 34. Mazurak AP (1950) Effect of gaseous phase on water-stable synthetic aggregates.
Soil Sci 69: 135–148.
35. Hou XQ, Li R, Jia ZK, Han QF, Wang W, et al. (2012) Effects of rotational tillage practices on soil properties, winter wheat yields and water-use efficiency in semi-arid areas of north-west China. Field Crops Res 129: 7–13.
36. Tyler SW, Wheatcraft SW (1992) Fractal scaling of soil particle-size distributions: analysis and limitations. Soil Sci Soc Am J 56: 362–369. 37. Zhang Z, Wei C, Xie D, Gao M, Zeng X (2008) Effects of land use patterns on
soil aggregate stability in Sichuan Basin, China. Particuology 6: 157–166. 38. Zhu H, Wu J, Huang D, Zhu Q, Liu S, et al. (2010) Improving fertility and
productivity of a highly-weathered upland soil in subtropical China by incorporating rice straw. Plant Soil 331: 427–437.
39. Mele PM, Crowley DE (2008) Application of self-organizing maps for assessing soil biological quality. Agric Ecosyst Environ 126: 139–152.
40. Rasmussen PE, Collins HP (1991) Long-term impacts of tillage, fertilizer, and crop residue on soil organic matter in temperate semiarid regions. Adv Agron 45: 93–134.
41. Karami A, Homaee M, Afzalinia S, Ruhipour H, Basirat S (2012) Organic resource management: Impacts on soil aggregate stability and other soil physico-chemical properties. Agric Ecosyst Environ 148: 22–28.
42. Tripathy R, Singh AK (2004) Effect of water and nitrogen management on aggregate size and carbon enrichment of soil in rice-wheat cropping system. J Plant Nutr Soil Sci 167: 216–228.
43. Prasad R, Power J (1991) Crop residue management. Adv Soil Sci 15: 205–251. 44. Limon-Ortega A, Govaerts B, Sayre KD (2009) Crop rotation, wheat straw management, and chicken manure effects on soil quality. Agron J 101: 600–606. 45. Beare M, Hendrix P, Cabrera M, Coleman D (1994) Aggregate-protected and unprotected organic matter pools in conventional-and no-tillage soils. Soil Sci Soc Am J 58: 787–795.
46. Paustian K, Levine E, Post WM, Ryzhova IM (1997) The use of models to integrate information and understanding of soil C at the regional scale. Geoderma 79: 227–260.
47. Mikha MM, Rice CW (2004) Tillage and manure effects on soil and aggregate-associated carbon and nitrogen. Soil Sci Soc Am J 68: 809–816.
48. Pinheiro E, Pereira M, Anjos L (2004) Aggregate distribution and soil organic matter under different tillage systems for vegetable crops in a Red Latosol from Brazil. Soil Tillage Res 77: 79–84.
49. Lal R (2000) Physical management of soils of the tropics: priorities for the 21st century. Soil Sci 165: 191–207.
50. Pagliai M, Vignozzi N, Pellegrini S (2004) Soil structure and the effect of management practices. Soil Tillage Res 79: 131–143.
51. Kasteel R, Garnier P, Vachier P, Coquet Y (2007) Dye tracer infiltration in the plough layer after straw incorporation. Geoderma 137: 360–369.
52. Pascual JA, Garcı´a C, Hernandez T (1999) Comparison of fresh and composted organic waste in their efficacy for the improvement of arid soil quality. Bioresour Technol 68: 255–264.
53. Abu-Sharar T, Salameh A (1995) Reductions in hydraulic conductivity and infiltration rate in relation to aggregate stability and irrigation water turbidity. Agric Water Manage 29: 53–62.
54. Rolda´n A, Salinas-Garcı´a J, Alguacil M, Caravaca F (2005) Changes in soil enzyme activity, fertility, aggregation and C sequestration mediated by conservation tillage practices and water regime in a maize field. Appl Soil Ecol
30: 11–20.
55. Barthes B, Roose E (2002) Aggregate stability as an indicator of soil susceptibility to runoff and erosion; validation at several levels. Catena 47: 133–149. 56. Ramos M, Nacci S, Pla I (2003) Effect of raindrop impact and its relationship
with aggregate stability to different disaggregation forces. Catena 53: 365–376. 57. Wei CF, Gao M, Shao JG, Xie DT, Pan GX (2006) Soil aggregate and its
response to land management practices. China Particuology 4: 211–219. 58. Tarafdar JC, Meena SC, Kathju S (2001) Influence of straw size on activity and
biomass of soil microorganisms during decomposition. Eur J Soil Biol 37: 157– 160.
59. Perfect E, Kay B (1991) Fractal theory applied to soil aggregation. Soil Sci Soc Am J 55: 1552–1558.
60. Rieu M, Sposito G (1991) Fractal fragmentation, soil porosity, and soil water properties: II. Applications. Soil Sci Soc Am J 55: 1239–1244.
61. Bird N, Bartoli F, Dexter A (2005) Water retention models for fractal soil structures. Eur J Soil Sci 47: 1–6.
62. Castrignano` A, Stelluti M (1999) Fractal geometry and geostatistics for describing the field variability of soil aggregation. J Agric Eng Res 73: 13–18. 63. Ding Q, Ding W (2007) Comparing stress wavelets with fragment fractals for soil
structure quantification. Soil Tillage Res 93: 316–323.