www.ann-geophys.net/28/407/2010/
© Author(s) 2010. This work is distributed under the Creative Commons Attribution 3.0 License.
Annales
Geophysicae
A study of L-dependent Pc3 pulsations observed by low Earth
orbiting CHAMP satellite
D. C. Ndiitwani and P. R. Sutcliffe
Hermanus Magnetic Observatory, P.O. Box 32, Hermanus, 7200, South Africa University of Kwazulu-Natal, Private Bag X54001, Durban, 4000, South Africa
Received: 2 November 2009 – Revised: 24 December 2009 – Accepted: 22 January 2010 – Published: 3 February 2010
Abstract. Field line resonances (FLR) driven by compres-sional waves are an important mechanism for the generation of ULF geomagnetic pulsations observed at all latitudes dur-ing local daytime. References to observations of toroidal standing Alfv´en mode oscillations with clearly L-dependent frequencies from spacecraft in the outer magnetosphere for
L >3 are limited in the literature. Such observations in the inner magnetosphere forL <3 have not yet been reported in the literature. This study offers two interesting case stud-ies of observations of ULF waves by the low Earth orbiting CHAMP satellite. The magnetic field measurements from CHAMP, which are of unprecedented accuracy and resolu-tion, are compared to Hermanus magnetometer data for times when CHAMP crosses the ground station L-shell, namely for 13 February 2002 and 18 February 2003. The data were analysed for Pc3 pulsation activity using the Maximum En-tropy Spectral Analysis (MESA) method to visualise FLRs in the vector magnetometer data. For the first time obser-vations of Pc3 toroidal oscillations with clearly L-dependent frequencies for lower L-shell values (L <3) observed by an LEO satellite are reported. These observations show FLR frequencies increasing as a function of decreasing latitude down toL=1.6 and then decreasing as a result of the larger plasma density of the upper ionosphere. The L-dependent frequency oscillations were observed in the presence of a broadband compressional wave spectrum. Our observations thus confirm the well-known magnetohydrodynamic (MHD) wave theoretical prediction of a compressional wave being the driver of the field line resonance.
Keywords. Magnetospheric physics (Magnetosphere-ionosphere interactions; MHD waves and instabilities; Solar wind-magnetosphere interactions)
Correspondence to:D. C. Ndiitwani ([email protected])
1 Introduction
Magnetometers on board spacecraft and on the Earth’s sur-face detect the magnetic signature of ultra-low frequency (ULF) geomagnetic field line resonances known as geomag-netic pulsations. Geomaggeomag-netic pulsations are characterized by their period and structure as continuous Pc or irregular Pi pulsations (Jacobs et al., 1964). The continuous pulsa-tions such as Pc3 are mainly thought to be the resonances of either geomagnetic field lines with ends fixed in conjugate ionospheres or of cavities in the magnetosphere (Dungey, 1954, 1964). The resonance mechanism follows three steps: the source wave is excited at or near the dayside magne-topause/bow shock, it propagates into the magnetosphere as a fast-mode magnetosonic wave, and the latter couples into the local standing Alfv´en wave (Southwood, 1974; Chen and Hasegawa, 1974). The treatment of pulsations as harmonics of Alfv´en waves follows suggestions (Sugiura and Wilson, 1964) that field lines or shells oscillate independently from each other in a manner similar to that of resonant waves on a vibrating string.
The Earth’s foreshock, the region between the tangential interplanetary magnetic field (IMF) line and the bow shock, is filled with backstreaming electrons and ions (Le and Rus-sel, 1996; Shin et al., 2008). Observations suggest that ULF waves generated in the region upstream of the bow shock are moved downstream by the solar wind into the magnetosheath by convection. If the IMF cone angle is small, waves in the subsolar upstream region are carried to the magnetopause boundary. The magnetopause responds to these pressure fluctuations and transfers wave energy into the dayside mag-netosphere where they can excite field line resonances (Le and Russell, 1994). It is generally agreed that the ultimate source of dayside Pc3 and Pc4 geomagnetic pulsations are upstream waves.
408 D. C. Ndiitwani and P. R. Sutcliffe: L-dependent Pc3 pulsations observed by CHAMP the source wave frequency content, that is, whether it is
monochromatic or broad-band. Magnetic pulsations can be excited when a monochromatic source is present in the mag-netosphere and the field line with eigenperiod similar to the monochromatic source resonates with maximum inten-sity at the L-shell value of the resonant field line (Chen and Hasegawa, 1974; Southwood, 1974). Hasegawa et al. (1983) present a theoretical discussion that supports the conjecture of a wideband source able to excite harmonics for a given field line. The Hasegawa mathematical model explains how the local field line can oscillate at its resonant frequency in response to a wideband source, the frequency spectrum of which covers the resonant frequency. This explains cer-tain observations of magnetic pulsations where the frequency varies continuously as a function of latitude for a given event. In this study this model is employed to interpret the L-dependence of FLR frequencies for Pc3 pulsations observed on L-shells withL <3. This kind of FLR structure has pre-viously been observed in the outer magnetosphere between
L=3 and 6 by Takahashi et al. (1990) and between L=4.5 and 9.1 by Engebretson et al. (1987).
In order to remedy the lack of observations of Pc3 mag-netic pulsations in the outer magnetosphere, Takahashi et al. (1990) initiated an analysis of magnetic field data between
L=2 and 6 acquired by the AMPTE CCE spacecraft. They presented dayside pulsation activity recorded by CCE dur-ing inbound passes. The noise level of AMPTE CCE data was at least 4 times stronger forL <2.3 than forL >2.3, while the amplitude of pulsations is expected to decrease at smaller L-shells, thus making it relatively difficult to detect pulsations atL <2.3. The ability to detect Pc3–4 pulsations was made possible by averaging the highest time resolution (0.124 s) data down to nearly exactly the spacecraft spin pe-riod (5.9 s). They identified toroidal standing Alfv´en wave oscillations with clearly L-dependent frequencies between
L=3 and 6. Their ability to detect small amplitudes in CCE magnetometer data lead to the possibility of identifying the origin of various waves types of magnetic pulsation observed on the ground at low and middle latitudes using in situ mea-surements by satellites. They generated dynamic spectra us-ing the FFT method computed for a 6-min window progres-sively shifted by 1.5 min at each step. The dynamic spectra were characterized by traces of pulsation activity with fre-quency that falls with L betweenL=3 and 6. Engebretson et al. (1987) observed toroidal oscillations with frequencies that decreased as a function of increasing L-shell fromL=4.5 up to 9.1 and that increased again as the satellite moved to lower L-shells for a single full orbit.
Menk et al. (2000) utilized a temporary 12 magnetome-ter ground array in Easmagnetome-tern Australia spanningL=1.3 to 2.0 to investigate the variation in Pc3–4 power with latitude, the nature and low-latitude limit of FLRs, and properties of spec-tral components below the local resonant frequency. They employed a number of effective methods for detecting FLRs such as those described by Baransky et al. (1985, 1989)
and Waters et al. (1991, 1994, 1995). They found that the resonant frequency increases with decreasing latitude up to
L∼1.6 and then decreases at lower latitudes as a result of mass loading on the field line eigenfrequency due to the ef-fect of ionospheric heavy ions at low altitudes (Hattingh and Sutcliffe, 1987).
Vellante et al. (2004) used SEGMA and CHAMP data to show that discrete Pc3 FLR oscillations are excited at low latitudes where the local resonant frequency matched that of the fast mode driver. Ndiitwani and Sutcliffe (2009) confirmed this observation using an independent data set to study the structure of low-latitude Pc3 pulsations observed by CHAMP and on the ground. In the current study, we con-tinue the investigation of toroidal oscillations atL <3 ob-served by CHAMP. However, we find that the spectral struc-ture of the FLR oscillations differs from that reported in the previous two papers. The current results are consistent with Hasegawa’s mathematical model (Hasegawa et al., 1983). They are also consistent with previous satellite observations in the outer magnetosphere fromL=3 up to 6 by Takahashi et al. (1990) and between L = 4.5 and 9.1 by Engebretson et al. (1987). Some characteristics of the spectral structure also agree with the statistical results determined from ground ob-servations by Menk et al. (2000). To the best of our knowl-edge, this study is the first to report on toroidal resonant oscil-lations observed atL <3 with clearly L-dependent frequen-cies, which vary continuously with latitude and are resolved from LEO satellite vector magnetometer data. Takahashi et al. (1990) had to adopt special techniques to detect Pc3–4 pulsations with amplitudes of only 1 nT or less. In this study, CHAMP magnetic field data of unprecedented resolution are used and make it possible to extract and resolve clear Pc3 oscillations from the data.
The magnetometer data are analysed primarily using the Maximum Entropy Spectral Analysis (MESA) technique first proposed by Burg (1967, 1968). MESA sometimes suffers anomalous behaviour, such as frequency shifts, when the Burg (1968) algorithm is used to compute the prediction er-ror filter (PEF) coefficient (Chen and Stegn, 1974). Conse-quently, we used Ulrych and Clayton’s (1976) least squares estimator algorithm to compute the (PEF) coefficients, which obviates the shortcomings of the Burg (1968) algorithm. The PEF orders established by Ndiitwani and Sutcliffe (2009) experimenting with artificially generated signals, were em-ployed. In order to identify FLRs in ground-based and satel-lite data PEF orders of 15 and 20, respectively, are regarded as adequate.
2 Observations
Fig. 1.Map of southern African region that also extends to central Africa showing the satellite ground tracks as it traversed the region during Pc3 pulsation activities of 13 February 2002 (solid line) and 18 February 2003 (dashed line). The locations of Hermanus and Sutherland ground stations are also shown.
African and adjacent ocean regions indicating the loca-tions of two induction magnetometers for recording geo-magnetic pulsations in South Africa, namely at Hermanus (HER) (34◦
25′ S, 19◦
13′
E) and Sutherland (SUT) (32◦ 24′
S, 20◦
40′
E). This station pair can be used to facilitate field line resonance detection using the amplitude difference method of Baransky et al. (1985) and cross phase technique of Wa-ters et al. (1991, 1994). The two lines across the map show the CHAMP ground tracks during the two traverses, the re-spective paths on 13 February 2002 and 18 February 2003 in-dicated by solid and dashed lines on the map. The first points during the considered times are indicated by diamond sym-bols. The solid line shows CHAMP moving in the direction of the equator, whereas the dashed line shows the satellite moving poleward. In both cases the satellite covered almost 40 degrees of latitude in 10 min due to the low Earth orbit, thus a rapid movement of the satellite across different L-shell regions. The continuous movement of CHAMP across these L-shells provides an advantage to study the latitude depen-dence of field line resonance frequency.
Since the prime objective of this paper is to study FLRs, we use well established techniques to demonstrate the pres-ence of FLRs in the ground-based data prior to consider-ing them in combination with the satellite data. Figure 2 shows the amplitude difference and cross phase plots for the event on 13 February 2002 (discussed in detail below) that occurred between 07:25 and 07:35 UTC. The top panel
Fig. 2. The spectrum of the Pc3 pulsation H-component observed on the ground for the 12 February 2002 event that occurred between 07:25 and 07:35 UTC. Top panel: Amplitude spectra at HER and SUT, Middle panel: SUT-HER amplitude difference and bottom panel: SUT-HER phase difference.
410 D. C. Ndiitwani and P. R. Sutcliffe: L-dependent Pc3 pulsations observed by CHAMP
Fig. 3.The pulsation signals observed simultaneously on ground and along CHAMP trajectory. H- and D-components of the Pc3 pulsation activities observed on the ground on(a)13 February 2002 and(b)18 February 2003. Two Pc3 signals observed along the CHAMP satellite trajectories on(c)13 February 2002 and(d)18 February 2003. The CHAMP vector magnetic components shown are in a field-aligned coordinate system i.e. compressional (Bcom), toroidal (Btor)and poloidal (Bpol), from top to bottom.
∼42 mHz. The bottom two plots are the SUT-HER ampli-tude and phase difference, respectively. Both ampliampli-tude and phase difference techniques identify FLR occurring close to 37 mHz. This is in agreement with the dynamic cross-phase spectrum (not shown) that indicated FLR frequency of 40– 35 mHz between 06:00 and 18:00 UTC.
2.1 Event 1
The first event considered occurred on 13 February 2002 be-tween 07:25–07:35 UTC. During this time a Pc3 was simul-taneously observed on the ground at HER and in the upper ionosphere along the CHAMP trajectory as shown in Fig. 3a and c, respectively. Figure 3a shows H- and D-components as measured by the Hermanus ground station. The
com-ponents in a field-aligned coordinate system observed by CHAMP are shown in Fig. 3c. In this coordinate system the compressional (Bcom)component is aligned with the ambient
magnetic field direction (positive North), the toroidal (Btor)
component represents the azimuthal perturbation (positive East), and the poloidal (Bpol)component lies in the magnetic
meridian plane (positive inward). Also shown is the geocen-tric latitude axis which illustrates the change of latitude over a given time. These time series signals were filtered in the Pc3 frequency band, 20–100 mHz. The ground signal ap-pears monochromatic and the H-component has a larger am-plitude than the D-component. The satellite data appears to be more broadband. TheBtorexhibits larger amplitude than
Fig. 4. MESA dynamic power spectra of the HER H- and D-components for(a)data plotted in Fig. 3a and(b)for data plotted in Fig. 3b.
In order to facilitate comparison of the ground and satellite data, dynamic MESA spectra of both data sets were com-puted using a 90 s data window shifted by 10 s as shown in Figs. 4a and 5a for ground and satellite, respectively. The frequency resolution of the dynamic spectra is 1 mHz. The prediction error filter (PEF) length values of 15 and 20 determined experimentally (Ndiitwani and Sutcliffe, 2009) were used for ground and satellite data respectively. Addi-tional geocentric latitude and L-value axes are added to the CHAMP dynamic spectra to facilitate studying the L-shell dependence of the field line resonance frequencies. Fig-ure 4a shows the dynamic spectra computed for the Her-manus ground data. A field line resonance (FLR) is clearly visible in the H-component with frequency centred around 34 mHz between 07:27 UTC and 07:35 UTC. In addition there is an oscillation of much lower power at 65 mHz from 07:29 to 07:32 UTC. The FLR frequency also appears visible in the D-component between 07:30 UTC and 07:35 UTC. In addition, there are weaker bands of oscillation at other fre-quencies.
Fig. 5. MESA dynamic power spectra for magnetic components observed along the CHAMP trajectory on(a)13 February 2002 and
(b)18 February 2003. Also shown are the geocentric latitude and L-shell for the satellite trajectories.
412 D. C. Ndiitwani and P. R. Sutcliffe: L-dependent Pc3 pulsations observed by CHAMP aspect observable for all components is increased power
in the band of frequencies between about 20 and 70 mHz. There are similarities observable between the more intense structures in the compressional (Bcom)and poloidal (Bpol)
components. An important feature in Bcom is the
broad-band frequency structure of enhanced intensity between 30 and 60 mHz, increasing to 70 mHz, between 07:26 and 07:33 UTC.
The most outstanding feature in the toroidal component (Btor) is an intense oscillation starting at 30 mHz at about
07:27 UTC that increases to a maximum of 50 mHz at about 07:30 UTC when the satellite reaches a shell value ofL∼ 1.6. There are oscillations at 30 mHz and 65 mHz which can be ascribed to coupling with fast mode oscillations. The satellite crossed the latitude of the Hermanus ground station at about 07:28 UTC.
2.2 Event 2
The second case study considers the event that occurred be-tween 13:22–13:32 UTC on 18 February 2003. Figure 3b shows 10 min of the HER H- and D-component time se-ries. The signal exhibits a non-wave packet structure with H-component amplitude slightly larger than the D-H-component. The corresponding satellite signal shown in Fig. 3d exhibits a broadband structure as was the case for the first event consid-ered. TheBtoragain exhibits larger amplitude compared to
the other two components (note the larger amplitude scale). The prominent feature of theBtor signal is the increase of
amplitude as the satellite moves from low to high latitudes. The oscillation frequencies of the signals can be viewed from the MESA dynamic spectra shown in Figs. 4b and 5b for ground and CHAMP signals respectively. In Fig. 4b the HER H-component shows two prominent frequency bands of similar intensity. The upper band oscillates at a frequency of about 50 mHz. The lower band varies in frequency around 35 mHz going as low 20 and as high as 40 mHz. The up-per and lower frequency bands are, respectively, associated with FLR and upstream wave (UW) activity. The cross-phase spectrum of the HER-SUT pair (not shown) indicated FLR frequency of 50–55 mHz between 06:00 and 16:00 UTC on this day. This value corresponds to the field line which has its footpoint at the midpoint between HER and SUT. The up-stream wave frequency can be estimated from the empirical relationshipfuw(mHz)=6BIMF (Yumoto et al., 1984;
Rus-sel and Hoppe, 1981). The magnetic field intensityBIMF
ob-served during the course of this event from the ACE satellite (taking into account the propagation delay from ACE to the magnetopause) was∼6.2 nT. Therefore, the value of the em-pirical relationshipfuw=∼37 mHz is close to the frequency
value of the band associated with UW. The solar wind condi-tions on this day, i.e. high solar wind velocity and small cone angle, were conducive to intense UW activity (B. Heilig, pri-vate communication, 2009). The UW activity frequency also appears visible on the D-component lower band that
oscil-lates at frequencies between 30 and 40 mHz. There is evi-dence of oscillation at other higher frequencies.
The dynamic spectra for the CHAMP components in Fig. 5b show multiple frequency structures changing over 10 min. This is reminiscent of the first event considered and the Ndiitwani and Sutcliffe (2009) results. The fast mode components,BcomandBpol, exhibit a broadband
fre-quency structure and a number of clear discrete frefre-quency bands around 30, 40, 75, and 85 mHz. The most outstand-ing feature of Btor occurs when the satellite is located
be-tweenL=1.3 and 2.1. There is oscillation centered at 45 mHz around 13:26 UTC when satellite crossedL∼1.4 and which increases as a function of L-value to a maximum of 52 mHz at 13:28 UTC when the satellite approached L∼1.6. Af-ter the satellite crossed L∼1.6 the toroidal resonant fre-quency decreases with increasing L-value to about 27 mHz at 13:31 UTC andL∼2.1.
3 Discussion and conclusion
In the previous section frequency structures, which indicate the presence of L-dependent field line resonance were iden-tified using ground-based and LEO satellite data. In this section the observations are discussed in the light of MHD theoretical models and previously published field line reso-nance observations. We presented two Pc3 pulsation events characterised by a broadband compressional source spectrum and toroidal resonant oscillations with clear continuous L-dependent frequency.
At low latitudes, plasma density, magnetic field intensity and field line length vary smoothly with latitude. Conse-quently, the field line resonant frequency is expected to vary smoothly and continuously as a function of latitude. In our results the inner magnetosphere CHAMP observations show this clearly forL <3. The resonant field line oscillations are excited where there is a matching driving force, i.e. a fast mode wave. In both events fast mode signatures which ex-hibit broadband frequency structures able to drive a broad band of FLR toroidal mode oscillations, were observed in the compressional component spectra. In Event 1, the begin-ning of this behaviour was observed shortly before CHAMP crossed the Hermanus L-shell (i.e.∼1.8) with a frequency of 30 mHz observed on CHAMP. In Fig. 5a we see that the FLR frequency in theBtorspectrum noticeably increased with
de-creasing latitude, reaching a maximum of 50 mHz when the satellite reached L∼1.6 and then remained constant. Ac-cording to the dayside cavity model of Waters et al. (2000), (which invokes the usage of realistic profile of Alfv´en veloc-ity of Lee (1996) that depends on the radial coordinate and reaches a maximum atL=1.6), the FLR frequency increases with decreasing L-value to reach a maximum frequency at a particular L-shell. The frequency then decreases gradually with decreasing L-value due to the increase in plasma den-sity caused by heavy ions such as O+
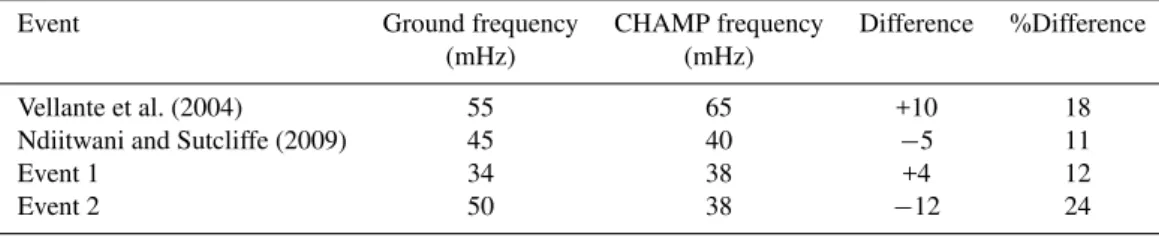
Table 1.Comparison of the FLR Doppler shifts of previous and current events.
Event Ground frequency CHAMP frequency Difference %Difference
(mHz) (mHz)
Vellante et al. (2004) 55 65 +10 18
Ndiitwani and Sutcliffe (2009) 45 40 −5 11
Event 1 34 38 +4 12
Event 2 50 38 −12 24
observed this L-value to beL∼1.6 in agreement with the cavity model and current results. In our observations the ap-parent decrease of FLR frequency due to the effect of heavy ions is particularly noticeable in the second case study. In Fig. 5b, before the satellite crossedL∼1.55 at 13:27.5 UTC, the FLR frequency was observed to increase with the in-crease in latitude.
When comparing ground and satellite observations, the following was noticed:
In Event 1 the FLR observed on the ground at frequency 34 mHz driven by a compressional wave at the same fre-quency is observed at 38 mHz in the satelliteBtorspectrum
as it crossed the HER L-shell. The difference in frequency is the result of a Doppler frequency shift caused by the rapid movement of the satellite across the resonance region. The frequency shift to higher frequencies is attributed to the equatorward motion of the satellite. In the Ndiitwani and Sutcliffe (2009) example the satellite was moving poleward and the frequency shift was to lower frequencies. Vellante et al. (2004) provides an explanation and derivation of this Doppler shift effect, namely that it is due to the rapid rate at which a LEO satellite traverses the rapid phase change across the field line resonance region. In Event 2, the CHAMP ground track was over the South Atlantic Ocean. Around 13:30 UTC the satellite crossed the L=1.8 L-shell, where CHAMP observed a frequency of about 38 mHz, which is lower than the 50 mHz observed at the HER ground station. The Doppler shift to lower frequency of the satellite FLR frequency with respect ground frequency is the result of the poleward motion of the satellite; however, in this case the fre-quency difference may also have been affected by the signif-icant longitudinal difference between the satellite track and the Hermanus ground station. In Table 1 the Doppler shifts of previous and current observations are compared. In this table we specify the FLR frequencies observed on the ground and by CHAMP on crossing ground stations L-shells, the differ-ence between the two frequencies, as well their percentage differences. Vellante et al. (2004) observed 18% difference whereas Ndiitwani and Sutcliffe (2009) observed 11% dif-ference. In Event 1 a 12% difference is observed, which is similar to the Ndiitwani and Sutcliffe (2009) observation. A significantly larger percentage difference of 24% is observed in Event 2. The signs of the Doppler shift are consist and
de-pend on the direction of motion of the satellite. The reason for the differences in magnitude is not clear; however, the larger shift for Event 2 may be due to the significant longitu-dinal difference between the satellite track and the Hermanus ground station.
In summary, we made observations consistent with Hasegawa’s (1983) mathematical model of field line reso-nance excitation and showed examples whereBtorresonates
with L-dependent frequency. The examples presented in this study differ from the observations by Vellante et al. (2004) and Ndiitwani and Sutcliffe (2009) who observed discrete FLR frequencies excited at latitudes where there was a matching driving force, i.e. a fast mode wave. The events presented in this paper exhibit toroidal resonant frequency increasing continuously as function of decreasing latitude down toL∼1.6 and thereafter decreasing as a result of the larger plasma density of the upper ionosphere. This confirms that Pc3 pulsations do not always have a source with the same frequency structure. The events discussed in this paper arise from a broad band source, while the previous results come from a narrow band source.
Acknowledgements. The satellite data used in this study were ob-tained from the CHAMP Information System and Data Centre (http: //isdc.gfz-potsdam.de/). We thank A. D. M. Walker and B. Heilig for useful discussions during the course of this work.
Topical Editor R. Nakamura thanks C. L. Waters and another anonymous referee for their help in evaluating this paper.
References
Baransky, L. N., Borovkov, J. E., Gokhberg, M. B., Krylov, S. M., and Troitskaya, V. A.: High resolution method of direct measure-ment of the magnetic field line’s eigenfrequencies, Planet. Space Sci., 33, 1369–1374, 1985.
Baransky, L. N., Belokris, S. P., Borovkov, Y. E., Gokhberg, M. B., Federov, E. N., and Green, C. A.: Restoration of the meridional structure of geomagnetic pulsation fields from gradient measure-ments, Planet. Space Sci., 37, 859–864, 1989.
Burg, J. P.: Maximum Entropy Spectral Analysis, Paper presented at 37th Meeting, Soc. Geophys., Oklahoma City, Okla., October, 1967.
414 D. C. Ndiitwani and P. R. Sutcliffe: L-dependent Pc3 pulsations observed by CHAMP
Chen, L. and Hasegawa, A.: A theory of long-period magnetic pul-sations, I: Steady state excitation of field line resonances, J. Geo-phys. Res., 79, 1024–1032, 1974.
Chen, W. Y. and Stegen, G. R.: Experiment with maximum entropy power spectra of sinusoids, J. Geophys. Res., 79, 3019–3022, 1974.
Dungey, J. W.: Electrodynamics of the outer atmosphere, Ionos. Res. Lab. Sci., University Park, Pa. State Univ., Rep. 69, 1954. Dungey, J. W.: Evidence of hydromagnetic waves in the Earth’s
magnetosphere and of their propagation to the Earth’s surface, Phys. Rev. Lett., 12, 213–215, 1964.
Engebretson, M. J., Zanetti, L. J., Potemra, T. A., Baumjohann, W., L¨uhr, H., and Acuna, H.: Simultaneous observation of Pc3–4 pulsations in the solar wind and in the Earth’s magnetosphere, J. Geophys. Res., 92, 10053–10062, 1987.
Hasegawa, A., Tsui, K. H., and Assis, A. S.: A theory of long period magnetic pulsations, 3. Local field line oscillations, Geophys. Res. Lett., 10, 765–767, 1983.
Hattingh, S. K. F. and Sutcliffe, P. R.: Pc3 pulsation eigenperiod de-termination at low latitudes, J. Geophys. Res., 92, 12433–12436, 1987.
Hughes, W. J. and Southwood, D. J.: An illustration of modification of geomagnetic pulsation structure by the ionosphere, J. Geo-phys. Res., 81, 3241–3247, 1976.
Jacobs, J. A., Kato, Y., Matsushita, S., and Troitskaya, V. A.: Classification of geomagnetic micropulsations, J. Geophys. Res., 69(1), 180–181, 1964.
Le, G. and Russell, C. T.: The morphology of ULF waves in the Earth’s Foreshock, in: Solar wind sources of magnetospheric Ultra-Low-Frequency waves, pp. 87–98, Geophysical Monogr. 81, AGU, Washington, D.C., 1994.
Le, G. and Russell, C. T.: Solar wind control of upstream wave frequency, J. Geophys. Res., 101, 2571–2575, 1996.
Lee, D. H.: Dynamics of MHD wave propagation in the low-latitude magnetosphere, J. Geophys. Res., 101, 15371–15386, 1996. Menk, F. W., Waters, C. L., and Fraser, B. J.: Field line resonances
and waveguide modes at low latitudes: 1. Observations, J. Geo-phys. Res., 105, 7747–7761, 2000.
Ndiitwani, D. C. and Sutcliffe, P. R.: The structure of low-latitude Pc3 pulsations observed by CHAMP and on the ground, Ann. Geophys., 27, 1267–1277, 2009,
http://www.ann-geophys.net/27/1267/2009/.
Russel, C. T. and Hoppe, M. M.: The dependence of upstream wave periods on the interplanetary magnetic field strength, Geophys. Res. Lett., 8, 615–618, 1981.
Shin, K., Kojima, H., Matsumoto, H., and Mukai, T.: Charac-teristics of electrostatic solitary waves in the Earth’s foreshock region: Geotail observations, J. Geophys. Res., 113, A03101, doi:10.1029/2007JA012344, 2008.
Southwood, D. J.: Some features of field line resonances in the magnetosphere, Planet. Space Sci., 22, 483–491, 1974.
Sugiura, M. and Wilson, C. R.: Oscillation of the geomagnetic field lines and associated magnetic perturbations at conjugate points, J. Geophys. Res., 69, 1211–1216, 1964.
Takahashi, K., Anderson, B. J., and Strangeway, R. J.: AMPTE CCE Observations of Pc 3-4 pulsations atL=2–6, J.Geophys. Res., 95, 17179–17186, 1990.
Ulrych, T. J. and Clayton, R. W.: Time series modelling and maxi-mum entropy, Phys. Earth Planet. Inter., 12, 188–200, 1967. Vellante, M., L¨uhr, H., Zhang, T. L., Wesztergom, V., Villante, U.,
De Lauretis, M., Piancatelli, A., Rother, M., Schwingenschuh, K., Koren, W., and Magnes, W.: Ground/satellite signatures of field line resonance: A test of theoretical predictions, J. Geophys. Res., 109, A06210, doi:10.1029/2004JA010392, 2004.
Waters, C. L., Menk, F. W., and Fraser, B. J.: The resonance struc-ture of low latitude field line resonances, Geophys. Res. Lett., 18, 2293–2296, 1991.
Waters, C. L., Menk, F. W., and Fraser, B. J.: Low-latitude geomag-netic field line resonance: experiment and modeling, J. Geophys. Res., 99, 17547–17558, 1994.
Waters, C. L., Samson, J. C., and Donovan, E. F.: The temporal variation of the frequency of high latitude field line resonances, J. Geophys. Res., 100, 7987–7996, 1995.
Waters, C. L., Harrold, B. G., Menk, F. W., Samson, J. C., and Fraser, B. J.: Field line resonances and waveguide modes at low latitudes 2. A model, J. Geophys. Res., 105, 7763–7774, 2000. Yumoto, K., Saito, T., Tsurutani, B. T., Smith, E. J., and Akasofu,