Carcinoma into the 7th Edition UICC TNM Staging
System
Wei Wang1,2., Yuanfang Li1,2., Yu Zhang1,3
, Xiuhong Yuan1,2, Dazhi Xu1,2, Yuanxiang Guan1,2, Xingyu Feng1,2, Yingbo Chen1,2, Xiaowei Sun1,2, Wei Li1,2, Youqing Zhan1,2, Zhiwei Zhou1,2*
1State Key Laboratory of Oncology in South China, Sun Yat-sen University Cancer Center, Guangzhou, Guangdong, People’s Republic of China,2Department of Gastric and Pancreatic Surgery, Sun Yat-sen University Cancer Center, Guangzhou, Guangdong, People’s Republic of China,3Department of Pathology, Sun Yat-sen University Cancer Center, Guangzhou, Guangdong, People’s Republic of China
Abstract
Background:To assess the clinical significance and prognostic impact of extranodal metastasis (EM) in gastric carcinoma and establish an optimal classification in the staging system.
Methodology/Principal Findings:A total of 1343 patients with gastric carcinoma who underwent surgical resection were recruited to determine the frequency and prognostic significance of EMs. EMs were divided into two groups (EM1 and EM2) and then incorporated into the 7thedition UICC TNM staging system. EMs was detected in 179 (13.3%) of 1343 patients who underwent radical resection. Multivariate analysis identified EMs as an independent prognostic factor (HR = 1.412, 95%CI = 1.151–1.731, P,0.001). After curative operation, the overall survival rate were worse in patients with$3 cases of EM (EM2) than those with the number of 1 and 2 cases (EM1) (P,0.001). Survival of patients with EM1 was found almost comparable to that of N3 stage (P = 0.437). Survival of patients with EM2 showed similar to that of stage IV patients (P = 0.896). By using the linear trend X2, likelihood ratio X2, and Akaike information criterion (AIC) test, EM1 treated as N3
stage and EM2 treated as M1 stage performed higher linear trend X2scores, likelihood ratio X2scores, and lower AIC value
than the 7th edition UICC TNM staging system, which represented the optimum prognostic stratification, together with
better homogeneity, discriminatory ability, and monotonicity of gradients.
Conclusions/Significance: EMs might be classified based on their number and prognostic information and should incorporate into the TNM staging system.
Citation:Wang W, Li Y, Zhang Y, Yuan X, Xu D, et al. (2011) Incorporation of Extranodal Metastasis of Gastric Carcinoma into the 7th Edition UICC TNM Staging System. PLoS ONE 6(6): e19557. doi:10.1371/journal.pone.0019557
Editor:Irene Oi Lin Ng, The University of Hong Kong, Hong Kong
ReceivedJanuary 18, 2011;AcceptedApril 1, 2011;PublishedJune 13, 2011
Copyright:ß2011 Wang et al. This is an open-access article distributed under the terms of the Creative Commons Attribution License, which permits unrestricted use, distribution, and reproduction in any medium, provided the original author and source are credited.
Funding:This work was supported by Science and Technology Projects of Guangdong Province [Grant number 2008B030301103 and 2009B080701006]. The funders had no role in study design, data collection and analysis, decision to publish, or preparation of the manuscript.
Competing Interests:The authors have declared that no competing interests exist. * E-mail: zhouzhw@sysucc.org.cn
.These authors contributed equally to this work.
Introduction
Histological examination of dissected nodal structures may disclose the presence of nodules of tumors that are not contained with recognizable lymph node tissue. This kind of cancer deposit so called Extranodal Metastases (EMs), which comprising cancer cells in soft tissue discontinuous with the primary lesion without evidence of residual lymph node tissue, is found during routine examination of about 10–28 percent of resected gastric carcinoma specimens. The presence of EM has also been identified as a prognostic factor [1,2].
It has long been ambiguous whether such involvement should be treated as a T, N, or even M factor, or should be excluded from consideration in determining tumor stage in recent years. In the American Joint Committee on Cancer (AJCC)/International Union Against Cancer (UICC) 5th and 6th edition TNM staging system, this type of tumor spread should be regarded as lymph
[2], and there are even less data on the optimal categorization of such foci. Nevertheless, an optimal categorization should heighten the value of the TNM classification as a prognostic staging system. Therefore, the aim of the present study was to assess the incidence, the relationship with other clinicopathologic factors, and the prognostic significance of EMs in patients with gastric carcinoma. In addition, to investigate the possible classification of EMs, we classified them into several different categories based on the different survival outcomes and determined whether EMs should be combined into TNM staging system or into which kind of staging. Finally, validation and comparison of the homogeneity, discriminatory ability and monotonicity of gradient of the new classification with the 7th edition TNM staging system were performed.
Methods
Participants
Clinicopathological data from 1580 cases of gastric cancer patients who underwent surgical resection from Jan. 1994 to Dec. 2006 at Sun Yat-sen University Cancer Center were analyzed retrospectively. The routine postoperative pathological results included tumor size, histological type, margin, adjacent tissues and neighboring organs, lymphatic/venous invasion, retrieved lymph nodes, metastatic lymph nodes, and pTNM staging. The eligibility criteria included histologically confirmed R0 resection, which was defined as no macroscopic and microscopic residual tumor and a postoperative survival time of $3 months. Patients with distant metastases and carcinoma of the gastric stump after gastric resection for benign disease were excluded from the study. Among the potential participants, 106 had distant metastases (liver, lung, ovary, abdominal or pelvic cavity dissemination), 41 underwent R1 or R2 resection, 13 had distant lymph node metastases (retropancreatic, mesenteric, duodenohepatic ligament or para-aortic lymph node), 15 died less than 3 months after resection, and 62 were lost to follow-up. Thus, 237 patients were excluded and 1343 patients were recruited.
Surgical procedures
D2 lymphadenectomy was performed by experienced surgeons following the JGCA guidelines [6]. All resected specimens were fixed in 10 percent formalin, embedded in paraffin, and stained with haematoxylin and eosin. All solid structures in adipose connective tissue resected with the stomach were retrieved, including the lymph nodes and any areas of EMs. EMs were defined as the presence of cancer cells in soft tissue that was
discontinuous with the primary lesion or in peri-stomach soft tissue distinct from the lymph node.
Ethics statement
The protocol was approved by Sun Yat-sen University Cancer Center review board in keeping with Chinese bioethical regulations. All patients gave a written informed consent before participating in the study.
Follow up
Postoperative follow-up included clinical and laboratory examinations every 3 months for the first 2 years at our outpatient department, every 6 months from the third to fifth years, and annually thereafter until at least 5 years after the operation or until the patient died, whichever came first. Overall patient survival, defined as the time from operation to death or last follow-up, was used as a measure of prognosis. The follow-up was closed in May 2010. The median follow-up for the entire cohort was 50 months (range 3–197 months).
Statistical Analysis
Mann–Whitney U test and X2tests were used where appropriate to compare the distribution of individual variables between groups. The 5-year survival rate was calculated using the Kaplan–Meier method. Statistical comparisons of different factors were made with the log-rank test. In multivariate analysis, forward stepwise regression analysis was performed with a Cox proportional hazards model. A two-tailed P value of#0.05 was considered statistically significant.
To compare the redefinitions of the T, N, and M categories with the 7th edition TNM staging system, the likelihood ratio X2test related to the Cox regression model was used for measuring homogeneity. The discriminatory ability and monotonicity of gradient assessments were measured with the linear trend X2test [6,7,8]. The Akaike information criteria (AIC) value within a Cox proportional hazard regression model also was calculated for each category to measure its discrimination ability and identify the optimal categorization of EMs that afforded the T, N, and M stages the highest power of discrimination of survival outcome for each stage [9]. The AIC (AIC =226Log likelihood+26No. of parameters in the model) is an estimate of the measure of fit of a model to a given set of data. The model of choice achieves parsimony with maximum likelihood and the lowest value of AIC, indicating the smallest loss of information for predicting outcome [10,11,12,13]. All statistical analyses were performed using SPSS software version 18.0 (SPSS Inc., Chicago, IL).
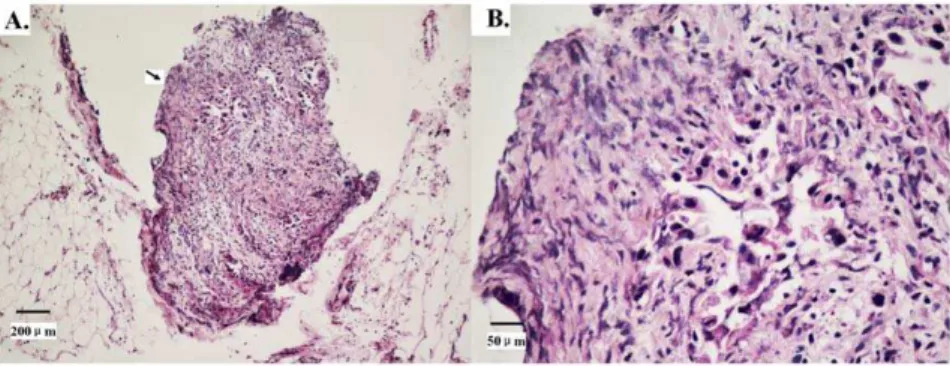
Figure 1. Haematoxylin and eosin staining shows extranodal metastasis (EM) in gastric carcinoma.Tumor cells are scattered into the resected adipose connective tissue around the stomach distinct from the metastatic lymph node.1A: Original magnification6100, arrow indicates the EM.1B: Original magnification6400.
Results
Of the 1343 patients, 902 (67.2%) were males, and 441 (32.8%) were females. The mean age of the patients was 56.4611.9 years (range 17–85 years). The overall 5-year survival rate for all patients was 55.9%, and 730 patients were alive when our follow-up was completed.
Stage distribution included 192 (14.3%) patients with stage I, 408 (30.4%) patients with stage II, 743 (55.3%) with stage III according to the 7th edition TNM staging system [5]. Consider-ation of the possible origin for EMs excluded from implantConsider-ation on peritoneal surfaces, we investigated the incidence of EMs for 1343 cases of patients with potential radical resection.
Overall, EMs were detected in 179 (13.3%) of the 1343 patients and in 359 (1.8%) of the 20,047 nodules retrieved as ‘lymph nodes’. In the 179 patients with EM, 102 patients were detected with 1 EM, 29 patients with 2 EMs, and 48 patients with$3 EMs. The mean number of metastases of this type was 1.44 (median 1.37, range 1–7). Figure 1 shows an example of EMs.
The incidence of EMs was significantly higher in patients with total gastric carcinoma, larger tumors (.5.0 cm) and in those with poorly and undifferentiated carcinoma (G3/G4). EMs was found significantly more common in tumors with lymphatic/venous invasion. Additionally, patients with EMs had a significantly deeper tumor invasion (T4a and T4b) and more number of lymph node metastases (N3). Tumor stage was III in 141 (78.8%) of 179 patients with EMs. (Table 1)
Regarding survival, univariate analysis was performed in 1343 patients who underwent potentially radical resection. Variables including age, tumor location, size, differentiation, lymphatic/ venous invasion, EMs, pT, pN, and TNM staging correlated well with the patients’ life expectation. In the multivariate analysis, EMs emerged as an independent prognostic factor for survival together with the aforementioned factors (HR = 1.412, 95%CI = 1.151–1.731, P,0.001). (Table 2)
Positive EMs were significantly associated with a shorter survival time (P,0.001) (Fig. 2A). Analysis of patients grouped according to the number of EMs revealed that patients with EMs
$3 had an even worse postoperative survival than that of patients with the number of EMs less than 3. The 5-year survival rate of patients with the number of EMs as 1, 2, and$3 were 35.2%, 27.6%, and 6.8% (P = 0.337 and 0.001, respectively) (Fig. 2B).
In order to incorporate the EMs into the T, N, and M categories, we divided EMs as two separate groups, EM1 (with the number of EMs ,3) and EM2 (with the number of EMs $3), according to the comparable survival outcomes between patients with the number of 1 and 2 EMs and the distinct survival outcomes between patients with the number of 2 and$3 EMs.
First, we compared the survival curve between patients with EM1 and T stage. The Kaplan-Meier plots showed a good discriminatory ability between patients with pT4a stage and patients with EM1 (5-year survival rate 48.8% vs. 32.6%, P = 0.002), also between patients with EM1 and those with T4b stage (5-year survival rate 32.6% vs. 23.4%, P = 0.016) (Fig. 3A). Secondly, when we compared the survival outcomes between patients with EM1 and N stage, the overall survival rate of patients with EM1 was found almost comparable to that of patients with N3 stage (5-year survival rate 31.3% vs. 32.6%, P = 0.437) and was found significant worse than that of patients with N2 stage (5-year survival rate 32.6% vs. 44.1%, P = 0.039) (Fig. 3B). Thirdly, when we investigated the possible origination of EM2 from peritoneal seeding, we found that the overall survival rate of patients with EM2 showed similar to that of aforementioned 106 cases of stage
IV patients. The 5-year survival rate was 6.8% and 5.6%, respectively (P = 0.896) (Fig. 3C).
Furthermore, we realized that 78.8% (141 of 179) of the EMs was mainly found in stage III patients, with 103 cases of EM1 and 38 cases of EM2. In order to investigate the incidence and influence of EM1 in stage III patients, we analyzed the survival outcomes with and without consideration of EM1 as N3. Without
Table 1.Correlation between Extranodal Metastasis and clinicopathological factors in gastric carcinoma patients with potential radical resection.
Variable Extranodal Metastasis P value
Positive (%) N = 179
Negative (%) N = 1164
Gender 0.426
Male 125 (13.9) 777 (86.1)
Female 54 (12.2) 387 (87.8)
Age (year) 0.674
,60 97 (12.8) 662 (87.2)
$60 82 (14.0) 502 (86.0)
Tumor location ,0.001
Proximal 96 (13.3) 628 (86.7)
Distal 62 (10.9) 505 (89.1)
Total 21 (40.4) 31 (59.6)
Tumor size (cm) ,0.001
#5.0 78 (9.8) 714 (90.2)
.5.0 101 (18.3) 450 (81.7)
Histological grade ,0.001
Well/Moderately differentiated (G1+G2)
38 (7.6) 465 (92.4)
Poorly differentiated (G3) 97 (16.9) 476 (83.1) Undifferentiated (G4) 44 (16.5) 223 (83.5)
Lymphatic/Venous invasion ,0.001
No 146 (11.8) 1096 (88.2)
Yes 33 (32.7) 68 (67.3)
Depth of invasion (AJCC 7th edition)
,0.001
T1 0 (0) 118 (100.0)
T2 4 (2.3) 167 (97.7)
T3 31 (12.2) 223 (87.8)
T4a 120 (17.8) 555 (82.2)
T4b 24 (19.2) 101 (80.8)
Nodal status (AJCC 7th edition)
,0.001
N0 24 (5.2) 440 (94.8)
N1 37 (13.9) 230 (86.1)
N2 43 (13.1) 285 (86.9)
N3 75 (26.4) 209 (73.6)
TNM staging (AJCC 7th edition)
,0.001
Stage I 2 (1.0) 190 (99.0)
Stage II 36 (8.8) 372 (91.2)
Stage III 141 (19.0) 602 (81.0)
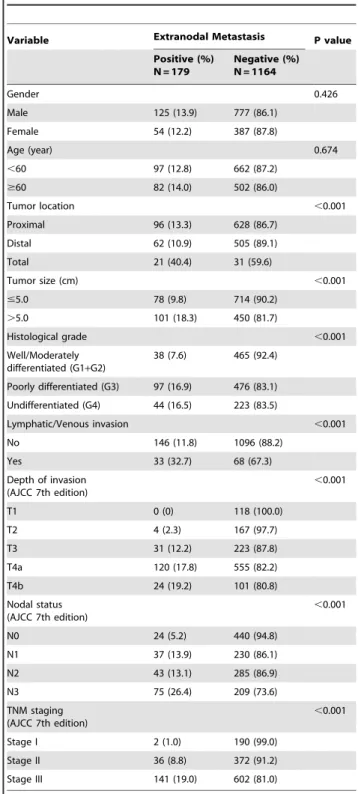
consideration of EM1, the distribution of stage III was 27 cases of stage IIIA, 37 cases of stage IIIB, and 39 cases of stage IIIC patients. The survival curves were shown in Fig. 4A, in which the survival difference in each substage was confused (P = 0.991). When we treated the EM1 as N3 patients, the distribution of stage III was changed as 1 case of stage IIIA, 27 cases of stage IIIB, and 75 cases of stage IIIC patients. The survival curves were shown discriminatory in each substage (P = 0.023) (Fig. 4B).
In terms of the results aforementioned, different survival outcomes based on the T, N and M stage were compared among the following 4 redefinitions of the T, N and M categories: A, the 7th edition TNM definition without considering EMs; B, redefinition of T stage with EM1 treated as TEM stage; C,
redefinition N stage with EM1 treated as N3 stage; D, redefinition of M stage with EM2 treated as M1. The performance of the 7th edition TNM staging systems with redefinitions of the T, N, and M categories was assessed by the linear trend X2, likelihood ratio X2, and the AIC tests, which was described in Table 3. Compared with the 7th edition staging system without consideration of EMs, the redefinition of T stage treated with EM1 as TEM stage,
redefinition of N stage with EM1 treated as N3 stage and redefinition of M stage with EM2 treated as M1 stage all had higher linear trend X2scores and likelihood ratio X2scores, and lower AIC value, which represented the optimum prognostic stratification, together with better homogeneity, discriminatory ability, and monotonicity of gradients. (Table 3)
Discussion
Dependent on the pathological examination, a large variation in the incidence of EMs has been reported in previous studies, ranging from 10 to 28% of cases [1,2], mainly due to less caution about this special type of cancer deposit and its prognostic value. In the present study, we investigated the clinical parameters and the prognostic value of EMs in a group of patients who underwent potentially radical resection for gastric carcinoma, in which we found that the incidence of EMs was 179 (13.3%) in 1343 patients. The results revealed that the presence of EMs had a significant correlation with the total gastric carcinoma, larger tumor, poorly and undifferentiated carcinoma (G3/G4), lymphatic/venous invasion, deeper tumor invasion (T4a and T4b) and more number of lymph node metastases (N3), which were proven with worse survival outcomes. In multivariate analysis, present of EMs maintained as an independent prognostic factor for gastric
carcinoma patients with poor postoperative survival (HR = 1.412, 95%CI = 1.151–1.731, P,0.001). This phenome-non is consistent with the finding that EMs showed a close correlation with cancer aggressiveness reported in previous studies. While in previous studies, the patients who were found peritoneal seeding in the operation were also enrolled and investigated [1,2]. In terms of the 7th edition UICC staging system of gastric carcinoma, the type of EMs implanted on peritoneal surfaces are clearly deemed as distant metastases (stage IV). So our study mainly investigated the classification of EMs in patients underwent potential radical resection and excluded patients with obvious peritoneal seeding revealed during operation. Firstly, we found that the survival outcomes were similar between patients with the number of 1 and 2 cases of EMs and distinct with patients with$3 cases of EMs, which may indicate different origin and classification of this type of metastasis. Secondly, we divided EMs into two separate groups (EM1 and EM2) according to aforementioned distinct survival outcomes and investigated the possible classifica-tion. In T stage, we found that the 5-year survival rate was different among patients with T4a, EM1 and T4b. In N stage, the 5-year survival rate of patients with EM1 was comparable to those of N3 stage and was worse than those of N2 stage. In M stage, the result revealed that patients with EM2 had a comparable survival with those of M1stage. Furthermore, with the consideration of EM1 mainly in stage III patients, we investigated the influence of EM1 in each substage of stage III patients. The results also supported that EM1 should be considered as N3 stage, if not, the survival outcomes will be confused in each substage. Finally, we validated our results utilizing the linear trend X2, likelihood ratio X2, and the AIC tests to confirm the homogeneity, discriminatory ability, and monotonicity of gradients of our novel classification. Compared with the 7th edition TNM staging system without consideration of the EMs, the new categories for N3 and M1 stage demonstrated that they performed better homogeneity, discrim-inatory ability, and monotonicity of gradients.
Although little evidence is available on the prognostic value of EMs in gastric carcinoma patients, the presence of EMs was incorporated in the TNM staging manuals in 1997 for the first time, in which EMs were deemed as T or N stage in terms of their shape [3]. The shape of tumor deposits is, however, not sufficient to consistently distinguish different types of tumor involvement of the perivisceral fat [14]. In our opinions, classification of EMs based on their shapes is relatively subjective, insufficiently validated, and difficult to clinical Table 2.Univariate and multivariate survival analysis of clinic-pathologic variables in 1343 cases of gastric carcinoma patients with potential radical resection.
Variables Univariate analysis Multivariate analysis
HR 95%CI P value HR 95%CI P value
Gender (female vs. male) 0.962 0.814–1.136 0.645
Age (year), ($60 vs.,60) 1.433 1.226–1.675 ,0.001 1.468 1.254–1.719 ,0.001
Location (distal/proximal/total) 0.749 0.646–0.868 ,0.001 0.720 0.625–0.829 ,0.001
Size (cm) (.5 vs.#5) 2.110 1.804–2.468 ,0.001 1.601 1.365–1.878 ,0.001
Differentiation (G3/G2/G1) 1.257 1.133–1.393 ,0.001 1.184 1.061–1.321 0.003
Lymphatic/Venous invasion (Yes vs. No) 2.038 1.408–2.832 ,0.001 1.814 1.319–2.445 ,0.001
EM (Positive vs. Negative) 2.362 1.949–2.862 ,0.001 1.412 1.151–1.731 ,0.001
T (T4b/T4a/T3/T2/T1) 1.811 1.654–1.984 ,0.001 1.478 1.338–1.632 ,0.001
N (N3/N2/N1/N0) 1.650 1.538–1.769 ,0.001 1.417 1.311–1.531 ,0.001
Figure 2. Prognostic significance of extranodal metastasis (EM) on overall survival rate of the gastric carcinoma patients underwent curative surgery. 2A: A positive EM was significantly associated with a shorter survival time (P,0.001).2B: Overall survival curves of gastric carcinoma patients stratified by EM number (0, 1, 2,$3), (P,0.001, P = 0.337, P = 0.001, respectively).
doi:10.1371/journal.pone.0019557.g002
Figure 3. Comparison of survival curves between EMs and the T, N, M stages. 3A: Overall survival curves showed different outcomes among patients with T4a, EM1 and T4b (P = 0.002 and 0.016, respectively).3B: Overall survival of patients with EM1 was worse than those of the N2 stage and was comparable to those of the N3 stage (P = 0.039 and 0.437, respectively).3C: Patients with EM2 had a comparable overall survival with those of the M1 stage (P = 0.896).
utilizing. In colorectal cancer, some authors suggested that EMs should not be classified on the basis of the shape but according to their origin [14,15]. Furthermore, in our present study, we demonstrated that the prognosis of patients with EM1 were distinct to neither T4a nor T4b patients, which indicated that the EMs should be not classified into T stage. In the 7th edition system, the classification of EMs was revised and updated to either to N or M stage although it was still relatively ambiguous [5]. Tanaka et al. revealed that the extranodal invasion was a significant risk factor for peritoneal metastasis in gastric carcinoma that EMs maybe indicated to M category [1]. Puppa et al. suggested that such tumor extension represented peritoneal seeding from either the primary tumor or metastatic lymph nodes and may rather be included in the M category for staging purposes as they represented in-transit metastases, both in colorectal cancer and other adenocarcinomas such as gastric, biliary duct and pancreatic carcinomas [14,16]. For the aspect of clinical practice, one of the main objectives of the TNM classification is to provide prognostic information useful for deciding the best treatment options for the patients, stratifying them into groups that are prognostically and therapeutically
similar [17]. In our study, we intended to incorporate the EMs into TNM staging system according to its prognostic information which differed with previous proposals. Although previous study has demonstrated that the number of EMs was correlated with poor prognosis of gastric carcinoma [2], in our study number of EMs, for the first time, was taken into account for classification of TNM staging. To validate the feasibility of our assignment for EM1 and EM2, methods of linear trend X2, likelihood ratio X2, and the AIC tests were used. According to Ueno et al. [18], the performance of the staging system can be evaluated as homogeneity within subgroups, discriminatory ability between different groups, and monotonicity of gradients shown in the correlation between stages and survival rates. In our study, the new categories of EM1 and EM2 incorporating into N3 and M1 staging performed better homogeneity (higher likelihood ratio X2 score), discriminatory ability, and monotonicity of gradients (higher linear trend X2 score). More importantly, the new categories also showed smaller AIC value, representing the optimum prognostic stratification and indicating the smallest loss of information for predicting outcome. These results demon-strated better prognostic stratifications of our assignment for
Figure 4. Comparison of survival curves among 103 cases of stage III patients with EM1 before and after consideration of EM1. 4A: Patients with EM1 had a comparable overall survival curves among each substage when EM1 was ignored (P = 0.991).4B: Patients with EM1 had a distinguishable overall survival curves among each substage when with the consideration of EM1 as N3 stage (P = 0.023).
doi:10.1371/journal.pone.0019557.g004
Table 3.Definitions of T, N and M categories and their impact on the prognostic value of staging.
Category Definition Subgroups Linear Trend X2 Likelihood Ratio X2 *AIC
A 7th ed. T stage (n = 1343) T1, T2, T3, T4a, T4b 171.755 201.840 8556.400
7th ed. N stage (n = 1343) N0, N1, N2, N3 184.258 194.901 8547.653
7th ed. M stage (n = 1503) M0, M1 112.316 133.065 10488.061
B Number of 1 and 2 EMs (EM1) treated as TEMstage (n = 1343)
T1, T2, T3, T4a, TEM,T4b 201.580 235.795 8515.847
C Number of 1 and 2 EMs (EM1) treated as N3 stage (n = 1343)
N0, N1, N2, N3 235.104 247.322 8508.678
D Number of$3 EMs (EM2) treated as M1 stage (n = 1503)
M0, M1 153.143 179.471 10421.502
EMs than the 7th edition TNM staging system without consideration of EMs.
We acknowledge several limitations in this study. Our sample population is from a single institution experience and relatively small compared with the worldwide gastric cancer collaboration database, and is based on a retrospective study. While the strengths of this study are that the surgical procedures, pathologic examinations, and patient follow-up were uniform throughout the entire study period. Cancer staging is a dynamic process. As our understanding of cancer biology improves, the TNM staging system will need to be revised accordingly. Our present study
demonstrated the EMs as an important prognostic factor and for the first time intended to incorporate it into N3 or M1 staging according to its number retrieved in postoperative samples in patients with gastric carcinoma.
Author Contributions
Conceived and designed the experiments: WW Y-fL. Performed the experiments: D-zX Y-xG Y-bC X-wS WL Y-qZ Z-wZ. Analyzed the data: WW X-hY X-yF. Contributed reagents/materials/analysis tools: WW Y-fL YZ. Wrote the paper: WW.
References
1. Tanaka T, Kumagai K, Shimizu K, Masuo K, Yamagata K (2000) Peritoneal metastasis in gastric cancer with particular reference to lymphatic advancement; extranodal invasion is a significant risk factor for peritoneal metastasis. J Surg Oncol 75: 165–171.
2. Etoh T, Sasako M, Ishikawa K, Katai H, Sano T, et al. (2006) Extranodal metastasis is an indicator of poor prognosis in patients with gastric carcinoma. Br J Surg 93: 369–373.
3. Sobin LH, Wittekind C (1997) UICC TNM classification of malignant tumours, 5th edition.
4. Sobin LH, Wittekind C (2002) TNM classification of malignant tumours, 6th edition.
5. Sobin LH, Gospodarowicz MK, Wittekind C (2010) TNM classification of malignant tumours, 7th edition.
6. Japanese Gastric Cancer Association (1998) Japanese Classification of Gastric Carcinoma - 2nd English Edition. Gastric Cancer 1: 10–24.
7. Hsu PK, Wu YC, Chou TY, Huang CS, Hsu WH (2010) Comparison of the 6th and 7th editions of the American Joint Committee on Cancer tumor-node-metastasis staging system in patients with resected esophageal carcinoma. Ann Thorac Surg 89: 1024–1031.
8. Wang W, Sun XW, Li CF, Lv L, Li YF, et al. (2010) Comparison of the 6th and 7th Editions of the UICC TNM Staging System for Gastric Cancer: Results of a Chinese Single-Institution Study of 1,503 Patients. Ann Surg Oncol, [Epub ahead of print].
9. Akaike H (1973) Information theory and an extension of the maximum likelihood principle. Proceedings of the Second International Symposium on Information Theory. pp 267–281.
10. Harrell FE, Jr., Califf RM, Pryor DB, Lee KL, Rosati RA (1982) Evaluating the yield of medical tests. JAMA 247: 2543–2546.
11. Wunder JS, Healey JH, Davis AM, Brennan MF (2000) A comparison of staging systems for localized extremity soft tissue sarcoma. Cancer 88: 2721–2730. 12. Kee KM, Wang JH, Lee CM, Chen CL, Changchien CS, et al. (2007)
Validation of clinical AJCC/UICC TNM staging system for hepatocellular carcinoma: analysis of 5,613 cases from a medical center in southern Taiwan. Int J Cancer 120: 2650–2655.
13. Cho YK, Chung JW, Kim JK, Ahn YS, Kim MY, et al. (2008) Comparison of 7 staging systems for patients with hepatocellular carcinoma undergoing transarterial chemoembolization. Cancer 112: 352–361.
14. Puppa G, Maisonneuve P, Sonzogni A, Masullo M, Capelli P, et al. (2007) Pathological assessment of pericolonic tumor deposits in advanced colonic carcinoma: relevance to prognosis and tumor staging. Mod Pathol 20: 843–855. 15. Wunsch K, Muller J, Jahnig H, Herrmann RA, Arnholdt HM, et al. (2010) Shape is not associated with the origin of pericolonic tumor deposits. Am J Clin Pathol 133: 388–394.
16. Puppa G, Ueno H, Kayahara M, Capelli P, Canzonieri V, et al. (2009) Tumor deposits are encountered in advanced colorectal cancer and other adenocarci-nomas: an expanded classification with implications for colorectal cancer staging system including a unifying concept of in-transit metastases. Mod Pathol 22: 410–415.
17. Greene FL, Sobin LH (2008) The staging of cancer: a retrospective and prospective appraisal. CA Cancer J Clin 58: 180–190.