www.atmos-chem-phys.net/11/2309/2011/ doi:10.5194/acp-11-2309-2011
© Author(s) 2011. CC Attribution 3.0 License.
Chemistry
and Physics
An overview of the HIBISCUS campaign
J.-P. Pommereau1, A. Garnier1, G. Held2, A. M. Gomes2, F. Goutail1, G. Durry1,*, F. Borchi1, A. Hauchecorne1, N. Montoux1, P. Cocquerez3, G. Letrenne3, F. Vial4, A. Hertzog5, B. Legras4, I. Pisso4, J. A. Pyle5, N. R. P. Harris5, R. L. Jones5, A. D. Robinson5, G. Hansford5, L. Eden5, T. Gardiner6, N. Swann6, B. Knudsen7, N. Larsen7, J. K. Nielsen7, T. Christensen7, F. Cairo8, F. Fierli8, M. Pirre9, V. Mar´ecal9, N. Huret9, E. D. Rivi`ere9,*, H. Coe10, D. Grosvenor10, K. Edvarsen11, G. Di Donfrancesco12, P. Ricaud13, J.-J. Berthelier14, M. Godefroy14, E. Seran14, K. Longo15, and S. Freitas15
1CNRS-Service d’A´eronomie (SA), now: CNRS-LATMOS, Universit´e de Versailles, France 2Instituto de Pesquisas Meteorol´ogicas, UNESP, Bauru, Brazil
3Centre National d’Etudes Spatiales (CNES), Toulouse, France
4CNRS-Laboratoire de M´et´eorologie Dynamique (LMD), Palaiseau, France 5University of Cambridge (UCAM), Dept. of Chemistry, Cambridge, UK 6National Physical Laboratory (NPL), Teddington, UK
7Danish Meteorological Institute, Copenhagen, Denmark
8Consiglio Nazionale delle Ricerche, Istituto di Scienze dell’Atmosfera e del Clima (CNR-ISAC), Roma, Italy 9CNRS-Laboratoire de Physique et Chime de l’Environnement (LPCE), Orl´eans, France
10University of Manchester, Manchester, UK
11Norwegian Institute for Air Research (NILU), Kjeller, Norway
12Agenzia nazionale per le nuove tecnologie, l’energia e lo sviluppo economico sostenibile, (ENEA), Roma, Italy 13CNRS Laboratoire d’A´erologie (LA), Toulouse, France
14Centre d’Etude des Environnements Terrestre et Plan´etaires (CETP), now: CNRS-LATMOS, Universit´e de Versailles St. Maur, France
15Centro de Previs˜ao de Tempo e Estudos Clim`aticos (CPTEC), Cachoeira Paulista, Brazil
*now at: Universit´e de Reims Champagne-Ardennes, CNRS Groupe de Spectrom´etrie Mol´eculaire et Atmosph´erique (GSMA), France
Received: 19 January 2007 – Published in Atmos. Chem. Phys. Discuss.: 21 February 2007 Revised: 14 February 2011 – Accepted: 25 February 2011 – Published: 15 March 2011
Abstract. The EU HIBISCUS project consisted of a series of field campaigns during the intense convective summers in 2001, 2003 and 2004 in the State of S˜ao Paulo in Brazil. Its objective was to investigate the impact of deep convection on the Tropical Tropopause Layer (TTL) and the lower strato-sphere by providing a new set of observational data on me-teorology, tracers of horizontal and vertical transport, water vapour, clouds, and chemistry in the tropical Upper Tropo-sphere/Lower Stratosphere (UT/LS). This was achieved us-ing short duration research balloons to study local phenom-ena associated with convection over land, and long-duration
Correspondence to:J.-P. Pommereau ([email protected])
balloons circumnavigating the globe to study the contrast be-tween land and oceans.
Weather Forecast Models (NWP) underestimating the over-shooting process. Finally, the data collected by the HIBIS-CUS balloons have allowed a thorough evaluation of tem-perature NWP analyses and reanalyses, as well as satellite ozone, nitrogen oxide, water vapour and bromine oxide mea-surements in the tropics.
1 Introduction
The tropical Upper Troposphere/Lower Stratosphere (UT/LS) is a key region for both stratospheric ozone deple-tion and climate. It is the source region of ozone-depleting substances, like organic chlorine, bromine and possibly iodine, as well as long-lived source gases such as nitrous oxide, methane, which after oxidation at high altitude and transport at mid-and high latitude by the Brewer-Dobson circulation are controlling ozone chemistry. It is also the region controlling the water vapour content of air entering the stratosphere, partly responsible for the cooling of the stratosphere. The tropical UT/LS is the altitude level where ozone, an efficient greenhouse gas at this altitude, is found to be highly variable for several possible reasons: (a) its convective uplift from the surface; (b) its formation by photochemical precursors; (c) the quasi-horizontal exchange with the lowermost stratosphere; and (d) because the region is the most exposed to NOx production by lightning within thunderstorms.
However, there are a number of unresolved issues in the tropical UT/LS, such as the impact of local convec-tive overshooting on troposphere-to-stratosphere transport (TST), on the hydration/dehydration processes of air enter-ing the stratosphere, and on the concentration of short-lived chemical species in the UTLS, which is highly dependent on the speed of their lofting. Based on the assumption that the largest vertical motion into the stratosphere occurs where the temperature of the tropopause is the lowest, Newell and Gould-Stewart (1981) suggested the idea of a limited region of entry of dehydrated tropospheric air into the stratosphere, namely the “Stratospheric Fountain” above Indonesian Is-lands and Micronesia, also called “the Maritime Continent”. A remarkable characteristic of convection in this region, and to some extent in the entire tropical belt, is its large intra-seasonal variability associated with the phase of the Madden-Julian oscillation (MJO) (Wheeler et al., 2009 and references therein). However studies from a number of years (e.g., Danielsen (1993) from ER-2 observations during the STEP mission over Northern Australia in 1987, and analyses of ra-diosondes or radar observation in Darwin and Samoa in the Southern Pacific, e.g., Folkins et al., 1999; Gettelman et al., 2002; May and Ballinger, 2007), maritime convection is on average less intense and hardly penetrates the stratosphere compared to continental systems, although large overshoots
can occur above tropical cyclones (Ebert and Holland, 1993; Tuck et al., 1997).
However, such systems are generally thought rare and thus unimportant at the global scale. On average, convection reaches only the upper troposphere where a barrier to ver-tical mixing could be generally observed around 14 km, the bottom of the so-called Tropical Tropopause Layer (TTL) (Folkins et al., 1999). The proposal thus made by Sherwood and Dessler (2000) for troposphere-stratosphere exchange is a two-step process: a vigorous convective lifting up to the bottom of the TTL followed by a slow ascent after radiative heating in the TTL, a process known as the “mixing layer” hypothesis. A revised concept of TTL and a thorough de-scription of the vertical transport process within the layer are provided by Fueglistaler et al. (2009), who noted in their conclusion that “the effect of overshooting convection on the heat balance of the TTL is still a major unknown”.
Before HIBISCUS, most observations had been carried out over oceanic areas because of the many problems in mak-ing in-situ aircraft or balloon observations next to deep con-vection over land. In addition, the frequency of occurrence of stratosphere-penetrating land mesoscale systems was hard to assess. It is only recently that space-borne precipita-tion radar (PR) and visible-IR imager (VIIRS) observaprecipita-tions aboard the NASA Tropical Rainfall Measurements Mission satellite (TRMM) have shown that land convective systems, developing in the afternoon, reached higher altitudes than maritime systems (Nesbitt et al., 2000; Alcala and Dessler, 2002; Nowicky and Merchant, 2004; Liu and Zipser, 2005).
Within this context, the objectives of HIBISCUS were to provide a set of new observational data on meteorology, trac-ers of horizontal and vertical transport, water vapour, clouds, and chemistry in the tropical UT/LS from balloon observa-tions at local scale within a subtropical convective land area in Brazil, as well as at global scale using circumnavigat-ing long-duration balloons, for studycircumnavigat-ing the contrast between continents and oceans, the representation of temperature and wind in the Numerical Weather Prediction (NWP) models analyses, and the performances of satellite ozone and chem-icals measurements in the tropics. This overview describes the background of the project, including the available obser-vational and modelling tools, and highlights the most signif-icant results.
2 Campaign context
The campaigns took place in Bauru (22.3◦S, 49◦W) in the
Fig. 1.Precipitation (mm) in South America in January. ITCZ is the Intertropical Convergence Zone near the equator. Bauru (22.3◦S, 49◦W) is located in the convectively active region of the South At-lantic Convergence Zone (SACZ) and has a 260 mm average rainfall during the month.
State University (UNESP). Importantly, Bauru offers a suit-able balloon launch area, and crucially, a Doppler radar for thunderstorms monitoring during launch operations.
2.1 Meteorology
As shown by the potential vorticity altitude-latitude cross-section and the maps displayed in Figs. 2 and 3, Bauru is located in an area of easterly wind north of the subtropical jet in the lower stratosphere and on the south-east side of the Bolivian upper tropospheric high in a W-SW wind regime (see Huntrieser et al., 2007). From Bauru, short-duration balloons can fly west towards accessible areas with safe pay-load recovery for short-duration balloons and towards the Pa-cific for the long-duration balloons to start their tropical cir-cumnavigation. Even during an episode of maximum north-ward shift of the sub-tropical barrier, such as on 31 January 2004, shown in Figs. 2 and 3, the UTLS above this region is still tropical in nature. The lapse rate tropopause (LRT, dT/dZ≤ ±2◦C km−1following WMO definition) is on av-erage at around 16 km (370 K), surmounted by a cold point tropopause (CPT) 1.5–2 km higher. In February 2004, the frequency of days when one or more echo tops was observed above 15 km was of 58% (Fig. 4 from Gomes and Held, 2004), displaying a strong daily maximum at around 16:00– 17:00 local time. The average maximum latitude of echo-tops was 18 km (Fig. 5 from Pommereau and Held, 2007).
2.2 Observational context
The short- and long-duration balloons were operated by the French Centre National d’Etudes Spatiales (CNES). These were complemented by a set of radiosondes, backscatter and ozone-sondes, and ground-based observations (Doppler
Fig. 2. Meridional cross-section of potential vorticity (pv unit) at 50◦W on 31 January 2004, the day of largest northward shift of the sub-tropical barrier during the campaign. The vertical line indicates the latitude of Bauru. In the upper troposphere and the lower strato-sphere it is still north of the maximum PV meridional gradient, the location of the sub-tropical jet, in a region of tropopause at 2 PV unit at 380 K, that is still in the Tropical Tropopause Layer.
Fig. 3.Potential Vorticity (pv unit) maps on the same day at 475 K in the stratosphere (left), at 380 K at the tropopause level (middle), and at 350 K in the troposphere (right). The location of Bauru is in-dicated by a white star. At 475 K in the stratosphere is in a region of easterly wind north of the sub-tropical jet (the region of maximum meridional PV gradient) and at 350 K in a region of W-SW wind blowing around the South American upper tropospheric high. The tropopause level at 380 K, around 15.5 km, is a level of light wind of maximum mixing between the mid-latitude and the tropics.
Fig. 4. Frequency of days in February 1996–2004 (no survey in 2003) when one or more echo tops (10 dBZ threshold reflectivity, storm volume≥50 km3)was observed above 15 km altitude within the 240 km range of the IPMet S-band radar in Bauru (Gomes and Held, 2004). February 2004 was among the most active month among the 8 yr of observation.
National Oceanic and Atmospheric Administration (NOAA) ozonesonde stations of Samoa and Fiji, as well as with the French Reunion Island station for dedicated ascents during the overpass of the long-duration balloons.
The deployment of such a complex experiment at a rela-tively new facility in a region prone to thunderstorms dur-ing the rainy season (only two short-duration flights in 1997, Pommereau et al., 1999) was challenging, especially as it included the deployment of several new instruments and payloads and the use of new balloons designed for slow overnight descents across the TTL. The preparation of the HIBISCUS campaign involved a number of instrument test flights in France as well as in the tropics in 2001–2003. Two preliminary campaigns took place in Bauru during the austral summer 2000–2001 and later in February 2003, whose data, available in the HIBISCUS database, have been also used for scientific purposes.
A decisive advantage was the interest of Brazilian scien-tists to participate in the project through a number of collab-orative observations, as well as in the analysis and interpreta-tion of the data. Under the coordinainterpreta-tion of IPMet and the um-brella of the TroCCiBras Brazilian project, HIBISCUS and TROCCINOX could develop a mutually beneficial scientific collaboration with a number of Brazilian research institutes.
3 Balloons and ground-based instrumentation, satellites and modelling tools
A number of in situ and remote sensing instruments have been flown during HIBISCUS on short- and long-duration platforms. The balloons, their instrumentation, as well as the models used were essentially those developed during the 1990’s for investigating polar ozone depletion in the Arctic (Newman et al., 2002), and subsequently adapted for use
Fig. 5.Diurnal variation of maximum echo-top height average and standard deviation seen by the Bauru radar within its 240 km range during the high and medium convective days (2800 counts/day av-erage).
in the tropics. Balloon operations and measurements were complemented by several ground-based and satellite obser-vations, and a variety of models. They are briefly described below.
3.1 Short-duration balloons
The balloons used for these flights were of three types: i. small Zodiac stratospheric balloons (SF) of 3000 m3
volume of 25 µm material, carrying 150 kg at 22 km. They were designed to descend slowly after sunset by radiative cooling to allow in situ measurements in the TTL,
ii. Zodiac Light (ZL) of 16 µm polyethylene and 10 000 m3 volume balloons, carrying 120 kg for an ascent to 30 km followed by a short float for 1–2 h at sunset for solar occultation measurements, and
iii. aerostar plastic balloons of 240 and 1500 m3volume for soundings with payloads of 10–20 kg.
The list of instruments included:
Laser) of CNRS-SA for water vapour and methane, a surface acoustic wave (SAW) hygrometer and an ozone solid state sensor (O3SSS) of UCAM, a Laser Basckscatter Sonde (LABS) of CNR-ISAC for aerosols, and an electric field probe of CETP;
ii. five remote sensors: a Syst`eme d’Analyse par Ob-servation Zenitale (SAOZ) UV-visible spectrometer of CNRS-SA for O3and NO2profiles and a UV extended version of the same instrument for O3, NO2, BrO and aerosols profiles by solar occultation during the daytime ascent of the balloon and from float altitude at sunset, a UV radiometer of NILU for daytime photolysis rates retrievals, a downward looking MULID micro-lidar of ENEA and CNR-ISAC for aerosols and clouds vertical profiling, and an optical lightning detector; and, iii. ozone Electro-Chemical-Cell (ECC) and aerosols
backscatter (BKS) sondes.
A short description of each is provided in the Appendix.
3.2 Long-duration balloons
Two types of long-duration balloons were used: (i) con-stant level 8.5 m or 10 m diameter spherical 12 µm thick My-lar constant altitude super-pressure balloons (SPB) carry-ing 20 kg at respectively 18 and 19 km; and (ii) Infra-Red Montgolfier (MIR) balloons of 45 000 m3volume in 15 µm aluminized Mylar for the upper part and 12 µm transparent polyethylene for the bottom, carrying 60 kg at 28 km during daytime and 20–24 km at night depending on the cloud cover (Pommereau and Hauchecorne, 1979). The payloads carried on each type of balloon were chosen based on their technical maturity with respect to the severe thermal, power, weight and telemetry constraints.
The payload on SBP flights designed by CNRS-LMD, called RUMBA, included a Global Positioning System (GPS) for location (±10 m) and horizontal wind calcula-tion (±0.01 m s−1), a pressure (±0.6 hPa) and two temper-ature sensors (±0.25 K at night, 0.3 K during daytime). The measurements were sampled every 15 min and transmitted via the ARGOS telecommunication system. The tempera-ture sensors were small thermistors, mounted 180◦apart on a 1-m boom, hanging 5 m below the gondola. Two types of small passenger instruments were mounted: a combina-tion of O3SSS and SAW sensors on the balloons flying at 18 km near the cold point tropopause and a prototype of tur-bulence sensor designed by CNRS-LMD on those flying at 19 km. The O3SSS and SAW were essentially identical to those flown on the short-duration balloons, even though the operational methods were tailored to the constraints of the long-duration flights. The turbulence sensor was made of a micro-accelerometer (10−6g resolution) sampled at high frequency (200 Hz) measuring the motion of the gondola in-duced by atmospheric turbulence. The variance in several
spectral bands between 0 and 100 Hz was transmitted to the ground.
Depending on the flight, the MIRs were carrying one or two payloads: a CNES service gondola controlling the flight (Inmarsat telemetry and remote control) hosting a micro-lidar, or the service payload and an independent SAOZ pay-load suspended 40 m below. The service paypay-loads included a GPS, a pressure sensor and two thermistors, as well as a lightweight (160 g) global IR radiometer of CNRS-SA based on a design proposed Suomi and Kuhn (1958). The nadir-looking MULID micro-lidar was similar to those flown on short duration balloons, but only operated every 15 min dur-ing the night for backscatter and depolarization profiles under the balloon. The SAOZ long-duration version was similar to that used on short-duration balloons, but with two important differences: (i) the spectral range extended up to 1000 nm for the measurement of stratospheric water vapour around 760 and 940 nm; and (ii) onboard spectral analysis was used due to the limitation in the telemetry capacity of the ARGOS system. Results of the analysis only (slant columns and fit-ting errors) were transmitted, whilst the spectra were stored on board in case of recovery at the end of the flight, which was always the case when the flight ended over a continent. The SAOZ payload was equipped with a GPS, Vaisala RS80 pressure and temperature sensors and two optical detectors respectively nadir- and zenith-viewing for the detection of lightning flashes and at zenith for blue-jets.
3.3 Ground-based observations and operational modelling
Ground-based instruments and meteorological products were provided by the TroCCiBras project (Held et al., 2007, 2008), which were essential for operations and interpretation of bal-loon data:
i. two Doppler S-band Doppler radars at Bauru (BRU) and at Presidente Prudente (PPR) located 240 km west of Bauru in the direction of the balloon flights were exten-sively used for balloon flight decisions;
ii. Vaisala RS80 radio-soundings four times per day for a total of 107 soundings;
iii. the Meso-Eta meteorological model of the Centro de Previs˜ao de Tempo e Estudos Clim`aticos (CPTEC), cen-tred over Bauru and covering the whole State of S˜ao Paulo with a 10×10 km resolution grid run twice a day (00:00 and 12:00 UT) providing 3-hourly forecasts; iv. daily 3-D back trajectories calculated by the CPTEC
Regional Atmospheric Modelling System (RAMS) model used for optimising the flights;
Table 1.Instruments flight tests in 2001.
Instrument (Institute) Parameter ZL1 ZL2
SAOZ Vis, SA SAOZ UV, SA SAOZ H2O, SA
SAW Hygrometer, UCAM SSS Ozone sensor, UCAM Micro-lidar, ENEA / ISAC
O3, NO2profiles BrO profile H2O profile H2O O3
Backscatter ratio/ polarization
X X X X
X X X X
Daily O3 and NO2 columns measurements from a SAOZ ground-based spectrometer deployed in Bauru since 1995 in the frame of the Network for Detection of Atmospheric Com-position Change (NDACC) were also available.
3.4 Modelling tools
The interpretation of the large amount of observations col-lected during the experimental period required the use of modelling tools of different types. Meteorological infor-mation included the European Center for Medium range Weather Forecasting (ECMWF) operational analyses (Ra-bier et al., 2000), the ECMWF ERA40 reanalysis (Sim-mons and Gibson, 2000), and the NCEP/NCAR re-analyses (Kistler et al., 2000); while atmospheric models included the Mod´elisation Isentrope du transport M´eso-´echelle de l’Ozone Stratosph´erique par Advection (MIMOSA) high-resolution contour advection model (Hauchecorne et al., 2002), the p-TOMCAT CTM (O’Connor et al., 2005), the Reactive Processes Ruling the Ozone Budget in the Stratosphere (REPROBUS) CTM (Lef`evre et al., 1994), a mesoscale Regional Atmospheric Modelling System (RAMS) (Pielke et al., 1992) and its Brazilian version (BRAMS) coupled with 3-D back trajectory calculations at mesoscale (Freitas et al., 2000), the Microphysical Photo-chemical Lagrangian Stratospheric Model of Ozone (Mi-PLaSMO) Lagrangian photochemical model (Rivi`ere et al., 2003), the Microphysical Cloud Model of the Danish Mete-orological Institute, the UK Met Office Large Eddy Model (LEM) Cloud Resolving Model (Shutts and Gray, 1994; Swann 1998), and finally, the radiative transfer model of NILU. Their use in the interpretation of the HIBISCUS is given below.
4 HIBISCUS field campaigns
Three deployments took place within the HIBISCUS pro-gramme, all from Bauru. The first in November 2000 and February 2001 involved test flights of (a) Infra-Red Mont-golfier long-duration balloons never previously flown in the tropics (to which a SAOZ and or micro-lidar payload could
be added), and (b) of short-duration balloons to test the op-erational and the nighttime slow descent procedures. The second deployment in February 2003 was dedicated to the testing of new instruments and the validation of ENVISAT observations in the tropical stratosphere and also involved short and long-duration MIR balloon flights. The final and main HIBISCUS campaign was in January–March 2004 and involved all types of balloons including constant level super-pressure (SPB).
4.1 MIR and ZL balloons test flights on November 2000 and February 2001
Two Infra-Red Montgolfier (MIR) test flights were per-formed by CNES from Bauru in November 2000, and an-other three in February 2001. They were organised to test the technological performance of the balloons in the tropics, and additionally provided an opportunity for piggybacking scien-tific instruments. The first two, purely technical in Novem-ber 2000 lasted for 18 and 19 days before falling over deep convective cells in Northern Australia showing that the pay-loads were slightly too heavy for this latitude. The other three carried respectively an IR global radiometer, a SAOZ spec-trometer and a LABS diode laser. The LABS flight lasted 49 days (though unfortunately the instrument did not perform properly), while that of the IR radiometer lasted 71 days pro-viding a series of cirrus altitude and brightness temperature. The SAOZ flight lasted for 39 days providing a unique set of 59 ozone, NO2and cloud profiles (Pommereau et al., 2003; Garnier et al., 2004; Borchi et al., 2005). In addition, two 10 000 m3 Zodiac light (ZL) flights were made in order to test several instruments (Table 1), in the meteorological con-ditions summarized in Table 2. This exploratory campaign offered a first opportunity for studying the impact of deep convection on the composition of the upper troposphere by 3-D mesoscale simulations in an extreme storm case on 8 February 2001 (Mar´ecal et al., 2006; Rivi`ere et al., 2006).
4.2 Pre-HIBISCUS/ENVISAT flights in February 2003
Table 2.Meteorology of the 2001 flights.
Flight Date MinT ◦C Alt km LRT km PV 380K PV 475 K PV 550 K Comments
ZL1 15 Feb −78.6 16.9 15.4 −4.9 −16.7 −25.1 SACZ MCS 150 km SW ZL2 21 Feb −78.3 17.6 15.2 −4.5 −16.4 −25.3 SACZ MCS 200 S-SW
Table 3.List of ENVISAT Pre-HIBISCUS flights in 2003.
Instrument (Institute) Parameter ZL1 SF ZL2
SAOZ Vis, SA SAOZ UV, SA SAOZ H2O, SA DESCARTES, UCAM DIRAC GC, UCAM DIRAC, GC UCAM SAW Hygrometer, UCAM SSS Ozone sensor, UCAM Micro-lidar, ENEA/ISAC
O3, NO2profiles BrO profile H2O profile Halogen compounds N2O
Halogen compounds H2O
O3
Backscatter ratio/ polarization
X X X X X
X X X X X
X X X X X X
Overall, the short-duration flights and the sondes provided a large amount of scientific data, as well as technical informa-tion for improving the instruments. Two of the 4 MIR flights were successful, even though of only 9 and 10 days duration as the balloons fell above hurricanes over the Coral Sea and NW Australia.
4.3 Main HIBISCUS campaign in January–March 2004
The campaign started on 20 January and ended on 6 March 2004. In total, 18 balloons (6 short- and 12 long-duration) were flown along with 15 small plastic balloon sondes (10 BKS/O3, 3 ozonesondes and 2 NILUCUBE). The balloon payloads and their performances are summarized in Tables 5 to 9.
4.3.1 Short-duration balloons and sondes for mesoscale studies
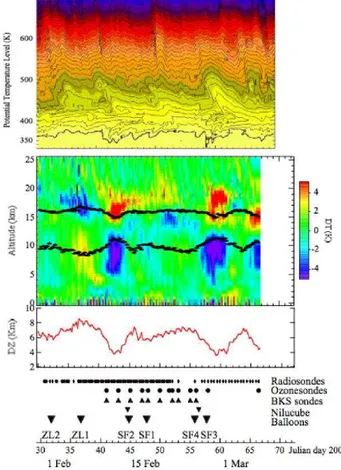
The objective was the study of vertical transport, water vapour, chemistry, cirrus clouds and electric field associated with convective cells by dedicated balloon flights in coordi-nation with Falcon aircraft flights and the ground-based mea-surements of the TROCCIBRAS project. Figure 6 shows the evolution of the meteorology during the campaign and the dates of the balloon and sonde ascents, whose payloads and meteorological conditions encountered are displayed in Ta-bles 5, 6 and 7. On top of the figure is the potential vorticity calculated by the MIMOSA contour advection model. The middle plot shows the 6-hourly ECMWF temperature profile anomaly with respect to the campaign mean. Even though the summer season is on average very convective in
Table 4.Meteorology of ENVISAT-Pre-HIBISCUS flights in 2003.
Flight Date MinT ◦C Alt km LRT km PV 380K PV 475K PV 550K Comments
ZL1 18 Feb −80.1 17.9 15.4 −1.34 −20.6 −27.7 MCS below
SF 19 Feb −79.3 17 15.6 −1.05 −18.3 −28.2 Large MCS 300–450 km SW ZL2 23 Feb −82.0 18.1 1.2 −3.38 −18.2 −28.6 Large MCS below
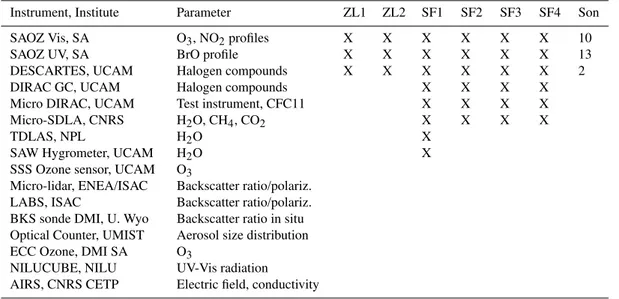
Table 5.HIBISCUS short duration balloon and sondes (Son) flights in 2004.
Instrument, Institute Parameter ZL1 ZL2 SF1 SF2 SF3 SF4 Son
SAOZ Vis, SA SAOZ UV, SA DESCARTES, UCAM DIRAC GC, UCAM Micro DIRAC, UCAM Micro-SDLA, CNRS TDLAS, NPL
SAW Hygrometer, UCAM SSS Ozone sensor, UCAM Micro-lidar, ENEA/ISAC LABS, ISAC
BKS sonde DMI, U. Wyo Optical Counter, UMIST ECC Ozone, DMI SA NILUCUBE, NILU AIRS, CNRS CETP
O3, NO2profiles BrO profile Halogen compounds Halogen compounds Test instrument, CFC11 H2O, CH4, CO2 H2O
H2O O3
Backscatter ratio/polariz. Backscatter ratio/polariz. Backscatter ratio in situ Aerosol size distribution O3
UV-Vis radiation
Electric field, conductivity X X X
X X X
X X X X X X X X
X X X X X X
X X X X X X
X X X X X X
10 13 2
east Brazil, large modulations of intensity are observed asso-ciated with the motion of the South Atlantic Convective Zone (SACZ) and large scale Kelvin or Rossby waves (Pommereau and Held, 2007). Black markers indicate the altitude of the 340 K and 370 K potential temperature levels whose differ-ence, shown in the bottom panel, is an indicator of convective intensity. Convective periods exhibit a warmer troposphere and a cooler TTL, while low or non-convective periods are marked by a cooler troposphere and a warmer TTL. As seen in the PV cross-section, whose values for each flight at 380, 475 and 550 K are summarized in Table 6, most of the flights were performed within tropical air pulses (low PV), with the exception of the first on 31 January, which was the closest to the sub-tropical jet stream, but still in the TTL. A summary of convective activity encountered during each flight, pro-vided by the radar and GOES-E images, is given in Table 6. More details can be found in Appendix B. Meteorological radiosondes were launched four times per day between 5–21 February, as indicated by markers at the bottom of the figure.
4.3.2 Long-duration balloon flights
The flight programme included 8 constant-level superpres-sure balloons (SBP), and 3 MIRs. The SBP were of two
types: 10 m diameter floating at 55 hPa (∼19 km) and 8.50 m diameter at 75 hPa (∼18 km) i.e. above and at about the cold point tropopause level. The list of flights, their instrumenta-tion, the dates of launch and their duration are given in Table 8, and the trajectories of the balloons displayed in Fig. 7. Apart from a transmitter failure on BP2 and a small leak on BP1, which depressurised and fell after 13 days, all others remained at float for 1–2 months. All GPS and meteorologi-cal sensors performed well, providing useful scientific prod-ucts (3-D trajectories, temperature and pressure fluctuations) for studying gravity and Rossby waves. However, the wa-ter vapour instrument did not work properly, likely because of limited H2O deposition due to inadequate ventilation, and the ozone sensors stopped transmitting their information to the main gondola after 14 and 3 days, respectively.
Table 6.Meteorology of HIBISCUS balloon flights in 2004.
Flight Date MinT ◦C Alt km LRT km PV 380K PV 475K PV 550K Comments
ZL2 31 Jan −77.1 17.4 15.2 −4.56 −21.3 −29.8 SACZ, Convective cells 10– 11 km high at 60–100 km SE. ZL1 5 Feb −81.1 16.9 16.2 −2.54 −14.6 −26.6 SACZ, intense MCS 150 km
S-SW,
SF2 13 Feb −78 18 15.2 −4.33 −16.5 −24.2 Intense 300 km large MCS 150 km W-NW
SF2 16 Feb −78 15.5 15.7 −5.05 −14.3 −25.2 South of SACZ, convection free,
SF4 24 Feb −78.7 18.0 14.8 −3.14 −17.8 −24.2 SACZ intense afternoon convection
SF3 26 Feb −79 17.8 15.2 −4.00 −18.6 −23.8 Active thunderstorms 150 km South
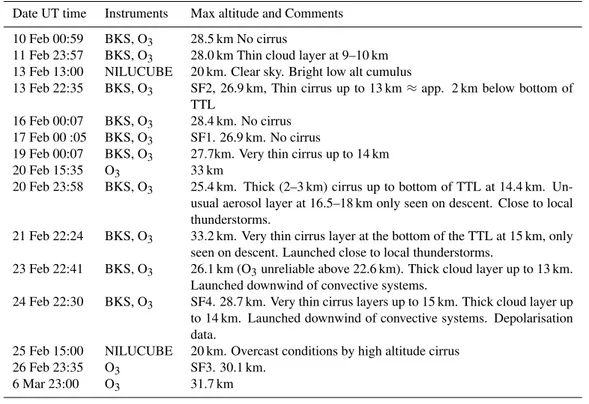
Table 7.Dates and type of HIBISCUS sondes (BKS: backscatter; O3: ECC ozonesonde, and NILUCUBE).
Date UT time Instruments Max altitude and Comments
10 Feb 00:59 BKS, O3 28.5 km No cirrus
11 Feb 23:57 BKS, O3 28.0 km Thin cloud layer at 9–10 km 13 Feb 13:00 NILUCUBE 20 km. Clear sky. Bright low alt cumulus
13 Feb 22:35 BKS, O3 SF2, 26.9 km, Thin cirrus up to 13 km≈app. 2 km below bottom of TTL
16 Feb 00:07 BKS, O3 28.4 km. No cirrus 17 Feb 00 :05 BKS, O3 SF1. 26.9 km. No cirrus
19 Feb 00:07 BKS, O3 27.7km. Very thin cirrus up to 14 km 20 Feb 15:35 O3 33 km
20 Feb 23:58 BKS, O3 25.4 km. Thick (2–3 km) cirrus up to bottom of TTL at 14.4 km. Un-usual aerosol layer at 16.5–18 km only seen on descent. Close to local thunderstorms.
21 Feb 22:24 BKS, O3 33.2 km. Very thin cirrus layer at the bottom of the TTL at 15 km, only seen on descent. Launched close to local thunderstorms.
23 Feb 22:41 BKS, O3 26.1 km (O3unreliable above 22.6 km). Thick cloud layer up to 13 km. Launched downwind of convective systems.
24 Feb 22:30 BKS, O3 SF4. 28.7 km. Very thin cirrus layers up to 15 km. Thick cloud layer up to 14 km. Launched downwind of convective systems. Depolarisation data.
25 Feb 15:00 NILUCUBE 20 km. Overcast conditions by high altitude cirrus 26 Feb 23:35 O3 SF3. 30.1 km.
6 Mar 23:00 O3 31.7 km
caused a reduction of volume when the balloon is cooling and descending after sunset. MIR-1 provided limited data after the partial failure of the SAOZ detector at low temperature. The other two were successful. The micro-lidar flown on MIR-2 measured a number of cloud profiles, although some of the measurements were noisy as a result of electrical in-terference in the Inmarsat transmitter. The SAOZ on board MIR-3 provided the longest ever series of profiles (78) of O3, NO2and cloud extinction in the tropical UTLS, as well as for the first time H2O. For comparison purpose, dedicated
Table 8.HIBISCUS Super pressure balloon (SPB) flights in 2004: balloon diameter, instrumentation, date of launch and duration.
Balloon Instrument Start Dur. Comments
BP1 10 m BP2 8.5 m BP3 10 m BP4 8.5 m BP5 10 m BP6 8.5 m BP7 10 m BP8 10 m
Met, turbulence LMD Met, O3/H2O UCAM Met, turbulence LMD Met sensors
Met, O3/H2O UCAM Met, turbulence LMD Met, O3/H2O UCAM Met sensors
6 Feb 12 Feb 12 Feb 29 Feb 6 Mar 7 Mar 9 Mar 11 Mar
13 d 1 d 53 d 80 d 39 d 56 d 27 d 37 d
Telemetry failed after few hours No SSS/SAW data after 14 d No SSS/SAW data after 3 d No turbulence data after 7 d
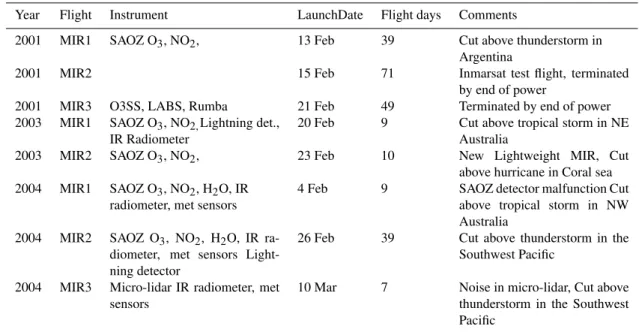
Table 9.IR Montgolfier flights instrumentation, date of launch, duration, cause of termination.
Year Flight Instrument LaunchDate Flight days Comments
2001 MIR1 SAOZ O3, NO2, 13 Feb 39 Cut above thunderstorm in Argentina
2001 MIR2 15 Feb 71 Inmarsat test flight, terminated by end of power
2001 MIR3 O3SS, LABS, Rumba 21 Feb 49 Terminated by end of power 2003 MIR1 SAOZ O3, NO2,Lightning det.,
IR Radiometer
20 Feb 9 Cut above tropical storm in NE Australia
2003 MIR2 SAOZ O3, NO2, 23 Feb 10 New Lightweight MIR, Cut above hurricane in Coral sea 2004 MIR1 SAOZ O3, NO2, H2O, IR
radiometer, met sensors
4 Feb 9 SAOZ detector malfunction Cut above tropical storm in NW Australia
2004 MIR2 SAOZ O3, NO2, H2O, IR ra-diometer, met sensors Light-ning detector
26 Feb 39 Cut above thunderstorm in the Southwest Pacific
2004 MIR3 Micro-lidar IR radiometer, met sensors
10 Mar 7 Noise in micro-lidar, Cut above thunderstorm in the Southwest Pacific
5 Results highlights
The rich observational data set collected during the HIBIS-CUS campaigns has been used for a variety of investigations: (i) the impact of convection on the thermal structure, the composition and the water vapour concentration in the TTL and the lower stratosphere; (ii) the identification of possible biases in NWP model temperatures in the lower stratosphere and trends in their re-analyses, by comparison with measure-ments of French long duration balloons flights performed in the tropics since 1988; and (iii) the evaluation of ozone, water vapour, and chemical species satellite retrievals in the trop-ics. The most important findings are highlighted below.
5.1 Local impact of convection on the thermal structure and the composition of the TTL
Fig. 7. Trajectories of the 8 super pressure balloons. Those launched before 12 February remained at tropical latitudes, while those flown later after a break of 17 days, were rapidly captured by the mid-latitude westerly flow after crossing the tropical barrier. The loops in the trajectories, particularly in the tropics, are due to in-ertia gravity waves not adequately captured in the ECMWF model.
provides evidence of strong impact of land convective sys-tems on the thermal structure of the lower stratosphere, as suggested by Danielsen (1982). Although gravity waves and vertical diffusivity might also partly contribute, the sug-gestion is that uplifting in the lower stratosphere associated with fast developing land convection in the afternoon, is a significant contributor to troposphere-stratosphere exchange (Pommereau and Held, 2007). The suggestion is supported by non-hydrostatic regional model simulations displaying a cooling of up to 15 K at the altitude of the cold point above convective towers (Chaboureau et al., 2007; Grosvenor et al., 2007; Jensen et al., 2007), although the diurnal cycle of convection is still poorly simulated. This contrasts with oceanic areas, where less intense cooling is observed, which is limited to the altitude of the lapse rate tropopause at around 16 km (Sherwood et al., 2003).
The local vertical transport has also been explored by cal-culating the equivalent diffusivity, required for explaining the high-resolution ozone, water vapour and methane pro-files recorded by the balloons (Pisso and Legras, 2008). It was shown that the vertical transport in those case stud-ies would require a vertical diffusivity of 0.5 m2s−1, sig-nificantly larger than the 0.1 m2s−1value estimated by the authors using the same technique at mid-latitude (Legras et al., 2005) or the average 0.02 m2s−1 derived by Mote et al. (1998) from 5 yr methane profiles measurements by the Halogen Occultation Experiment (HALOE). However, the respective contribution of small-scale turbulence, gravity waves or convective overshooting to this extreme equivalent diffusivity, is still an open question.
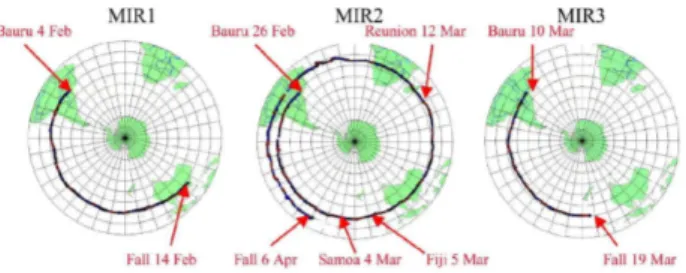
Fig. 8. MIR trajectories in 2004. MIR1 carrying a SAOZ lasted in flight for 9 days before falling in the evening above a tropical storm in NW Australia where it was recovered. MIR2 remained in flight for 39 days between 20◦and 10◦S, providing 78 profiles of O3, NO2, H2O and cloud extinction between 6 km or cloud top and 25 km. Co-located ozonesonde ascents were made at the SHADOZ stations of Samoa, Fiji and Reunion Island. The flight ended over a thunderstorm in the South Pacific Convergence Zone. Although only of 8-day duration, MIR3 enabled cloud measurements by a micro-lidar, flown for the first time on a long-duration balloon, to-gether with the IR global radiometer.
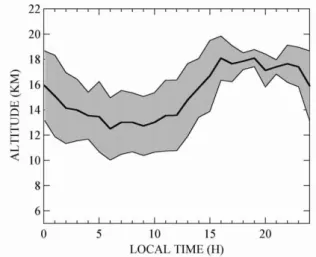
Fig. 9.Impact of convection on the thermal structure of the UTLS. Left: change of temperature between 16:00, 22:00 and 04:00 h local time and 10 h during the most intense convective period (error bars are showing the standard deviation). Right: diurnal variation of mean (solid) and maximum (dotted) echo-top height seen during the same period by the S-band Doppler radar within its 240 km range (Pommereau and Held, 2007).
mixing ratios above-background levels could be observed in long-lived tracers just below the TTL layer, which could in-dicate uplift of boundary layer air (e.g., CFC-113 on SF1 and SF3). The long-lived tracers again showed no verti-cal gradient across the TTL between 350 and 400 K. Only above 400 K was there a noticeable drop-off in the long-lived tracer-mixing ratio, indicating stratospheric aged air. The long-lived tracers are also anti-correlated with the co-located ozone measurements in this region
In the case of the shorter-lived halocarbon tracers be-low and inside the TTL region, much more variability was found in the vertical profiles. While the long-lived tracers show little gradient or variability in the 350 to 400 K re-gion, the shorter-lived tracers show considerable variation. In the case of chloroform (∼6 months lifetime), there is a decrease in mixing ratio of around 3 ppt between 350 and 400 K (amounting to some 50% of the tropospheric value). In the case of dibromomethane (3 to 4 month lifetime), the tracer distribution is more difficult to describe, since there is a slight drop-off between 350 and 400 K, but there is ev-idence of a maximum in the 360 to 380 K region, consis-tent with reasonably recent uplift from the boundary layer. Unfortunately, dibromomethane was only measured by the DESCARTES grab samplers and so the vertical resolution is low. A first attempt to explain the tracer vertical structure us-ing the simple 1-D model introduced by Folkins et al. (1999) was unsuccessful. It was not possible to reproduce all the profiles with a single vertical velocity. It is clear that this model (while having been extremely influential) must now be considered too simple. The overall structure of the TTL is complex and three-dimensional.
In another modelling study, the impact on the composition of UTLS of a strong convective storm that occurred during the first HIBISCUS campaign on 8 February 2001 was simu-lated with the 3-D mesoscale RAMS model coupled on-line with a chemistry model. Analysed were the impact on CO, NOx, non-methane volatile organic and HOx(Mar´ecal et al., 2006) and ozone (Rivi`ere et al., 2006) were analysed, and it was been shown that the distribution of CO with altitude is closely related to the upward convective motions and con-secutive outflow at the top of the convective cells leading to a bulge of CO between 7 km altitude and the tropopause, con-sistent with satellite-borne measurements at 700 hPa. The simulation also indicates enhanced amounts of NOx up to 2 ppbv in the 7–17 km altitude layer mainly produced by the lightning associated with the intense convective activity. For insoluble non-methane volatile organic compounds, the con-vective activity tends to significantly increase their amount in the 7–17 km layer by dynamical effects. During daytime in the presence of lightning NOx, this bulge is largely re-duced in the upper part of the layer for reactive species (e.g. isoprene, ethene) because of their reactions with OH that is increased on average during daytime. Lightning NOx also impacts on the oxidizing capacity of the upper troposphere by reducing on average HOx, HO2, H2O2and organic
hy-droperoxides. However, the impact of convection on the air composition of the lower stratosphere was found to be negli-gible in the BRAMS simulations in the absence of fast trans-port process across the tropopause like in the previous 1-D model.
In this model, the ozone concentration in the TTL dur-ing this event was found compatible with ozonesonde ob-servations, showing that fast ozone variations over the con-vective system are mainly driven by horizontal transport (Rivi`ere et al., 2006). When averaged over the 24 h pe-riod, the simulations suggest that convective activity is the main driver explaining 70% of the total ozone increase in the TTL, while chemical production contributes to 29% of the ozone increase when the NOxproduction by lightning is taken into account. Also shown is that downward motion at the tropopause induced by gravity waves associated to deep convection, contributes for 24% to the ozone increase.
In summary, temperature, tracers and ozone observed profiles next to convectively active systems are all show-ing large changes in the TTL and the lower stratosphere. Consistent with fast transport of tropospheric air across the tropopause by convective overshooting towers suggested by Danielsen (1982), those variations are well captured by a 3-D meso-scale model in the upper troposphere but not above in the lower stratosphere in the absence of fast vertical transport process in the model.
5.2 Hydration of the lower stratosphere over land convective systems
Fig. 10. Water vapour mixing ratio measurements around Bauru on 13 February 2004: in situ µSDLA (green) and SAW (purple) during the balloon slow descent, GOMOS (black), MIPAS (blue, 2 profiles) and AIRS (pink) closest measurements and saturation ratio (yellow) (Montoux et al., 2009).
responsible for the supersaturated layers and the cirrus clouds reported on the same flights by the micro-lidar, was explored by Mar´ecal et al. (2007) using backward 3-D trajectories cal-culated from outputs of the BRAMS. The analysis showed that in sub-saturated layers the water vapour profile depends mainly on the dynamics, while in saturated/supersaturated layers, microphysical processes have also to be taken into account. SCIAMACHY, MIPAS and GOMOS are reporting mixing ratios significantly dryer than those of the in situ sen-sors. AIRS is the only satellite instrument reporting consis-tent measurements with of those of the balloons in the upper troposphere.
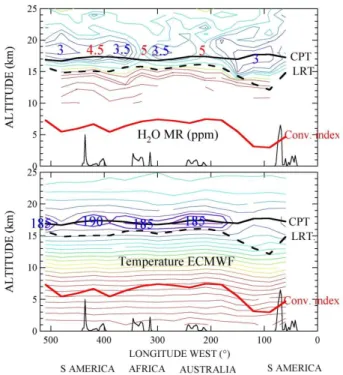
An extended near IR version of SAOZ was flown for 39 days on a MIR balloon in February–April 2004 during which it completed one and a half circumnavigations of the globe. The water vapour profiles derived from the 78 pro-files (Fig. 11) show s a minimum mixing ratio (hygropause) at around 18 km, 1.5–2 km above the cold point tropopause, and a zonal modulation with higher mixing ratio of the or-der of 5 ppm above continents compared to about 3 ppm over subsident oceanic areas. The zonal contrast suggests either additional moistening over land or further dehydration over oceans, though the temperature is not colder there, or advec-tion of drier air from the mid-latitude stratosphere.
Several cloud-measuring instruments were also flown dur-ing HIBISCUS: the micro-lidar (Fig. 12) and the backscatter sondes on short-duration balloons, as well as the SAOZ so-lar occultation spectrometer and the micro-lidar on the MIR
Fig. 11. Water vapour mixing ratio in the UTLS (top) measured by the SAOZ spectrometer and ECMWF temperature (bottom) be-tween 10◦–20◦S along the 39 days MIR flight in February–April 2004. A minimum water vapour (hygropause) is observed 3–4 km above the Lapse Rate Tropopause (LRT, dashed black line), 1.5– 2 km above the cold point (CPT, solid black line), with maxima of 5 ppm over the continents where the temperature is the lowest and minima of 3–3.5 ppm over oceanic subsident areas. The red line shows the difference of altitude between the 370 and 340 K levels indicative of convection intensity (Pommereau et al., 2006).
Fig. 12.Micro-lidar cirrus clouds measurements during a nighttime balloon slow descent on 24 February 2004. Top: scattering ratio, bottom: depolarization (Di Donfrancesco et al., 2005).
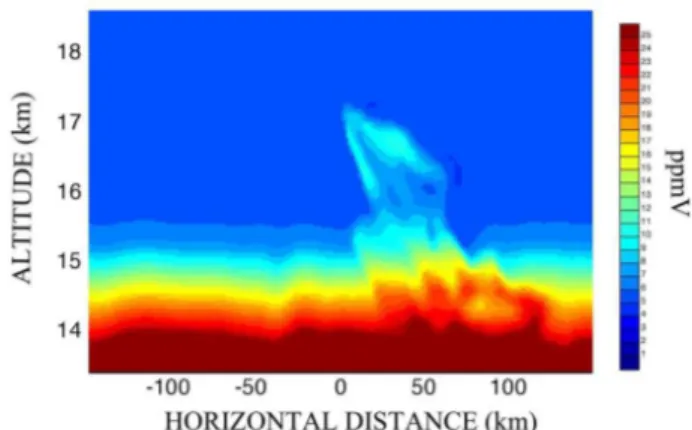
The HIBISCUS episode has been simulated with the UK Met Office Cloud Resolving Model (Grosvenor et al., 2007). This model has a bulk microphysics scheme (size spectra are assumed to follow gamma distributions), which is dou-ble moment for the ice hydrometeors. The model was ini-tialised using a sounding from Bauru and convection started using a warm and moist-bubble of 3 different rates of heat-ing and moistenheat-ing to produce separate simulations of over-shoots of different strengths. It was found that in all cases the clouds mixed some of the ice-laden air carried by them with stratospheric air. The warming experienced as a result caused some of the ice to evaporate leaving moist air plumes in the stratosphere with water vapour exceeding 10 ppm in the most vigorous case (Fig. 14). The mixing and warming also meant that the air attained stratospheric potential temperatures and thus would be likely to remain in the stratosphere. The mass of extra water vapour injected into the stratosphere was cal-culated for the three different cases and came to 1116, 194 and 86 tonnes in the strong, medium and weak cases respec-tively. Thus, there was a large difference between the dif-ferent cases indicating that a small change in overshooting distance can produce a large difference in the amount of wa-ter deposited in the stratosphere. These conclusions are con-sistent with those reached by Chaboureau et al. (2007) from a cloud resolving model simulation of another event during the TROCCINOX campaign, suggesting that the flux of ad-ditional water at 410 K could be of 5 tonnes s−1, that is of the order of 3000 tonness for an event lasting 10 min.
Fig. 13. Backscatter sounding on 21 February. Red filled area: backscatter ratio at 940 nm; blue dots: colour index; thin black line: temperature; dashed line: frost point assuming 6.06 ppm WV mix-ing ratio; dotted line: same but assummix-ing 36.1 ppm. Particles are ob-served between 17.5–19 km above a cumulo-nimbus anvil of radii estimated of the order of 0.2–1.5 µm. (Nielsen et al., 2007).
Fig. 14. Vertical cross section of the vapour mixing ratio in the plume produced by the overshoot in the most vigorous of the 3-D simulations performed using the UK Met Office Cloud resolving model after 1 h 35 min of simulation time. At this time the plume air was stable in the stratosphere having attained stratospheric potential temperatures through mixing with stratospheric air (Grosvenor et al., 2007).
it. This was based on the strongest case with the number of CCN at cloud base increased from 240 to 960 cm−3. This had the effect of increasing the number of droplets that survived the riming process within the main updraught to freeze at the−38◦C homogeneous freezing level at∼11 km. Smaller ice crystals were therefore present in the overshooting cloud and this resulted in more evaporation of ice, due to their lower fall speeds, producing an extra 118 tonnes of strato-spheric vapour increase. In addition, much more of the water transported into the stratosphere remained as ice in this case (505 tonnes compared to 131 tonnes in the normal CCN case) due to the slow ice fall speeds. Hence, if the remaining ice can later evaporate before falling from the stratosphere, a sig-nificant increase in the total moistening of 45% is predicted due to the CCN increase. This suggests that anthropogenic aerosol emissions may play a role in determining the amount of moistening produced by overshoots and possibly therefore the global water flux into the stratosphere if the overall effect of overshoots is globally important.
In summary, the HIBISCUS and TROCCINOX water vapour and particles measurements were all suggesting moistening of the lower stratosphere by injection of ice crys-tals by overshooting towers over a convective land region, as observed over Northern Australia (Kelly et al., 1993; Knol-lenberg et al., 1993; Corti et al., 2008), and Africa (Khaykin et al., 2009), confirmed by the heavier isotopic composi-tion of the water vapour in the stratosphere, characteristic of ice lofted from the troposphere, as observed by Hanisco et al. (2007) in situ on the NASA WB-57 aircraft, or remotely by the MIPAS HDO measurements in the stratosphere (Stein-wagner et al., 2010). The process, successfully simulated by Grosvenor et al. (2007) and Chaboureau et al. (2007), is now consistently reproduced by meso-scale non-hydrostatic mod-els (Jensen et al., 2007; Chemel et al., 2009; Hassim et al., 2010).
5.3 Impact of convective lofting and meridional exchange at the global scale
There is evidence from the previous sections of deep, local convective overshooting of tropospheric air over Southern Brazil into the lower stratosphere. The open question is how much the mechanism could contribute to troposphere-to-stratosphere transport (TST) at the global scale (Flueglistaler et al., 2009). The HIBISCUS long duration balloon and satel-lites observations provided new unique insights into this sub-ject.
The relative contributions of quasi-horizontal and vertical transport to the variation of ozone concentration in the sub-tropical UTLS around 10◦–20◦S were explored by Borchi et al. (2005, 2007) from the variability of ozone profiles pro-vided by the circum-navigating MIR balloons flown in 2001, 2003 and 2004. The analysis makes use of potential vor-ticity (PV) as proxy of horizontal transport, and the differ-ence in altitude between the 340 and 370 K isentropic
sur-Fig. 15.Analysis of the contributions of meridional and horizontal transport to the ozone zonal variability (relative standard deviation) in 2001 (top), 2003 (middle) and 2004 (bottom). Left: number den-sity variability (%) at constant altitude (solid linea), mixing ratio on isentropic surfaces (dotted lineb); after removing horizontal trans-port (dotted-dashedc); after removing vertical and horizontal trans-port (bold solid lined). Right: relative contributions of horizontal (solid line) and vertical (dotted) transport and measurement errors (dotted-dashed) to the total variability (Borchi et al., 2007).
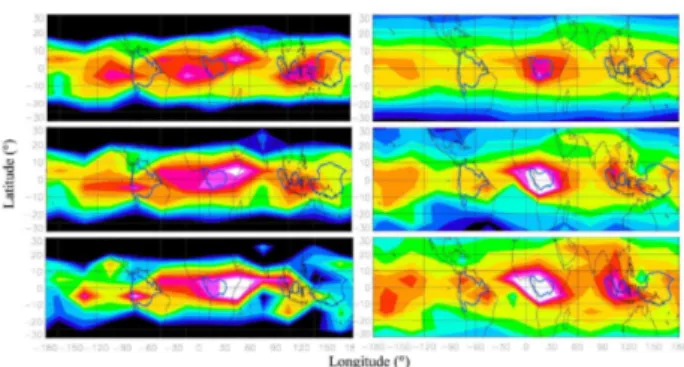
Fig. 16. 2002–2004 average CH4HALOE (left) and N2O ODIN-SMR (right) zonal variation of concentration in the TTL in Mar-Apr-May. Top: 19 km, bottom: 17 km, middle: interpolated at 400 K (Ricaud et al., 2007).
by Ricaud et al. (2007) from satellite measurements of tro-pospheric species above the tropopause. Figure 16 shows the mean CH4 and N2O concentrations at 17 and 19 km retrieved respectively by HALOE and ODIN-SMR (sub-millimetre microwave radiometer) in Mar-Apr-May 2002– 2004. Systematic regional differences are seen with a promi-nent maximum over equatorial Africa and to a lesser degree over Central America, Southeast Asia and Indonesian island, in contrast to the West Pacific. The location of increased concentration of tropospheric species over continents coin-cides with that of the maximum of overshooting precipita-tion features (OPF) of the TRMM precipitaprecipita-tion radar (Liu and Zipser, 2005; Zipser et al., 2006). Although meridional import of poorer CH4 and N2O stratospheric air from the mid-latitudes might also contribute, these observations sug-gest that convective overshooting over land might be a sig-nificant mechanism of vertical transport at the global scale in the TTL. In a further study of N2O in the UTLS, Ricaud et al. (2009) showed the existence of a systematic seasonal vari-ation of maximum amplitude between 400–450 K (∼17.5– 19 km), not reproduced either by the MOCAGE (Mod`ele de Chimie Atmosph´erique `a Grande Echelle) CTM of M´et´eo-France forced by ECMWF vertical velocity suggesting thus a vertical transport mechanism not included or underestimated in the models.
Modelling studies were also performed by Levine et al. (2007, 2008) to investigate the global structure of the TTL using both high-resolution trajectories and a lower-resolution CTM. In each case the regions of preferential transport from the lower troposphere into the TTL and from the TTL into the stratosphere were examined. The trajectories as well as the p-TOMCAT CTM model show much smaller regional differ-ences in the transport from the TTL to the stratosphere than in the transport into the TTL from the lower levels, suggest-ing that the transport into the TTL would occur primarily over the maritime continent, followed by extensive horizon-tal transport within the TTL. Those conclusions are in
con-tradiction with the above tropospheric tracers observations and with the heavier isotopic composition of water vapour in the lower stratosphere indicative of evaporation of con-vectively lofted ice crystals (Steinwagner et al., 2010). They contrast also the time-variation of stratospheric aerosols re-trieved from the CALIPSO lidar (Vernier et al., 2009, 2011), showing a fast cleansing of the whole lower stratosphere up to 20 km during the Southern Hemisphere summer, indica-tive of clean tropospheric air fast lofting. As in the case of the simulation of tropospheric tracers, there is clear indica-tion that, in contrast to non-hydrostatic mesoscale models, CTM or trajectory models forced by ECMWF fail to rep-resent properly the fast troposphere-to-stratosphere transport associated with convection.
Another process that could be relevant to vertical transport in the UTLS is the generation of gravity waves by convec-tive systems and their propagation into the stratosphere. This was studied using the meteorological parameters measured during the superpressure balloon (SBP) long-duration flights. Figure 17 shows for instance the horizontal kinetic energy spectra for two of the SPB flights (BP4 and BP6, Table 8). The energy is represented with respect to the intrinsic fre-quency, i.e., the frequency that is measured in the mean flow. The theory of gravity waves predicts that these motions have intrinsic frequencies larger than the inertial frequency, which depends on latitude. BP4 (black curve) stayed at low lati-tudes and a broad spectrum of inertia-gravity waves with in-trinsic periods as long as 40 h are observed on this flight. On the other hand BP6 was pushed to the middle latitudes, and consequently, the mean inertial frequency during this flight is about half that of BP6 (20 h). These features, fully con-sistent with the theory, demonstrate the ability of SPB flights to resolve gravity-wave motions. Furthermore, in the high-frequency gravity-wave band, the picture clearly exhibits a slope of−2, which seems to be a robust feature of gravity-wave energy in the stratosphere (Hertzog et al., 2002). On the other hand, the low-frequency part of the spectra is likely associated with Rossby waves, which are more visible on the mid-latitude flight. However, further studies are still needed to investigate the variation of wave activity, identify the wave sources, and quantify the energy and momentum transported by the waves to the upper atmosphere. However, there is little evidence in those data of a significant contribution of gravity waves to the vertical transport across the tropopause.
5.4 Evaluation of meteorological models temperature and wind analyses and re-analyses
Fig. 17. Horizontal kinetic energy spectra obtained with SPB4 (black) and SPB6 (red) wind observations. The error bars on the left of the spectra show the 90% confidence level. The vertical dashed lines indicate the flight-averaged inertial frequencies. A−2 slope (thick black line) is shown for reference.
in ECMWF/ERA40 or NCEP/NCAR re-analyses showing show drops of various amplitude in the temperature data se-ries (Randel et al., 2004). The first aim has been achieved by using the data of the HIBISCUS SPB and MIR long duration flights, whilst the second required an unprecedented search for past balloon flight data in the archives of the French lab-oratories.
Actual temperature, wind and trajectories of the 8 SPB and the 3 MIR balloons in 2004 have been compared by Knudsen et al. (2006) to ECMWF T511 and NCEP operational prod-ucts. The ECMWF operational analysis were shown to dis-play a systematic cold bias of 0.9 K and too strong easterly zonal winds by 0.7 m s−1, when compared to balloon mea-surements above the tropical tropopause between 50–80 hPa. The temperature bias revealed by the balloons is fully con-sistent with the−1 K to−2 K bias reported by Borsche et al. (2007) in the tropical tropopause region from tempera-ture measurements by radio occultation of the CHAllenging Minisatellite Payload (CHAMP) satellite during the same pe-riod. The consistency between the two totally independent data sets confirms the cold bias in the ECMWF operational analysis in 2004.
Similarly, possible biases in the trends have been exam-ined by comparison of the data of past CNES, LMD and Service d’A´eronomie long-duration balloon flights with the ERA40 re-analyses (Christensen et al., 2007). Found in the archives were the data of 30 MIRs and 3 SPBs of 10 m di-ameter flown from Pretoria in South Africa in 1988–1992, Latacunga in Ecuador in 1994–1998, and Bauru in Brazil in 2000–2001. After careful check of the data quality by com-paring measurements performed by independent instruments flown on the same balloon, about 40 000 additional
tem-perature and 12 000 wind measurements of 18 MIRs and 3 SPB flights between 1988–2001 were successfully retrieved. Compared to the balloon data (Fig. 18), the ERA-40 (T159 3-D variational assimilation) temperatures in the tropical stratosphere show systematic time varying biases, decreas-ing from +1.16 K in 1988–1989 to +0.26 K in 1994–1996 and−0.46 K after 1998, the latter being fully consistent with the−0.9 K difference between ECMWF operational analy-ses and the HIBISCUS flights and radio-occultation determi-nations in 2004. The time varying biases compared to the measurements of the long duration balloons are consistent with those derived by Randel et al. (2004) from radiosondes in 1991–2003. They confirm the erroneous faster cooling of ERA-40 compared to the sondes, likely caused by errors in the series of Stratospheric Sounding Unit (SSU), Microwave Sounding Units (MSU) and Advanced Microwave Sounding Units (AMSU) satellite temperature retrievals assimilated in the model.
Following a similar approach Hertzog et al. (2006) have compared the ERA40 reanalysis at 200 hPa in the Southern Hemisphere with the data of the 480 small super-pressure balloons of 3.70 m diameter at 200 hPa launched by the CNES for the EOLE experiment in 1971–1972. The data, surprisingly absent in the French institutes archives, were re-covered at NCAR. As many as 80 000 reliable temperature and wind data in one year, have been recovered, providing information on atmospheric regions scarcely sampled during the pre-satellite era, i.e. the Antarctic and Southern Hemi-sphere oceans. When compared to the EOLE dataset, the ECMWF ERA-40 re-analyses show limited temperature bias at 200 hPa in sub-polar regions, whilst the NCAR NN50 is a few degrees colder. However, both reanalysis are found warmer by about 1 K in the subtropics. The biases on the wind field are very small, or not significant. The standard deviation of the difference between models and balloons data was shown to improve over continents compared to oceanic areas, illustrating the heterogeneity of atmospheric observa-tions during the pre-satellite era, emphasizing the difficulty for atmospheric models to capture synoptic systems in the poorly sampled Southern Hemisphere by that time. How-ever, the two reanalyses perform differently in this respect. The NCEP/NCAR standard deviations were shown to be sig-nificantly smaller than those of ERA40.
5.5 Satellite validation
Fig. 18. Past long-duration balloon temperature measurements in the tropical lower stratosphere compared to ECMWF/ERA40. Top: difference ERA40-ballon in K; middle: standard deviation; bottom: data points number. A systematic bias is observed, ERA40 being warmer by 1.16 K in 1988–1989, by 0.26 K in 1994–1996, and then cooler by 0.46 K after 1998 (Christensen et al., 2007).
II and HALOE, the Sweden-Finland-Canada-France ODIN OSIRIS (Optical Spectrograph and InfraRed Imaging Sys-tem) and SMR, and the ESA ENVISAT MIPAS, GOMOS and SCIAMACHY (Scanning Imaging Absorption Spec-trometer for Atmospheric CHartographY). Unfortunately the launch of NASA AURA in the A-Train initially planned be-fore the campaign was delayed and no direct comparisons with MLS could be performed. Among the species, HI-BISCUS provided a unique data set of ozone, water vapour, bromine oxide, nitrous and nitrogen oxides in the tropics used and still in use for evaluating the performances of the above satellite instruments retrievals.
5.5.1 Ozone
The measurements of short duration balloons have been used for several punctual validations (e.g. for ODIN-OSIRIS by Jegou et al., 2008). More effective for assessing the perfor-mance of the satellites, is the statistical approach used by Borchi et al. (2005, 2007) using the large number of profiles of the long duration balloons. Based on the small (<2%) ozone variability in the tropical stratosphere above 20 km, an original statistical approach was developed. It consists in comparing the zonal mean profiles, indicative of biases in altitude registration and of systematic errors, and their variability (standard deviation compared to the mean), in-dicative of the random error of each instrument. Using this technique, the MIR flights data were compared with all the satellite ozone profiles available in the tropics. As an ex-ample, Fig. 19 shows the evaluation of HALOE measure-ments. Systematic altitude shifts could be observed in some satellite profiles, varying from<50 m for the GOMOS stel-lar occultation instrument, followed by +100/200 m for so-lar occultation systems (SAGE II, HALOE above 22 km), but as large as−900 m or +2000 m for limb viewing sys-tems (OSIRIS, SCIAMACHY). The ozone relative biases are generally smaller than±4%, for measurements in the
visi-Fig. 19.Example of evaluation of HALOE satellite ozone measure-ments precision by comparison with SAOZ long duration balloon profiles. Solid line: SAOZ; dotted: HALOE v19; dotted-dashed: HALOE altitude adjusted. From left to right: mean zonal pro-files, relative percent difference and relative percent standard de-viation before (black) and after (red) removal of horizontal trans-port. Above 20 km, the relative bias between HALOE and SAOZ is<4% and the HALOE precision better than 3%. At lower alti-tude, the bias increases rapidly due to an altitude registration error in HALOE (Borchi et al., 2007).
ble Chappuis bands (SAGE II and III, GOMOS above 22 km and OSIRIS), the near IR HALOE above 22 km and the ozonesondes, but increasing to +7% in UV SCIAMACHY and in the mid-IR MIPAS and the sub-millimetre ODIN-SMR limb viewing systems. Regarding precision, the best measurements are found to be those of SAGE II (2%), fol-lowed by HALOE above 22 km (3–4%), ozonesondes, SAGE III and OSIRIS (∼5%), GOMOS above 22 km and SCIA-MACHY (∼6%), MIPAS (8.5%) and finally SMR (16%). Overall, satellite ozone measurements do not appear reliable below 20 km in the tropics, except those of SAGE II (and possibly SAGE III), even though biased low by 50% and of limited precision.
5.5.2 Nitrous oxide
On 18 February 2003, the DIRAC gas chromatograph was flown from Bauru in whole air sampling mode (no adsorbent trap). This enabled a vertical profile of N2O to be measured. The N2O profile has been used as part of the Odin/SMR satellite validation for which N2O is a target gas (Urban et al., 2005). The N2O profiles were within the instrument un-certainties over all altitudes available for comparison, with the exception of the 23 to 26 km region, where the DIRAC N2O observations were significantly lower than those from Odin/SMR. The difference was ascribed to horizontal vari-ability in the Bauru region.
5.5.3 Water vapour
wave, as well as the remote SAOZ MIR long duration mea-surements. Using the same statistical method employed for ozone, Montoux et al. (2009) (Fig. 20) showed that in the stratosphere, above 20 km, HALOE displays the best precision (2.5%), followed by SAGE II (7%), MI-PAS (10%), SAOZ (20–25%), GOMOS (25%) and SCIA-MACHY (35%). In reference to HALOE, the biases are little significant, not exceeding 10% except SCIAMACHY drier by 20% and GOMOS displaying a positive gradient in con-trast to all others. The comparison degrades below 20 km, where the precision of all satellites decreases rapidly, and large biases are reported, HALOE and SAGE II (adjusted to HALOE) being drier by up to 2 ppm compared to the 4– 5 ppm of the in situ hygrometers. The situation is even worse below 16 km in the lower stratosphere, where satellite mea-surements do not appear reliable compared to in situ and re-mote balloon profiles, with the exception of AIRS agreeing within 25% with the balloon data. As for ozone, those re-sults demonstrate the quality of satellite remote water vapour measurements in the stratosphere, but also the difficulty to retrieve accurate information below 20 km in the Tropical Tropopause Layer.
5.5.4 Bromine oxide
The SAOZ UV extended version BrO profiles recorded in 2003 and 2004 constitute a unique data set for validating satellite measurements in the tropics. They were used to vali-date the SCIAMACHY limb retrievals of the Harvard Smith-sonian Center for Astrophysics (Sioris et al., 2006), of the Universities of Heidelberg and Bremen (Dorf et al., 2006; Rozanov et al., 2010), as well as those of OSIRIS-ODIN (McLinden et al., 2010). They also provided a unique refer-ence for retrieving profiles from ground-based column mea-surements at Reunion Island at the same latitude (Theys et al., 2007). Overall, after compensation for the BrO photo-chemical change between the time of the satellite overpasses and the balloon flights in late afternoon. Satellite-retrieved and balloon profiles are found consistent within±20% in the stratosphere.
5.5.5 Nitrogen dioxide
The unique set of SAOZ tropical NO2profiles recorded dur-ing the HIBISCUS campaigns has been used for direct com-parisons with satellite retrievals (e.g. with those of MIPAS, Wetzel et al., 2007) and for converting the sunset/sunrise measurements of the NDACC ground-based SAOZ in the tropics into vertical columns for comparisons with GOME, SCIAMACHY, OMI and METOP-GOME2 (e.g. Hendrick et al., 2004; Lambert et al., 2006, 2007; Celarier et al., 2008).
Fig. 20. Similar analysis of water vapour profiles. Above 20 km, all measurements are consistent within their quoted accuracy, with the exception of GOMOS showing a mixing ratio increasing with altitude. SAGE II, HALOE and MIPAS display the best precision. The REPROBUS/ECMWF model underestimates the mean water vapour mixing ratio as well as its variability. The measurements de-grade below where HALOE displays a systematic low bias like that of ozone and MIPAS a fast decrease of precision. At these altitudes best measurements are those of AIRS (Montoux et al., 2009).
6 Summary
Significant progress has been achieved within the HIBISCUS project in the understanding of mechanisms involved in the tropical UTLS dynamics, microphysics and chemistry, the representation of temperature and wind in the global meteo-rological analyses and reanalyses, and the assessment of the performances of several satellite retrievals in the tropics.
by meso-scale non-hydrostatic models, the signature of such events at the global scale is shown not captured by global Chemistry-Transport Models (CTM) models forced by Nu-merical Weather Prediction (NWP), which instead show a slow vertical lofting over the West Pacific in contradiction with our observations.
The comparison of temperature measured by the HIBIS-CUS long-duration balloons and a number of similar flights carried in the tropics by French laboratories since 1988, indi-cates a systematic time varying bias in NWP models analysis and reanalysis, similar to that observed with the radioson-des, likely coming from errors in the assimilated Strato-spheric Sounding Unit (SSU), Microwave Sounding Units (MSU) and Advanced Microwave Sounding Units (AMSU) satellite temperature retrievals. Finally, the data of chemical species collected by the HIBISCUS balloons have allowed a thorough evaluation of satellite measurements performances in the tropics, particularly of ozone, nitrogen oxide, water vapour and bromine oxide, whose data are made available for checking the progress of further retrieval versions in the ETHER French database at (http://ether.ipsl.jussieu.fr).
Appendix A
Short-duration balloon instruments
A1 In situ sensors
A1.1 DIRAC gas chromatograph
DIRAC (Determination In situ by Rapid Analytical Chro-matography) is a lightweight gas chromatograph developed by the University of Cambridge (Robinson et al., 2000; Gost-low et al., 2010). The overall instrument weight for an 8-h flight is 30 kg. DIRAC uses a Carboxen adsorbent to pre-concentrate samples of known volume before injection onto a separation column and electron capture detector. It mea-sures a range of halocarbons at a time resolution, which can be adjusted depending on the type of flight being made. For instance, CFC-11 and CFC-113 can be measured at 100-s in-tervals (0.3–0.7 km resolution depending on balloon vertical velocity) or CFC-11, CFC-113, CHCl3, CH3CCl3and CCl4 can be measured at 200-s intervals (0.6–1.4 km resolution). It has been successfully deployed on 10 balloon flights in-cluding 4 flights during THESEO 1999/2000. The repeata-bility of standard gas measurements during flight (1 sigma in-flight precision) is 6.5% for CFC-11, 7.5% for CCl4, 10% for CH3CCl3and 15% for CHCl3.
A1.2 DESCARTES grab sampler
DESCARTES (D´etermination et S´eparation par Chro-matographie lors de l’Analyse des R´esultats des Traceurs Echantillonn´es dans la Stratosph`ere) is a lightweight (17 kg)
balloon-borne grab sampler, also developed by the Univer-sity of Cambridge, in which known volumes of stratospheric air are trapped on sample tubes containing Carboxen. A range of halocarbons (typically 10 compounds) is subse-quently measured in the laboratory using a gas chromato-graph and electron capture detector. The instrument car-ries 16 adsorbent tubes, which limits the number of samples, which can be taken per flight. For a detailed discussion see Danis et al. (2000). It has been successfully deployed on over 20 flights since 1995. The measurement precision (1 sigma) is 3% for CFC-11, 1.5% for CFC-113, 16% for CCl4, 5.5% for CH3CCl3and 6.5% for CHCl3.
A1.3 Micro-SDLA tuneable laser
The µSDLA (Micro Spectrometric Diode Laser) sensor of CNRS-SA is a diode laser spectrometer devoted to the in situ measurement of H2O and CH4 in the UTLS by in-frared absorption spectroscopy (Durry et al., 2004). Three near-infrared telecommunication-type InGaAs laser diodes are connected by means of optical fibers to an open multi-path optical cell providing an absorption multi-path-length of 28 m. The laser beam is absorbed by ambient gas molecules as it is bouncing back and forth between the cell mirrors. CH4is monitored at 1.65 µm and H2O at 1.39 µm using the differen-tial detection technique. The payload also includes pressure and temperature sensors. An accuracy of 5% is achieved for a measurement duration of 160 ms. To avoid contamination by out-gassing from the balloon or the payload, only data recorded during the slow night-time descent of the balloons are considered in the TTL and the UT, continued by those during parachute descent in the lower troposphere.
A1.4 TDLAS tunable laser
The lightweight Tunable Diode Laser (TDLAS) of the Na-tional Physical Laboratory (NPL) uses near-infrared tunable diode lasers and an astigmatic Herriott cell to measure spec-troscopic absorption over a pathlength of up to 101 m. The instrument has been used for fast response measurements of atmospheric tracers on board balloons (van Aalst et al., 2004) and aircraft (Bradshfaw et al., 2002). The instrument was configured for water vapour measurements during HI-BISCUS, using an all-metal gondola designed to minimise out-gassing. The measurements were made at a frequency of 0.7 Hz over three water vapour absorption lines around 1.36 µm which had a range of line strengths to cover the wide atmospheric concentration range. Analysis was car-ried out using parameters from the Hitran 2004 spectroscopic database, and the results had an estimated uncertainty of 10%, with a detection limit of 0.5 ppm.
A1.5 Surface Acoustic Wave (SAW) H2O sensor