TEMPORAL INDICES DATA FOR SPECIFIC CROP DISCRIMINATION USING FUZZY
BASED NOISE CLASSIFIER
Vijaya Musandea*, Anil Kumarb , Karbhari Kalec and P. S. Royb a Jawaharlal Nehru Engineering College, Aurangabad
b Indian Institute of Remote Sensing, Dehradun
c Dept. of CS & IT, Dr. Babasaheb Ambedkar Marathwada University, Aurangabad
KEYWORDS: Indices, Fuzzy Error Matrix (FERM), Noise Classifier (NC).
ABSTRACT:
Evaluation of fuzzy based classifier to identify and map a specific crop using multi-spectral and time series data spanning over one growing season. The temporal data is pre-processed with respect to geo-registration and five spectral indices SR (Simple Ratio), NDVI (Normalized Difference Vegetation index), TNDVI (Transformed Normalized Difference Vegetation Index), SAVI (Soil-Adjusted Vegetation Index) and TVI (Triangular Vegetation Index). The noise classifier (NC) is evaluated in sub pixel classification approach and accuracy assessment has been carried out using fuzzy error matrix (FERM). The classification results with respect to the additional indices were compared in terms of image to image maximum classification accuracy.The overall accuracy observed in dataset 2 was 96.03% for TNDVI indices, using NC. Data used for this study was AWIFS for soft classification and LISS-III data for soft testing generated from Resourcesat-1(IRS-P6) satellite. The research indicates that appropriately used indices can incorporate temporal variations while extracting specific crop of interest with soft computing techniques for images having coarser spatial and temporal resolution remote sensing data.
1. INTRODUCTION
Time series of acquired multispectral image
represent characteristics of a landscape and each element represented has a particular spectral response, which allows the
researcher to get highly relevant information tomake
decisions without going to the field. Since objects including vegetation, have their unique spectral features (reflectance or emission response), they can be identified from remote sensing imagery according to their unique spatial characteristics. The strong contrast of absorption and scattering of the red and near infrared bands can be combined into different quantitative indices of vegetation conditions. The time series of such vegetation indices observed over a period can help in further classification of the vegetation as crop and other type of vegetation. Classification techniques for grouping cluster and finding substructure in data needs to be robust. By robustness we mean that the performance of an algorithm should not be affected significantly by small deviations from the assumed model and it should not deteriorate drastically due to noise and outliers. Robust statistics can be related to the concept of membership functions in fuzzy set theory or possibility distributions in possibility theory. This might explain the claim made by the proponents of fuzzy set theory that a fuzzy approach is more tolerant to variations and noise in the input data when compared with a crisp approach.
The immensely popular k-Means is a partitioning procedure that partitions data based on the minimization of a least squares type. The fuzzy derivative of k-Means known as Fuzzy c -Means (FCM) is based on a least squares functional; it is susceptible to outliers in the data. The performance of FCM is known to degrade drastically when the data set is noisy. This is similar to least square (LS) regression where the presence of a single outlier is enough to throw off the regression estimates. The need has therefore been to develop robust clustering algorithms within the framework of fuzzy c-means (FCM) (primarily because of FCM’s simplistic iterative scheme and good convergence properties). The usual FCM minimization constraints are relaxed to make the resulting algorithm robust. The possibilistic c-means (PCM) algorithm was developed to provide information on the relationship between vectors within
a cluster. Instead of the usual probabilistic memberships as calculated by FCM, PCM provides an index that quantifies the uniqueness of a data vector as belonging to a cluster. This is also shown to impart a robust property to the procedure in the sense that noise points are less unique in good clusters. Another effective clustering technique based on FCM is the noise classifier (NC) algorithm which uses a conceptual class called the noise classifier to group together outliers in the data. All data vectors are assumed to be a constant distance, called the noise distance, away from the noise cluster. The presence of the noise cluster allows outliers to have arbitrarily small memberships in good clusters (Banerjee and Davé 2005).
that wavelet transform performed better than the fourier transform. Kumar and Roy, 2010, has worked with add on bands in multi-spectral dataset of Worldview -2. This work has proposed class based sensor independent spectral band ratio NDVI approach for extracting crop information. Yang et al., 2008, has identified that the accuracy of surface feature recognition is improved greatly, by introducing fuzzy statistics variables into classical principal component analysis (PCA) methods on applying to the multi-spectral Landsat ETM+ data for image enhancement. Kumar and Saggar, 2008, have found that possibilstic fuzzy classifier can be used for single class extraction of interest. Class based ratio data was used as input in possibilistic fuzzy classifier and water class has been identified at sub-pixel level. It was also observed from this approach that shadow pixels were not mixing with water class pixels. Acharyya et al., 2003, has studied a feature extraction method based on m-band wavelet packet frames for segmenting remotely sensed images. These wavelet features are then evaluated and selected using an efficient neuro fuzzy algorithm. The effectiveness of the methodology was demonstrated on two four-band Indian Remote Sensing satellite (IRS-1A) images containing five to six overlapping classes and a three-band SPOT image containing seven overlapping classes. Dave 1991, has introduced the concept of characterization and detection of noise in clustering. He has presented the approach which is applicable to a variety of fuzzy clustering algorithms as well as regression analysis. Dave and Krishnapuram 1997, has studied that the classical approach to clustering based on variations of the K-means or the fuzzy c-means is not robust. The alternative formulations based on noise clustering or possibilistic clustering is robust in that they can be shown to be founded on robust statistics. Banerjee and Davé 2005, proposed a scheme, called as mega-clustering algorithm is shown to be robust against outliers. Another interesting property is its ability to distinguish between true outliers and non-outliers (vectors that are neither part of any particular cluster nor can be considered true noise). Robustness is achieved by scaling down the fuzzy memberships, as generated by FCM. A lot of work has been done in the field of single class extraction through time series multi-spectral data but while going through the literature it has been identified that the effects of various band ratio indices for fuzzy noise classifier along with crop phenology has not been explored in the past.
2. INDICES AND CLASSIFICATION APPROACHES
To enhance the vegetation signal in remotely sensed data and provide an approximate measure of green vegetation amount, a number of spectral vegetation indices have been proposed. By combining data from multiple bands into single values, because they correlate the biophysical characteristics of the vegetation of the land cover from the satellite spectral signals.
A common practice in the remote sensing is the use of band ratio to eliminate the various albedo effects. Jordan (1969), first presented the ratio vegetation index (RVI) or simple ratio (SR). Rouse et al., 1973, further suggested the most widely used normalized difference vegetation index (NDVI) to improve identification of vegetated areas and their conditions. However, the NDVI index is saturated in high biomass and it is sensitive to a number of perturbing factors, such as atmospheric effects, cloud, soil effects, and anisotropic effects, etc. Therefore, a number of derivatives and alternatives to NDVI have been proposed in the scientific literature to address these limitations. Tucker (1979), presented a transformed normalized difference vegetation index (TNDVI) by adding a constant 0.5 to NDVI
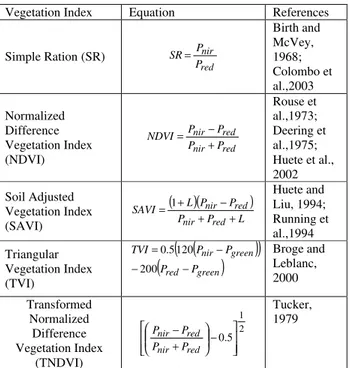
and taking the square root. It always has positive values and the variances of the ratio are proportional to mean values. TNDVI indicates a slight better correlation between the amount of green biomass and that is found in a pixel (Senseman et al. 1996). To reduce the impact to the NDVI from the soil variations in lower vegetation cover areas, Huete (1988) proposed a soil-adjusted vegetation index (SAVI) by introducing a correction factor L (Zhengwei et al., 2008).Broge and Leblanc (2000), developed triangular vegetation index (TVI), which describes the radiative energy absorbed by the pigments as a function of the relative difference between red and near-infrared reflectance in conjunction with the magnitude of reflectance in the green region, where the light absorption by chlorophyll a and b is relatively insignificant. Table 1 show different indices studied in this work.
Vegetation Index Equation References
Simple Ration (SR)
red nir P P SR= Birth and McVey, 1968; Colombo et al.,2003 Normalized Difference Vegetation Index (NDVI) red nir red nir P P P P NDVI + − = Rouse et al.,1973; Deering et al.,1975; Huete et al., 2002 Soil Adjusted Vegetation Index (SAVI)
(
)(
)
L P P P P L SAVI red nir red nir + + − + = 1 Huete and Liu, 1994; Running et al.,1994 Triangular Vegetation Index (TVI)(
)
(
)
(
red green)
green nir P P P P TVI − − − = 200 120 5 .
0 Broge and
Leblanc, 2000 Transformed Normalized Difference Vegetation Index (TNDVI) 2 1 5 . 0 − + − red nir red nir P P P P Tucker, 1979
Table 1:Various indices studied in this work
3. NOISE CLASSIFIER
)
,
,
,
(
,
2 2m
d
d
j
i
ij ikδ
µ
=
(1)where 1= k = c 1= j = c and
)
,
,
(
1
,
2m
d
c
i
δ
ijµ
+
=
(2)δ
>0, any float value greater than zero.The objective function, which satisfies this requirement, may be formulated as;
∑
=
+
+
∑
=
∑
=
=
N
i
m
c
k
u
c
j
ij
d
ij
u
N
i
d
ij
u
U
1
)
1
,
(
1
1
)
(
δ
(3)And
ν
>0, any float value greater than zeroδ
>0, any float value greater than zeroWhere 8 >m>1, (any constant float value more than 1) N= row * column (image size
i = stands for pixel position at ith location distance between X i
and Vj
)
(
)
(
2
||
||
2
j
V
i
X
A
T
j
V
i
X
A
j
V
i
X
ij
d
=
−
=
−
−
Vj = Mean Vector for each class
4. TEST DATA AND STUDY AREA
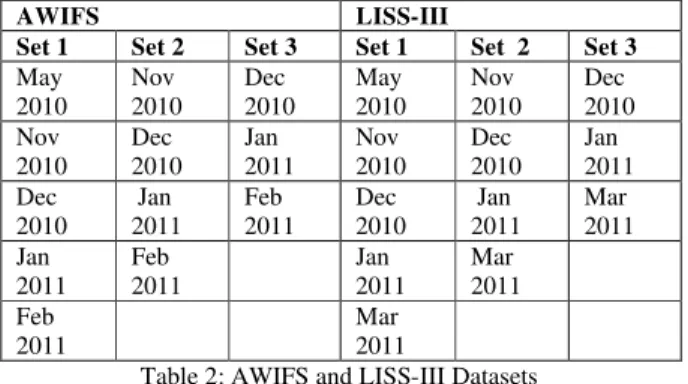
The study area taken for this research work was Aurangabad (19° 53' N, 75° 23' E) region, in Maharashtra state in India shown in figure 1. In this study remotely sensed images of Indian Remote Sensing Satellite (IRS-P6) were selected for cotton crop identification.In Aurangabad district the area under cotton is comparatively higher than the other crops. Due to the higher area under cotton cultivation and production of raw cotton, the stakeholders involves in the cotton supply chain are interdependent. For this purpose temporal images of Advanced Wide Field Sensor (AWIFS) and Linear Imaging Self Scanner sensor (LISS-III) with spatial resolution of 56m and 23.5m respectively where used. LISS-III time-series multi-spectral satellite data was used for testing purpose. Different datasets of the time series multi-spectral images were taken for further classification. These datasets were taken for making the inference of suitable time-series images. Total five scenes of the study areas were available. The datasets for AWIFS and LISS-III are shown in table 2.
Table 2: AWIFS and LISS-III Datasets
IRS-P6 LISS-III data are well suited for agricultural and forestry monitoring. LISS-III (IRS-P6) time-series multi-spectral satellite data was used as testing data for accuracy assessment. The coarse resolution images should be co-registered against the fine resolution images. The characteristic of the AWIFS and LISS-III sensor have been mentioned in Table 3. The spatial pixel ratio between classification image AWIFS and testing image LISS-III is 1:3, means that the one pixel of AWIFS image is equal to nine pixels of LISS-III image. Total five temporal scenes of LISS-III data were used for generating testing data sets. The datasets are shown in table 2. In India cotton season start from last week of May and it runs up to end of February. Depending on temperature and variety, 50 to 85 days are required from planting to first bud formation, 25 to 30 days for flower formation and 50 to 60 days from flower opening to mature ball. No clear distinction can be made in crop growth periods since vegetative growth is continued during flowering and ball formation and flowering is continued during ball formation.
Sensors
Specifications
AWIFS LISS-III
IGFOV 56 m (nadir)
70m (at field edge)
23.5 m
Spectral Bands B2: 0.52-0.59
B3: 0.62-0.68 B4: 0.77-0.86 B5: 1.55-1.70 (SWIR) B2: 0.52-0.59 B3: 0.62-0.68 B4: 0.76-0.86 B5: 1.55-1.70 (SWIR)
Swath 370 km each head
740 km (combined)
141 km
Data Quantization
10 bit 7 bit (VNIR), 10 bit
(SWIR)
Table 3: Sensor specification of Resource Sat-1 (P6) satellite
May 2010 Nov. 2010 Dec. 2010 Jan 2010 Mar 2010
Figure 1: Study area depicted through temporal LISS-III images
5. TIME SERIES DATASETS
The AWIFS and LISS-III images were stacked in three (03) datasets. Considering the life-cycle of cotton crop, the Sets were established with the aim to get the most suitable time-series images, combining different multi-date in each set.
AWIFS LISS-III
Set 1 Set 2 Set 3 Set 1 Set 2 Set 3
a) The dataset 1, contain information from May 2010 to Feb. 2011 (05 images). Dataset 1 has five time-series images of pre-sowing (one image), flower to open ball (three images) and harvesting (one image) stage respectively.
b) The dataset 2, contain information from Nov.10 to Feb.11 (04 images) flower to open ball (three images) and harvesting (one image) stage.
c) Dataset 3 three time-series images were stacked from
Dec.10 to Feb.11 that contains information about flower to open ball (two images) and harvesting (one image) stage.
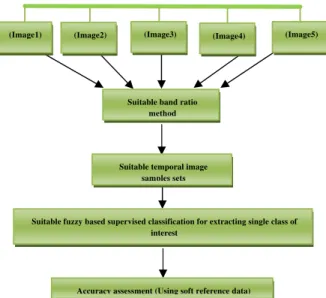
6. METHODOLOGY ADOPTED
The methodology adopted for this research work was broadly divided into four stages as shown in figure 2.
Figure 2: Methodology adopted
In the present research work the AWIFS data sets are used. While acquiring the raw time series multi-spectral data it has been processed for atmospheric and geometric correction. Training sites for cotton were identified on LISS-III and AWIFS images with the help of global positioning system (GPS) data and the visually interpreted FCC images. In order to reduce the error the LISS-III images were geo-referenced using Erdas AutoSynco, while AWIFS images were co-registered with reference to LISS-III images. Output cell size for LISS-III images was taken as 20 while for AWIFS 60 to have spatial pixel size ratio of 1:3 between AWIFS and LISS-III images. Common area of interest from all temporal images were generated using the subset tool in Erdas imagine. To create the models of the five band ratio vegetation index chosen, as discussed in section indices and classification approaches, ERDAS Model Maker was used.
As mentioned in Table 2 the different datasets were taken to find out the most suitable time-series (multi-date) images. Multi-date various vegetation indexes (NDVI, TNDVI, SR, TVI, and SAVI) from AWIFS and LISS-III scenes were computed for the ground truth sites (Figure 3). The fuzzy set theory based sub-pixel classification technique was used for further classification. The samples of cotton were taken from both AWIFS and LISS-III time-series images. For testing the
classification accuracy reference fraction images were used from LISS-III sensor of IRS-P6 satellite having both the data sets of same dates as of AWIFS data. The accuracy assessment of sub-pixel classification output has been conducted using fuzzy error matrix (FERM) (Binaghi et al., 1999).
0 0.1 0.2 0.3 0.4 0.5 0.6 0.7 0.8 0.9 1
Indices Value
Months
Different Indices of Cotton Crop from LISS-III Image
NDVI
SAVI
SR
TNDVI
TVI
Figure 3: Different indices of cotton crop from LISS-III image
7. RESULT AND DISCUSSION
In this paper, it has been presented how various indices along with special form of noise classifier impact the accuracy of the multi-temporal crop classification. For this the ALCM module from, SMIC: Sub-Pixel Multi-Spectral Image Classifier package (Kumar et al., 2006) has been used. The ALCM module has capability to process multiple multi-spectral images for single land cover class extraction at sub-pixel level using supervised approach.
Table 4: Image to image overall accuracy of data sets for five indices using noise classifier
The table 4 shows comparison of accuracy for indices NDVI, SAVI, SR, TNDVI and TVI band ratio techniques when applied on all the three data sets using NC. The best accuracy was from second dataset of the TNDVI indices with 96.02% overall fuzzy accuracy. The classified output using NC of three sets for five vegetation indices are shown in Figure 4. It has been observed that, if we take the images of pre-flowering, flowering maturity, and harvesting stage, and for assessment take the same or similar date’s images of testing and reference datasets, it will give the best result for crop identification and discrimination.
CONCLUSION
The aim of this study was to map single crop of interest using fuzzy based classifier with the help of time-series multi-spectral satellite images. The crop under consideration in this work is cotton cultivated in Aurangabad district of Maharashtra province in India. Data used for this study was AWiFS (coarser resolution) for soft classification and LISS-III (medium coarser) data for soft testing from Resourcesat-1 (IRS-P6) satellite. The output noise classifier (NC) along with the five indices has been studied.NC classifier was evaluated in sub pixel classification
Dataset SR NDVI TNDV
I SAVI TVI
SET 1 93.40 65.74 91.44 90.93 86.89
SET 2 82.84 82.82 96.02 83.64 83.88
SET 3 80.84 81.40 95.96 84.27 91.58
(Image1) (Image2) (Image3) (Image4) (Image5)
Suitable band ratio method
Suitable fuzzy based supervised classification for extracting single class of interest
Accuracy assessment (Using soft reference data) Suitable temporal image
approach and fuzzy accuracy assessment has been carried out using FERM. It is found that the maximum accuracy achieved was 96.02% for TNDVI index of dataset 2. According to results obtained from this work, selection of suitable temporal data sets, appropriate band ratio and use of fuzzy based classifiers, helps in handling mixed pixels in coarser data sets.
SET 1 SET 2 SET 3
NDVI
SAVI
SR
TNDVI
TVI
Figure 4:Output showing cotton crop using Noise Classifier
REFERENCES
Acharyya M, De RK and Kundu M, (2003), Segmentation of Remotely Sensed Images Using Wavelet Features and Their Evaluation in Soft Computing Framework, IEEE Transactions On Geoscience And Remote Sensing, Vol. 41, No. 12, pp. 2900-2905.
Banerjee A. and Davé R. N., (2005), The Fuzzy Mega-cluster: Robustifying FCM by Scaling Down Memberships © Springer-Verlag Berlin Heidelberg, LNAI 3613, pp. 444 – 453.
Binaghi E., Brivio P. A., Chessi P. and Rampini A. (1999), A fuzzy Set based Accuracy Assessment of Soft Classification. Pattern Recognition letters 20: pp. 935-948.
Birth, G. S. and McVey G., (1968) Measuring the color of growing turf with a reflectance spectroradiometer, Agronomy Journal, 60:640-643.
Broge N. H. and E. Leblanc (2000). Comparing Predicting Power and Stability of Broadband and Hyperspectral vegetation Indicies for Estimation of green area index and canopy Chlorophyl density, Remote Sensing Environment,76 (2000): 156-172.
Colombo R., Bellingeri D., Fasolini D. and Marino C. M. (2003) Retrieval of leaf area index in different vegetation types using high resolution satellite data. Remote Sensing of Environment, 86, 120-131.
Dave R. N., (1991). Characterization and detection of noise in clustering Pattern Recognition Letters 12 , pp. 657-664.
Dave R. N and Krishnapuram R, 1997. Robust Clustering
Methods: A Unified View. IEEE Transactions on Fuzzy
Systems, Vol. 5, No. 2, pp. 270-293.
Deering D. W., Rouse J. W., Haas R. H. and Schell J. A. (1975) Measuring “Forage Production” of grazing units from Landsat MSS data, Proceedings of the 10th International Symposium on Remote Sensing of Environment, II:1169-1178.
Huete A. R. (1988). A soil-adjusted vegetation index (SAVI), Remote Sensing of Environ, Volume 25, Issue 3, August 1988, pp. 295-309.
Huete A. and Liu H. (1994) An error and sensitivity analysis of the atmospheric-correcting and soil-correcting variants of the NDVI for the MODIS-EOS. IEEE Transactions on Geoscience and Remote Sensing, 32(4), 897-905.
Huete A., Didan K., Miura T., Rodriguez E. P., Gao X. and Ferreira L. G. (2002) Overview of the radiometric and biophysical performance of the MODIS vegetation indices, Remote Sensing of Environment, 80(1-2): 195-213.
Jordan, C.F.,(1969).. Derivation of leaf-area index from quality of light on the forest floor, Ecology, 50, pp. 663–666.
Kumar A. and Roy P. S., (2010). Effects on specific crop mapping using worldview-2 Multispectral add on bands-A soft classification approach, Geospatial World Forum, Hyderabad, India.
Kumar A. and Saggar S., (2008). Class Based Ratioing Effect On Sub-Pixel Single Land Cover Automatic Mapping, International Archives Of The Photogrammetry, Remote Sensing And Spatial Information Sciences, VXXXVII, Part B7, pp. 527-532.
Kumar A., Ghosh S. K. and Dadhwal V.K., (2006). Sub-Pixel
Land Cover Mapping: SMIC System. ISPRS International
Symposium on “Geospatial Databases for Sustainable
Development” Goa, India, September 27-30.
Linlin L. and Huadong G., (2008). Wheat Phenology Extraction from Time-Series of SPOT/VEGETATION data, Congress on image and signal processing, Beijing, China, pp. 794-797.
Lucas R., Rowlands A., Brown A., Keyworth S. and Bunting P., (2007). “Rule-based classification of multi-temporal satellite imagery for habitat and agricultural land cover mapping”, ISPRS Journal of photogrammetry and Remote Sensing, Vol. 62, Issue 3, pp.165-185.
Panda S. S., Ames D. P. and Panigrahi S.,(2010). Application Of Vegetation Indices For Agricultural Crop Yield Prediction
Using Neural Network Techniques, Remote sensing, ISSN
2072-4292,2, pp. 673-696.
Rouse, J. W., R. H. Haas, J. A. Schell, and D. W. Deering, (1973). Monitoring vegetation systems in the Great Plains with ERTS, Third ERTS Symposium, NASA SP-351 I, pp. 309-317.
Running S. W., Justice C. O., Salomonson V., Hall D., Barker J., Kaufmann Y. J., Strahler A. H., Huete A. R., Muller J.-P., Vanderbilt V., Wan Z. M., Teillet P. and Carneggie D. (1994) Terrestrial remote sensing science and algorithms planned for EOS/MODIS, International Journal of Remote Sensing, Vol. 5. No. 17, 3587-3620.
Sakamoto T., Yokozawa M., Toritani H., Shibayama M., Ishitsuka N. and Ohno H., (2005). A crop phenology detection
method using time-series MODIS data, Remote Sensing of
Environment, Vol. 96, pp. 366 – 374.
Senseman, G. M. Tweddale, Scott A. Anderson, Alan B. and Bagley, Calvin F.,(1996). Correlation of Land Condition Trend Analysis (LCTA) Rangeland Cover Measures to Satellite-Imagery-Derived Vegetation Indices. USACERL Technical Report 97/07. USA.
Te-Ming T., Lu HT, Chang YS, Chang JC and Chang CP (2009) A New Vegetation Enhancement Extraction Technique
for IKONOS and Quick Bird Imagery. IEEE Geosciences And
Remote Sensing Letters Vol.6 No.2.
Tucker C. J., (1979). Red and photographic infrared linear combinations for monitoring vegetation, Remote Sensing of Environment, Vol. 8, pp. 127-150.
Wardlow B. D. and Egbert S. L., (2008). Large-area crop mapping using time series MODIS 250 m NDVI data: An assessment for the U.S. Central Great Plains, Remote Sensing of Environment, Vol.112, 1096–1116.
Yang C, Lu L, Lin H, Guan R, Shi X, and Liang Y.,(2008). A Fuzzy-Statistics-Based Principal Component Analysis (FS-PCA) Method for Multispectral Image Enhancement and
Display. IEEE Transactions On Geoscience And Remote
Sensing Vol.46 No.11. pp. 3937-3947.
Yang Z, Zhao H, Liping D and Genong Y., (2009) A Comparison of Vegetation Indices for Corn and Soybean Vegetation Condition Monitoring IEEE IGARSS 978-1-4244-3395, pp. IV-801- IV-804.