Correlation between Either
Cupriavidus
or
Porphyromonas
and Primary Pulmonary
Tuberculosis Found by Analysing the
Microbiota in Patients
’
Bronchoalveolar
Lavage Fluid
Yuhua Zhou1,3, Feishen Lin2, Zelin Cui1, Xiangrong Zhang2, Chunmei Hu2, Tian Shen4, Chunyan Chen1, Xia Zhang2*, Xiaokui Guo1*
1Department of Medical Microbiology and Parasitology, Institutes of Medical Sciences, Shanghai Jiao Tong University School of Medicine, Shanghai, China,2Department of Tuberculosis, Nanjing Chest Hospital, Nanjing, Jiangsu, China,3Department of Emergency Medicine, Rui Jin Hospital Shanghai Jiao Tong University School of Medicine, Shanghai, China,4Department of Preventive Medicine, Shanghai Jiao Tong University School of Medicine, Shanghai, China
*microbiology@sjtu.edu.cn(XKG); zhangxia365@sina.com(XZ)
Abstract
Pulmonary tuberculosis (TB) has gained attention in recent decades because of its rising in-cidence trend; simultaneously, increasing numbers of studies have identified the relation-ship between microbiota and chronic infectious diseases. In our work, we enrolled 32 patients with primary TB characterised by unilateral TB lesion formation diagnosed by chest radiographic exam. Bronchoalveolar lavage fluid was taken from both lungs. Twenty-four healthy people were chosen as controls. Pyrosequencing was performed on the V3 hyper-variable region of 16S rDNA in all bacterial samples and used as a culture-independent method to describe the phylogenetic composition of the microbiota. Through pyrosequen-cing, 271,764 amplicons were detected in samples and analysed using tools in the Ribo-somal Database Project (RDP) and bioinformatics. These analyses revealed significant differences in the microbiota in the lower respiratory tract (LRT) of TB patients compared with healthy controls; in contrast, the microbiota of intra/extra-TB lesions were similar. These results showed that the dominant bacterial genus in the LRT of TB patients was
Cupriavidusand notStreptococcus, which resulted in a significant change in the microbiota in TB patients. The abundance ofMycobacteriaandPorphyromonassignificantly increased inside TB lesions when compared with non-lesion-containing contralateral lungs. From these data, it can be concluded thatCupriavidusplays an important role in TB’s secondary infection and that in addition toMycobacteria,Porphyromonasmay also be a co-factor in le-sion formation. The mechanisms underlying this connection warrant further research.
OPEN ACCESS
Citation:Zhou Y, Lin F, Cui Z, Zhang X, Hu C, Shen T, et al. (2015) Correlation between Either
CupriavidusorPorphyromonasand Primary Pulmonary Tuberculosis Found by Analysing the Microbiota in Patients’Bronchoalveolar Lavage Fluid. PLoS ONE 10(5): e0124194. doi:10.1371/journal. pone.0124194
Academic Editor:Pere-Joan Cardona, Fundació Institut d’Investigació en Ciències de la Salut Germans Trias i Pujol. Universitat Autònoma de Barcelona. CIBERES, SPAIN
Received:September 28, 2014
Accepted:February 26, 2015
Published:May 22, 2015
Copyright:© 2015 Zhou et al. This is an open access article distributed under the terms of the
Creative Commons Attribution License, which permits unrestricted use, distribution, and reproduction in any medium, provided the original author and source are credited.
Introduction
Pulmonary tuberculosis (TB) is an ancient chronic infectious disease that has always been a crucial challenge for public health [1]. Clinically, typical TB presents as granuloma-like lesions in the lung and chronic consumptive symptoms [2,3]. In the field of TB research, the pathogen
Mycobacteria tuberculosisis the focal point, and issues related to its virulence, pathogenicity and drug resistance have been extensively researched [4,5]. With the development of systemat-ic biology, the concept and mechanisms underlying persistent infections has changed and which suggests that infectious diseases reflect an equilibrium between the host and the patho-gen that is established and maintained by a broad network of interactions that occur across scales, ranging from molecular and cellular to whole organism and population levels [6,7]. Chronic TB is a unique infection in the human body that is different from other types of diffuse pulmonary infections, and the formation of granulomas isolates the pathogens involved from other lung tissue. However, when judged through the lens of new infection concepts, changes in the microbiota in the lungs likely play an important role in the pathological process [8].
The rapid development of nucleotide sequencing technology has made it possible to uncover the composition of microbiota in some cavities in the human body [9]. For example, many pub-lished articles have examined the bacterial flora in the vagina, intestine and lung, attempting to determine the relationship between changes in local microbiota and such diseases as obesity, inflammation or diabetes [10,11]. In our previous researches, we also described the difference among the microbiota from healthy individuals, patients with hospital acquired pneumonia and patients with community acquired pneumonia [12,13]. From the viewpoint of the current stud-ies, the stability or instability of the microbiotain vivodeeply influences the maintenance of health and the onset or progression of disease [7]. We hypothesise that the understanding of the link between the microbiota and persistent infection in the lungs of TB patients is currently in the very early stages and is an important topic for further research; therefore, the composition of the microbiota in intra- or extra-TB lesion areas needs to be analysed.
Bronchoalveolar lavage (BAL) fluid, which is obtained by means of bronchoscopy, is the carrier that best reflects the composition of the microbiota in the lower respiratory tracts (LRT) and alveoli of humans [14,15]. In this study, we enrolled 32 primary TB patients with unilateral TB lesion formation, with the opposite lungs presenting as‘healthy and lesion-free’upon chest X-ray and Computed tomography (CT) examination. After the patients had been hospitalised and received a standard 2-week-long anti-TB treatment, bronchoalveolar lavage samples were collected. Alveolar lavage fluid was taken from both the lung with the TB lesion and the contra-lateral normal pulmonary tissue. Twenty-four healthy volunteers of similar ages were also se-lected, and their respiratory tract secretions were collected as normal controls.
A common method in microecology is based on massively parallel pyrosequencing of bacte-rial 16s rDNA amplicons in the V3 region; the feasibility of this approach has been shown in other infections [16]. Our objectives were to analyse and compare the microbiota of the TB le-sion-forming area of the lung with that of the non-lesion forming areas of the lungs, and to compare it with the microbiota of TB patients and with that of healthy individuals. Our com-parative study of these different populations offers some primitive conclusions and insights of a breadth previously unavailable in the study of pulmonary tuberculosis.
Materials and Methods
Ethics Statement
Bronchoscopy is a common method used in the field of diagnosis and therapy of the tuberculo-sis, especially in endobronchial tuberculosis. Its merits and safety were proven in previous
our raw data in FASTA file format to the integrated repository named DRYAD (http://datadryad.org/) and all files are available by the DOI:10.5061/dryad. mt24h.
Funding:This work was supported by grants from the National Natural Science Foundation of China (81271793, and 81261160321), the Research Fund for the Doctoral Program of Higher Education of China (20120073110071), and the National Support Program of Science and Technology
(2012EP001004). The funders had no role in study design, data collection and analysis, decision to publish, or preparation of the manuscript.
clinical operations [17]. The study was approved by the ethics committee of Nanjing Chest Hospital. All the clinical works fulfilled the guideline of the bronchoscopy treatment towards the pulmonary tuberculosis [18,19]. As a kind of invasive operation, bronchoscopy requires strictly trained operator and the formal consent from every patient before being undergone. In clinic, every enrolled patient must sign a notification which declaims the aims, methods, merits and risks of this operation in detail. On the base of patients’full understanding and when the signatures were obtained, the bronchoscopy was allowed to be undergone and the bronchoal-veolar lavage fluid was obtained. If the bronchoalbronchoal-veolar lavage fluid was suit for our research work, the corresponding patient would be further informed that his/her sample would be fur-ther used in research work after the relative clinical works were done. In this step, after obtain-ing the verbal consent from the patient, our research would be undertaken. Our lab work was started after the samples being discarded. This study didn't involve patient private information and any adjustment or difference in clinical treatment. Therefore, all the samples were not in-tended to be collected specially for the research but a step after the routine clinical exam. We provided the scanning file of the pre-operation notification (original manuscript in Chinese used in clinical work) and the translated file made by authorized translator (manuscript in En-glish) in supporting information (S1andS2Files).
The volunteers as normal control were acted by the relatives of the members of our work group. All of them agreed to support our research work. Unlike the patients’samples, the sam-ples of volunteers were saliva which collected by non-invasive method. After inquiring the eth-ics committee of Nanjing Chest Hospital, they agreed that we could require them to provide their verbal consents. Of cause, they were informed all the details of the usage of their samples.
Patient selection and research design
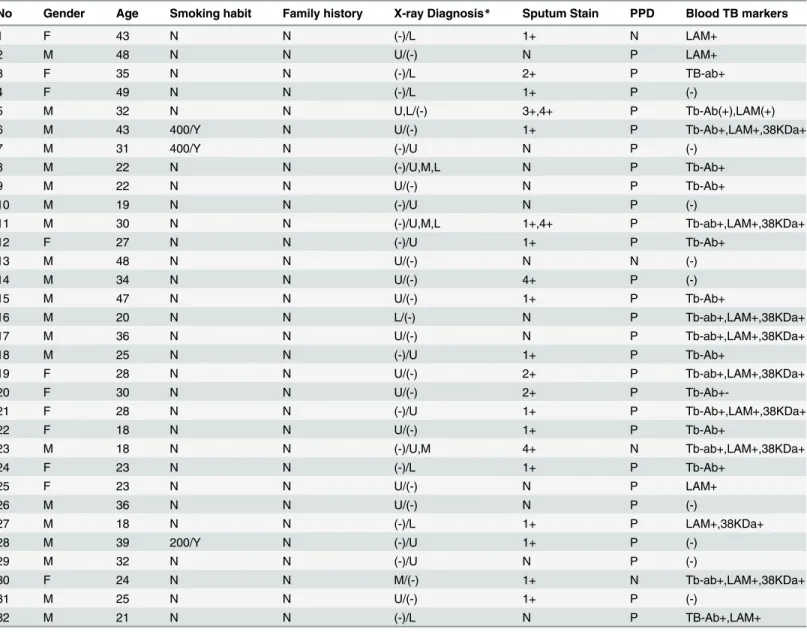
Thirty-two patients between the ages of 18 to 48 years old with primary tuberculosis were en-rolled in this study. The average age was 30.4 and median age of 29. Only 3 patients had smok-ing histories. The ratio of males to females in the study cohort was 21/11 (Table 1). All of the patients were clinically diagnosed with primary pulmonary tuberculosis via sputum stain, tu-berculin PPD (purified protein derivative) test, blood TB markers and chest radiographic exam. Chest radiography was the most important criteria for patient inclusion in the study be-cause it confirmed single-sided lung TB lesion formation as judged by X-ray or CT exam; this criteria ensured that every patient had one side on the contralateral lung that was normal ac-cording to a chest imaging exam [20]. None of the patients had other basic lung diseases or sys-temic or immune-compromising diseases, such as diabetes or HIV. In addition, none of the patients had received antibiotics for at least 3 months before sample collection.
Before the undertaking of bronchoscopy, every patient accepted a standard two-week-long anti-TB treatment with a combination of isoniazid, rifampicin, ethambutol and pyrazinamide and thus aimed to confine the activation of pathogens and reduce the risk of its dissemination
because of the limit of the instrument and operating skills, for example, the trachea acted as the common pathway when push-in and pull-out the bronchoscopy, we believe that these mea-sures would minimize the bias by present methodology. After the operation, the anti-TB medi-cine treatment would be continued after the operation until the end of required medimedi-cine course of treatment by guideline.
Twenty-four healthy people were also selected as normal controls. All of the controls lived in the same region as the patients and had similar lifestyle and eating habits. They had no smoking history, basic pulmonary disease, severe oral disorders, systemic diseases or other dis-eases known to affect the lungs’microbiota. The samples from the healthy controls were a mix-ture of saliva and pharyngeal secretions obtained by deep coughing in the early morning before gargling. These samples were defined as Group H.
Table 1. Clinical information of the enrolled TB patients.
No Gender Age Smoking habit Family history X-ray Diagnosis* Sputum Stain PPD Blood TB markers
1 F 43 N N (-)/L 1+ N LAM+
2 M 48 N N U/(-) N P LAM+
3 F 35 N N (-)/L 2+ P TB-ab+
4 F 49 N N (-)/L 1+ P (-)
5 M 32 N N U,L/(-) 3+,4+ P Tb-Ab(+),LAM(+)
6 M 43 400/Y N U/(-) 1+ P Tb-Ab+,LAM+,38KDa+
7 M 31 400/Y N (-)/U N P (-)
8 M 22 N N (-)/U,M,L N P Tb-Ab+
9 M 22 N N U/(-) N P Tb-Ab+
10 M 19 N N (-)/U N P (-)
11 M 30 N N (-)/U,M,L 1+,4+ P Tb-ab+,LAM+,38KDa+
12 F 27 N N (-)/U 1+ P Tb-Ab+
13 M 48 N N U/(-) N N (-)
14 M 34 N N U/(-) 4+ P (-)
15 M 47 N N U/(-) 1+ P Tb-Ab+
16 M 20 N N L/(-) N P Tb-ab+,LAM+,38KDa+
17 M 36 N N U/(-) N P Tb-ab+,LAM+,38KDa+
18 M 25 N N (-)/U 1+ P Tb-Ab+
19 F 28 N N U/(-) 2+ P Tb-ab+,LAM+,38KDa+
20 F 30 N N U/(-) 2+ P
Tb-Ab+-21 F 28 N N (-)/U 1+ P Tb-Ab+,LAM+,38KDa+
22 F 18 N N U/(-) 1+ P Tb-Ab+
23 M 18 N N (-)/U,M 4+ N Tb-ab+,LAM+,38KDa+
24 F 23 N N (-)/L 1+ P Tb-Ab+
25 F 23 N N U/(-) N P LAM+
26 M 36 N N U/(-) N P (-)
27 M 18 N N (-)/L 1+ P LAM+,38KDa+
28 M 39 200/Y N (-)/U 1+ P (-)
29 M 32 N N (-)/U N P (-)
30 F 24 N N M/(-) 1+ N Tb-ab+,LAM+,38KDa+
31 M 25 N N U/(-) 1+ P (-)
32 M 21 N N (-)/L N P TB-Ab+,LAM+
*In the column of X-ray diagnosis shows the location of TB lesion in each patient. Left side of the‘/’refers to the left lung and right side refers to right lung. U, M, L refer to the upper, middle and lower lobi of lungs respectively and‘-’refers to lesion-free lungs.
Establishment of the 16S rDNA library and 454 pyrosequencing
The protocols for DNA extraction from samples and PCR enrichment of the V3 region of 16S have been previously described [12]. Because the lavage fluid from TB patients is highly infec-tious, pre-extraction sample preparation was modified as follows: all lavage samples were heat-ed and pasteurisheat-ed at 80°C for 2 hours and then centrifugheat-ed at 12,000 xgfor 10 minutes. The supernatant was discarded, and the sediment was collected. The remaining sediment was resus-pended in sterile saline, and DNA extraction protocols were performed.
PCR enrichment of the V3 hyper-variable region of 16S rRNA was performed with forward primer 5’-XXXXXXXX-TACGGGAGGCAGCAG-3’and reverse primer 5’ -XXXXXXXX-ATTACCGCGGCTGCTGG-3’. The 5’termini of each primer contained a different 8-base oligonucleotide tag before the hyphen, while the sequence after the hyphen was able to pair with the sequence at the V3 end region.
To ensure that there was sufficient PCR product to harvest, a two-step PCR strategy was used. The first step was conducted in a 25-ul reaction volume containing 2.5μl of PCR buffer
(TaKaRa), 0.625 U ExTaq (TaKaRa), 0.1μl of BSA (TaKaRa), and 2μl of primer solution with
100μmol of each forward and reverse primer. Fifty nanograms of extracted DNA were added
as a template. ddH2O was added to reach the final reaction volume. The touchdown PCR
con-ditions were as follows: 5 min at 94°C for initial denaturation, 1 min at 94°C for denaturation, 1 min at 65°C for annealing and 1 minute at 72°C for extension, with the annealing tempera-ture decreasing by 0.5°C for each step of the 20 cycles. The reaction volume in the second step of the PCR was 50μl. Five microliters of the reaction from Step One were used as a template
for this reaction with 5μl of PCR buffer (TaKaRa), 1.25 U ExTaq (TaKaRa), 0.2μl of BSA
(TaKaRa), and 24μl of water with 200μmol of each barcoded forward and reverse primer. The
heating cycle lasted 1 minute at 94°C for denaturation, 1 minute at 55°C for annealing, and 1 minute at 72°C for extension for five cycles with the temperature kept at 20°C after the reac-tion. The sequencing work was performed at the Chinese National Human Genome Centre in Shanghai using a Roche 454 FLX sequencing machine. The sequences were stored as SRA ac-cession numbers SRA051957 and SRA054227.
Data analysis by bio-informatics and statistical methods
The datasets were taxonomically grouped using the Ribosomal Database Project (RDP) Naive Bayesian classifier with a confidence level of 90% [21]. Gross sequencing data were first searched for the linker, primers, and their reverse complements using the platform provided by the centre. Identified primer sequences were trimmed from each sequence read. Sequence reads that did not contain the 5’-end primer were removed from the data set. The same pro-gram was also used for barcode identification. Barcodes were identified within the first 25 bases of the reads. Sequence reads were binned into FASTA files based on the different barcodes.
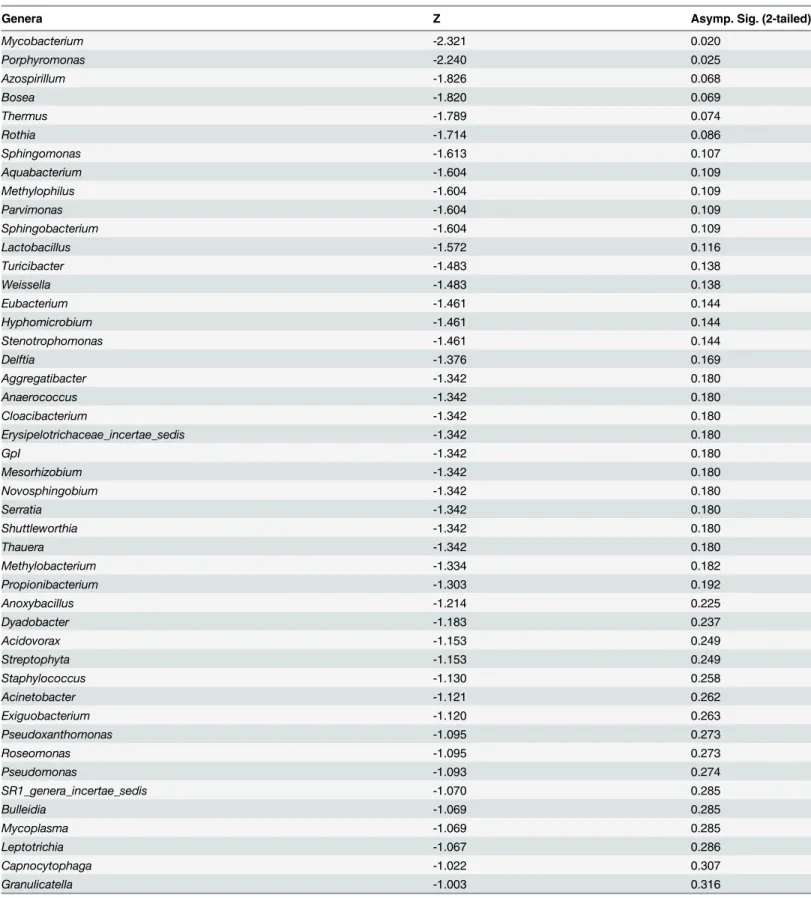
Although the bio-informatics methods were able to provide us a phylogenetic distance or re-lationships among samples, we could only describe the difference in the whole-body level. In order to find out which genera played the most important roles in the microbiota’s change and which genera varied obviously in ratios when comparing the samples from lesion-bearing and lesion-free lobi, we used a paired Wilcoxon signed-rank test by SPSS (Statistical Package for the Social Sciences) 19.0 to compare the percentages of genera which were detected simulta-neously in both sides of the patients’lungs.
Data availability statement
We have uploaded our 16s V3 rDNA sequences obtained by 454 platform in the public repository named SRA (Sequence Read Archive,http://www.ncbi.nlm.nih.gov/Traces/sra/). The accession number of the sequences from healthy individuals is SRR493275. The accession numbers of the sequences from TB patients are SRS375896, SRX204970 and SRR617950. All these data are in the state of“public”. Meanwhile, according to the PLOS data policy, we also deposited our raw data in FASTA file format to the integrated repository named DRYAD (http://datadryad.org/) and all files are available by the DOI:10.5061/dryad.mt24h.
Results
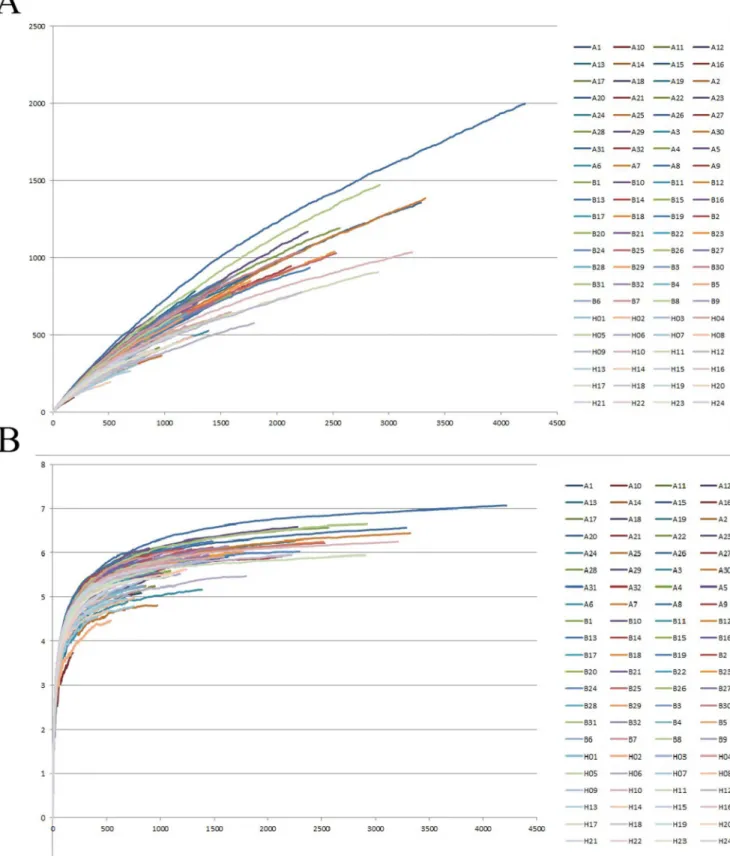
A total of 271,164 PCR amplicons were detected by pyrosequencing in all samples that were ap-proximately 200 bp in length, and each sample contained 3081.4 amplicons on average. The di-versity and richness of the amplicons in each sample were evaluated using Shannon-Weaver index and rarefaction curves, which are shown asFig 1. The mean Shannon diversity indices were 5.40, 5.71, and 5.31 for Groups A, B, and H respectively. The patient indices in Group B were significantly higher than those of Group H (p = 0.004). Nearly all of the Shannon curves featured two-component curves that included a sharp slope in the beginning and a less-sharp slope for the remainder.
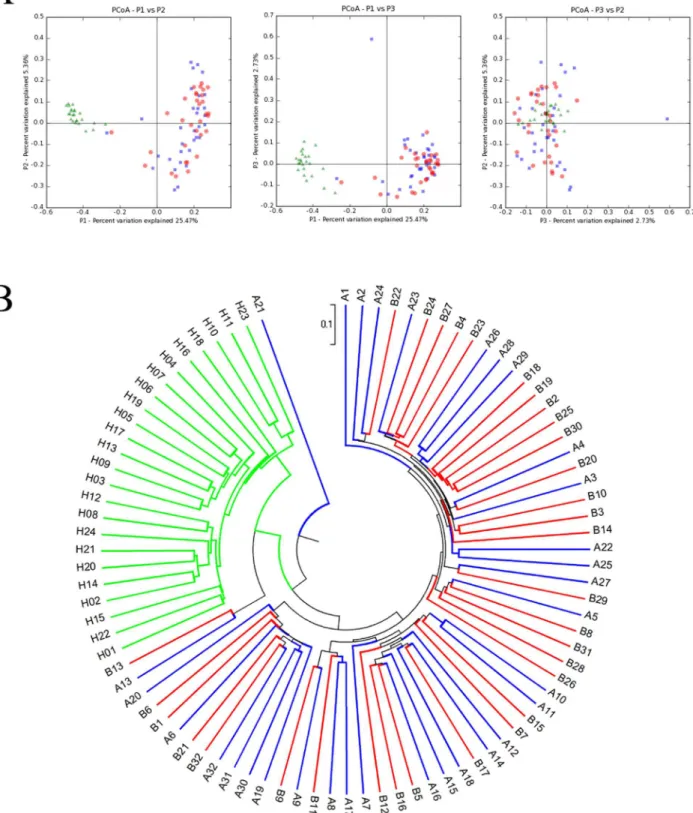
The similarities between the microbiota of selected individuals are shown inFig 2, using principal coordinate analysis (PCoA) and a phylogenetic tree. After pyrosequencing, all de-tected amplicons were clustered in Uclust with a cutoff threshold of 97%, followed by the gen-eration of 6319 OTUs. The phylogenetic relationships between the microbiota from different groups became visible after calculating the Unifrac distance, as shown inFig 2.Fig 2A demon-strates that the microbiota from Group H were phylogenically distant from the microbiota of TB patients, andFig 2Bshows that the microbiota from these two groups clearly fell into two different sub-branches. In contrast, the microbiota from Groups A and B were too similar to clearly separate.
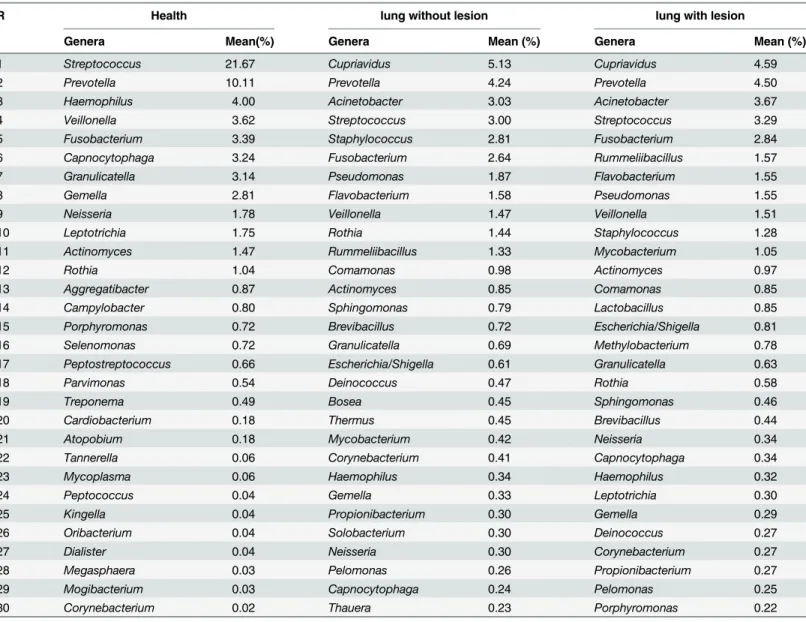
To describe the detailed composition features of the microbiota in detail, amplicons were sorted into bacterial families. The hierarchical clustering heatmap shown inFig 3displays the abundance of each family and the relationships between families and samples. Group H is clus-tered at the right side of the figure, and patients (Groups A and B) are clusclus-tered to the left. The distribution of hot points clearly suggests significant differences between the microbiota of healthy controls and that of TB patients. When all amplicons were sorted to the level of bacteri-al genera, amplicons belonging to every detected genus were counted. The top 30 genera with the highest percentage in each group are presented inTable 2. These results showed that Strep-tococcuswas the most abundant genus in healthy specimens, andCupriaviduswas the domi-nant genus in patients. The percentages of genera from both sides were compared using a Wilcoxon signed-rank test for TB patients. This analysis revealed that with the exception of
Fig 1. Rarefaction and Shannon Weaver index analysis were used to evaluate the richness and diversity of amplicons.(A) Rarefaction curves were used to estimate the richness of the amplicons in each sample. (B) Shannon-Weaver index curves were used to estimate the amplicons’diversity of each sample.
Fig 2. Principal component analysis (PCoA) and phylogenetic trees between the samples.(A) PCoA shows the relationship between the samples. Each data point represents the microbiome identified from one sample. The green, blue and red points represent samples from Groups H, A and B,
respectively. (B) A phylogenetic tree shows the phylogenetic distance between samples. The green, blue and red points represent samples from Groups H, A and B, respectively.
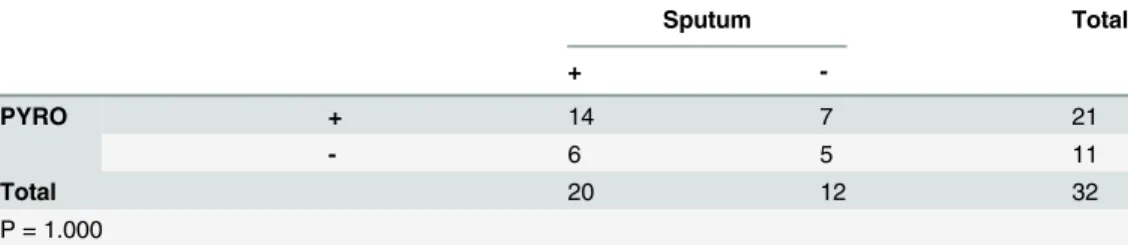
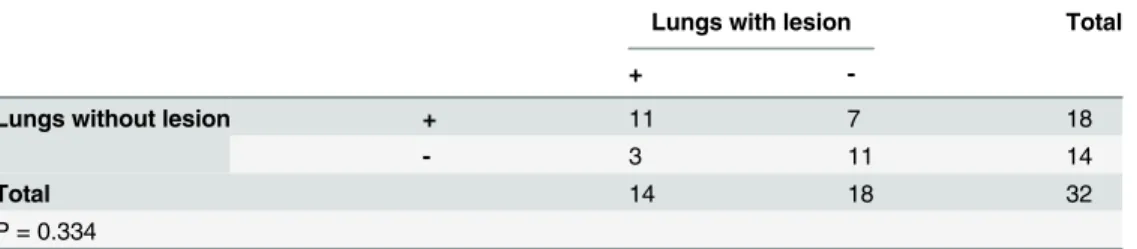
The rates of positive detection ofMycobacteriawere also evaluated using this statistical method. AsTable 4shows, a fourfold table chi-square test detected no significant differences in the positive rate between the clinical sputum stain method and pyrosequencing.Table 5 com-pares the positive rate of Group A to that of Group B and indicates that the probability of My-cobacteriadetection in both sides by pyrosequencing was quite similar.
Discussion
In this study, we showed that a method based on a barcoded primer and 454 pyrosequencing provided profiles of microbiota samples from TB patients and healthy individuals. Although al-veolar lavage fluid was the ideal carrier of representative information about the composition of the microbiota of patients’lungs, we confronted a problem that requires further discussion here.
Although the possibility of a sterile state in the normal lower respiratory tract (LRT) has been negated recently, it was still difficult to obtain PCR-enriched production of microbial DNA from the alveolar lavage fluid because of the low quantities of LRT-colonising bacteria [23]. When compared with the sequencing reads from sputum samples in our previous study, the number of reads from the lavage fluid was significantly lower in this study. For this reason, we inevitably encountered the issue of whether the low number of reads was representative for profiling the microbiota. A rarefaction curve and Shannon-Weaver index were generated to evaluate the ability of the detected amplicons to reflect bacterial diversity in samples.Fig 1 indi-cates that almost all of the curves representing the samples consisted of two components: sharp slopes that were featured first, followed by decreased slopes in the second component. The shape and detailed data of the curves proved that the amplicons obtained were representative of the microbial diversity in the samples.
Charlson et al. proved the topographical continuity of bacterial populations in the human respiratory tract, indicating that the microbiota in the upper respiratory tract (URT) were sig-nificantly different from those in the lower respiratory tract (LRT) in quantity, but not in com-position [23]. Therefore, we chose to use the secretions from the URT in healthy individuals as normal controls. According to our research, significant differences can be observed in the re-spiratory tract microbiota of healthy people when compared with TB patients.Fig 2shows the phylogenetic relationship between the microbiota features of Groups H, A and B.Fig 2Ashows that the green dots (Group H) and the blue/red dots (Groups A and B) were clearly located in different quadrants, indicating that the microbiota changed dramatically in TB patients. The distribution tendencies of these dots are also quite different. The green dots tended to cluster in a relatively small area; in contrast, dots representing Groups A and B had a relatively scattered clustering and were difficult to clearly separate, despite representing different microbiota ori-gins. AsFig 2Bshows, the microbiota from Group H concentrated under the same sub-branch and had a long phylogenic distance from Groups A and B.
These data suggest that healthy people had highly homogenous bacterial flora, while TB pa-tients had a significantly altered bacterial community and a disappearance of any similarity. We interpreted the lack of homology as follows: from classical knowledge of TB pathology, My-cobacteriainvasion is an important factor in injuring the mucosal barrier in the LRT, facilitat-ing the colonisation of bacteria from the URT or foreign environments [24]. Our colleagues Cui et al. have found that many rare, unique bacteria exist in the microbiota of sputum from
Fig 3. Hierarchical clustering heatmap of the microbiota of samples.Bacterial family names are listed on the right side of the heatmap, and the sample names are listed on the top. Dendrograms at the top and left of the map indicate the phylogenetic relationship between the samples and families; the intensity of the cells’colour represents the abundance of the amplicons belonging to each family and sample.
TB patients compared with that of healthy individuals, indicating its important role in creating the diversity in TB microbiota [25].
Fig 3shows a hierarchical clustering heatmap that provides a visible pattern of the differ-ences in microbiota. The abundance of each bacterial family in each patient is expressed by the colour ladder. The microbiota from Group H clustered in the right region of the figure, and their distribution differed significantly from that of the left region. The underlying reason for these differences was revealed when the data were analysed at the genera level.
Table 2shows the top 30 genera with the highest abundance in Groups H and A/B. Strepto-coccuswas the dominant genus in the bacterial community of healthy people; however, in the TB patients, the dominant genus wasCupriavidus. The percentage ofStreptococcusdecreased significantly in TB patients. According to previous knowledge,Cupriavidusseldom results in primary pulmonary infections in populations with normal immune function; however, it can cause secondary infections in patients with immune-compromising conditions, such as post-transplantation status, aplastic anaemia or cystic fibrosis [26,27,28]. As a chronic consuming
Table 2. Top 30 genera in both lungs in TB patients and in healthy people.
R Health lung without lesion lung with lesion
Genera Mean(%) Genera Mean (%) Genera Mean (%)
1 Streptococcus 21.67 Cupriavidus 5.13 Cupriavidus 4.59
2 Prevotella 10.11 Prevotella 4.24 Prevotella 4.50
3 Haemophilus 4.00 Acinetobacter 3.03 Acinetobacter 3.67
4 Veillonella 3.62 Streptococcus 3.00 Streptococcus 3.29
5 Fusobacterium 3.39 Staphylococcus 2.81 Fusobacterium 2.84
6 Capnocytophaga 3.24 Fusobacterium 2.64 Rummeliibacillus 1.57
7 Granulicatella 3.14 Pseudomonas 1.87 Flavobacterium 1.55
8 Gemella 2.81 Flavobacterium 1.58 Pseudomonas 1.55
9 Neisseria 1.78 Veillonella 1.47 Veillonella 1.51
10 Leptotrichia 1.75 Rothia 1.44 Staphylococcus 1.28
11 Actinomyces 1.47 Rummeliibacillus 1.33 Mycobacterium 1.05
12 Rothia 1.04 Comamonas 0.98 Actinomyces 0.97
13 Aggregatibacter 0.87 Actinomyces 0.85 Comamonas 0.85
14 Campylobacter 0.80 Sphingomonas 0.79 Lactobacillus 0.85
15 Porphyromonas 0.72 Brevibacillus 0.72 Escherichia/Shigella 0.81
16 Selenomonas 0.72 Granulicatella 0.69 Methylobacterium 0.78
17 Peptostreptococcus 0.66 Escherichia/Shigella 0.61 Granulicatella 0.63
18 Parvimonas 0.54 Deinococcus 0.47 Rothia 0.58
19 Treponema 0.49 Bosea 0.45 Sphingomonas 0.46
20 Cardiobacterium 0.18 Thermus 0.45 Brevibacillus 0.44
21 Atopobium 0.18 Mycobacterium 0.42 Neisseria 0.34
22 Tannerella 0.06 Corynebacterium 0.41 Capnocytophaga 0.34
23 Mycoplasma 0.06 Haemophilus 0.34 Haemophilus 0.32
24 Peptococcus 0.04 Gemella 0.33 Leptotrichia 0.30
25 Kingella 0.04 Propionibacterium 0.30 Gemella 0.29
26 Oribacterium 0.04 Solobacterium 0.30 Deinococcus 0.27
27 Dialister 0.04 Neisseria 0.30 Corynebacterium 0.27
28 Megasphaera 0.03 Pelomonas 0.26 Propionibacterium 0.27
29 Mogibacterium 0.03 Capnocytophaga 0.24 Pelomonas 0.25
30 Corynebacterium 0.02 Thauera 0.23 Porphyromonas 0.22
Table 3. Paired Wilcoxon signed rank test comparison of the abundences between the genera in TB patients’lungs with lesions and lungs without lesions.
Genera Z Asymp. Sig. (2-tailed)
Mycobacterium -2.321 0.020
Porphyromonas -2.240 0.025
Azospirillum -1.826 0.068
Bosea -1.820 0.069
Thermus -1.789 0.074
Rothia -1.714 0.086
Sphingomonas -1.613 0.107
Aquabacterium -1.604 0.109
Methylophilus -1.604 0.109
Parvimonas -1.604 0.109
Sphingobacterium -1.604 0.109
Lactobacillus -1.572 0.116
Turicibacter -1.483 0.138
Weissella -1.483 0.138
Eubacterium -1.461 0.144
Hyphomicrobium -1.461 0.144
Stenotrophomonas -1.461 0.144
Delftia -1.376 0.169
Aggregatibacter -1.342 0.180
Anaerococcus -1.342 0.180
Cloacibacterium -1.342 0.180
Erysipelotrichaceae_incertae_sedis -1.342 0.180
GpI -1.342 0.180
Mesorhizobium -1.342 0.180
Novosphingobium -1.342 0.180
Serratia -1.342 0.180
Shuttleworthia -1.342 0.180
Thauera -1.342 0.180
Methylobacterium -1.334 0.182
Propionibacterium -1.303 0.192
Anoxybacillus -1.214 0.225
Dyadobacter -1.183 0.237
Acidovorax -1.153 0.249
Streptophyta -1.153 0.249
Staphylococcus -1.130 0.258
Acinetobacter -1.121 0.262
Exiguobacterium -1.120 0.263
Pseudoxanthomonas -1.095 0.273
Roseomonas -1.095 0.273
Pseudomonas -1.093 0.274
SR1_genera_incertae_sedis -1.070 0.285
Bulleidia -1.069 0.285
Mycoplasma -1.069 0.285
Leptotrichia -1.067 0.286
Capnocytophaga -1.022 0.307
Granulicatella -1.003 0.316
Table 3. (Continued)
Genera Z Asymp. Sig. (2-tailed)
Aeribacillus -1.000 0.317
Aeromicrobium -1.000 0.317
Alkaliphilus -1.000 0.317
Alloscardovia -1.000 0.317
Arcobacter -1.000 0.317
Atopococcus -1.000 0.317
Cardiobacterium -1.000 0.317
Catonella -1.000 0.317
Desulfomicrobium -1.000 0.317
Devosia -1.000 0.317
Epilithonimonas -1.000 0.317
Gordonia -1.000 0.317
Gp4 -1.000 0.317
Hydrogenophilus -1.000 0.317
Hymenobacter -1.000 0.317
Kingella -1.000 0.317
Klebsiella -1.000 0.317
Limnobacter -1.000 0.317
Luteibacter -1.000 0.317
Marmoricola -1.000 0.317
Meiothermus -1.000 0.317
Methyloversatilis -1.000 0.317
Moraxella -1.000 0.317
Murdochiella -1.000 0.317
Nesterenkonia -1.000 0.317
Nubsella -1.000 0.317
Oxalicibacterium -1.000 0.317
Peptostreptococcaceae_incertae_sedis -1.000 0.317
Peredibacter -1.000 0.317
Pontibacillus -1.000 0.317
Psychrobacter -1.000 0.317
Tsukamurella -1.000 0.317
Yaniella -1.000 0.317
Clostridium XlVa -0.978 0.328
Atopostipes -0.968 0.333
Brevibacillus -0.931 0.352
Lactococcus -0.921 0.357
Streptococcus -0.901 0.367
Haemophilus -0.876 0.381
Enhydrobacter -0.784 0.433
Deinococcus -0.776 0.438
Acetobacter -0.734 0.463
Erythrobacter -0.734 0.463
Dialister -0.730 0.465
Paracoccus -0.730 0.465
Rhizobium -0.730 0.465
Selenomonas -0.730 0.465
Table 3. (Continued)
Genera Z Asymp. Sig. (2-tailed)
TM7_genera_incertae_sedis -0.684 0.494
Scardovia -0.674 0.500
Phenylobacterium -0.663 0.508
Ralstonia -0.652 0.515
Cupriavidus -0.636 0.525
Bifidobacterium -0.535 0.593
Brevundimonas -0.535 0.593
Finegoldia -0.535 0.593
Massilia -0.535 0.593
Raoultella -0.535 0.593
Actinomyces -0.495 0.620
Treponema -0.459 0.646
Anaeroglobus -0.447 0.655
Mobiluncus -0.447 0.655
Niabella -0.447 0.655
Novispirillum -0.447 0.655
Parasegetibacter -0.447 0.655
Roseburia -0.447 0.655
Sphingopyxis -0.447 0.655
Zoogloea -0.447 0.655
Veillonella -0.433 0.665
Peptostreptococcus -0.420 0.674
Enterococcus -0.365 0.715
Jeotgalicoccus -0.365 0.715
Chryseobacterium -0.356 0.722
Campylobacter -0.345 0.730
Prevotella -0.299 0.765
Flavobacterium -0.296 0.767
Escherichia/Shigella -0.274 0.784
Gemella -0.267 0.790
Megasphaera -0.255 0.799
Neisseria -0.245 0.807
Pelomonas -0.226 0.821
Fusobacterium -0.216 0.829
Solobacterium -0.196 0.845
Rummeliibacillus -0.196 0.845
Corynebacterium -0.178 0.859
Comamonas -0.175 0.861
Nocardioides -0.169 0.866
Bacillus -0.157 0.875
Alcanivorax -0.135 0.893
Pedobacter -0.135 0.893
Pedomicrobium -0.135 0.893
Aeromonas -0.105 0.917
Atopobium -0.105 0.917
Bradyrhizobium 0.000 1.000
Mogibacterium 0.000 1.000
disease, TB not only reduces systemic immunity but also damages the local physical barrier of the LRT; all of these factors contribute to colonisation byCupriavidus. The bacterial flora from the LRT in TB patients was characterised by a high abundance ofCupriaviduscompared with the characteristicStreptococcusfound in healthy controls; this is the main reason why signifi-cant changes appeared in the microbiota of patients’LRT.Cupriaviduswas not found in healthy samples; as a result, we hypothesise that this genus is an important foreign infectious agent in TB patients.
Results from the pyrosequencing of patients found amplicons from more than 120 bacterial genera in alveolar lavage samples from both lungs. Comparisons of the microbiota from both lungs of each patient could clarify the change in the percentage of each genus in both sides.
Table 3shows the statistic calculations by Wilcoxon signed-rank tests to compare the abun-dance of each detected bacterial genera between Groups A and B. Other thanMycobacteria
(P = 0.02) andPorphyromonas(P = 0.025), no genera showed statistically significant differ-ences in abundance between the two sides (P>0.05).Table 5compares the rate ofMycobacteria
positive tests on both sides; there were no significant differences. These two tables suggest that despite wide distribution ofMycobacteriaandPorphyromonasin both sides, the abundance in lesion-forming areas was much higher than in non-lesion forming areas. Thus, we hypothesise that these two genera were important lesion-forming factors.Mycobacteriaare unquestionably the primary pathogens in TB and a main factor that stimulates macrophages to form lesions; however, we also considerPorphyromonasan important co-factor in lesion formation because of its high intra-lesion abundance. More research is needed to discover the underlying patho-genic mechanisms ofPorphyromonas.
Last but not the least, the method that we used had its limit in identifying the amplicons’ be-longings. The length of 16s rDNA V3 region amplicons were about 200–220 bp in length and by using the classification tool named RDP (Ribosomal Database Project), the amplicons could be precisely classified from phyla until genera level [21]. On the species level, the 200 bp ampli-cons could not be confirmed which species they belong to because the DNA chains were too short to provide enough information for identification. So, in our article, the change or the dif-ferences of microbiota were discussed on the genera level and the further researches are needed to disclose the details in the levels under the bacterial genera.
Table 3. (Continued)
Genera Z Asymp. Sig. (2-tailed)
Salmonella 0.000 1.000
Soonwooa 0.000 1.000
doi:10.1371/journal.pone.0124194.t003
Table 4. Comparison between sputum stain and PYRO for detecting mycobacteria.
Sputum Total
+
-PYRO + 14 7 21
- 6 5 11
Total 20 12 32
P = 1.000
Conclusions
In this study, we analysed the microbiota in lavage fluid to characterise the bacterial communi-ties in TB patients’LRT. Our results identified the following characteristics of TB microbiota. First, unlike the microbiota in healthy people, the dominant genus wasCupriavidusinstead of
Streptococcus, a main reason that the microbiota from TB patients differed from the healthy population. Second,Cupriaviduswas the most important agent resulting in secondary and op-portunistic infection in the context of TB. Finally, in addition toMycobacteria,Porphyromonas
may be a crucial agent because of its significantly increased proportion in lesions.
Supporting Information
S1 File. Scanning file of the pre-operation notification.This is the original manuscript in Chinese used in clinical work (in PDF format).
(PDF)
S2 File. Scanning file of the translated pre-operation notification made by authorized translator.This is the translated file in English (in PDF format).
(PDF)
Author Contributions
Conceived and designed the experiments: YZ XG XZ. Performed the experiments: YZ ZC CC. Analyzed the data: YZ ZC TS. Contributed reagents/materials/analysis tools: YZ FL ZC TS CC XZ CH XZ. Wrote the paper: YZ XG XZ. Provided clinical samples and great contributions to article: XZ.
References
1. Sato K, Nagai H, Kurashima A, Mori M, Katayama T. The present situation, treatment and prognosis of drug-resistant pulmonary tuberculosis. Cooperative Study Unit of Chemotherapy of Tuberculosis of the National Sanitoria in Japan. Kekkaku. 1995: 70: 585–589. PMID:8523851
2. Kanazawa M, Fujita A, Toyoda T, Takasugi T, Osumi M, Nishio K, et al. Clinical presentation of pulmo-nary tuberculosis associated with acquired immunodeficiency syndrome in metropolitan Tokyo. Intern Med. 1996: 35: 946–952. PMID:9030992
3. Tattevin P, Casalino E, Fleury L, Egmann G, Ruel M, Bouvet E. The validity of medical history, classic symptoms, and chest radiographs in predicting pulmonary tuberculosis: derivation of a pulmonary tu-berculosis prediction model. Chest. 1999: 115: 1248–1253. PMID:10334135
4. Yam WC, Siu KH. Rapid identification of mycobacteria and rapid detection of drug resistance in Myco-bacterium tuberculosis in cultured isolates and in respiratory specimens. Methods Mol Biol. 2013: 943: 171–199. doi:10.1007/978-1-60327-353-4_12PMID:23104290
5. Houben EN, Walburger A, Ferrari G, Nguyen L, Thompson CJ, Miess C, et al. Differential expression of a virulence factor in pathogenic and non-pathogenic mycobacteria. Mol Microbiol. 2009: 72: 41–52. doi: 10.1111/j.1365-2958.2009.06612.xPMID:19210624
Table 5. Compaison of the Mycobacteria detected between lungs with lesions and lungs without le-sions by PYRO.
Lungs with lesion Total
+
-Lungs without lesion + 11 7 18
- 3 11 14
Total 14 18 32
P = 0.334
6. Young D, Stark J, Kirschner D. Systems biology of persistent infection: tuberculosis as a case study. Nat Rev Microbiol. 2008: 6: 520–528. doi:10.1038/nrmicro1919PMID:18536727
7. Robinson CJ, Bohannan BJ, Young VB. From structure to function: the ecology of host-associated mi-crobial communities. Microbiol Mol Biol Rev. 2010: 74: 453–476. doi:10.1128/MMBR.00014-10PMID: 20805407
8. Blaser MJ, Falkow S. What are the consequences of the disappearing human microbiota? Nat Rev Microbiol. 2009: 7: 887–894. doi:10.1038/nrmicro2245PMID:19898491
9. Armougom F, Bittar F, Stremler N, Rolain JM, Robert C, Dubus JC, et al. Microbial diversity in the spu-tum of a cystic fibrosis patient studied with 16S rDNA pyrosequencing. Eur J Clin Microbiol Infect Dis. 2009: 28: 1151–1154. doi:10.1007/s10096-009-0749-xPMID:19449045
10. Nelson DE, Van Der Pol B, Dong Q, Revanna KV, Fan B, Easwaran S, et al. Characteristic male urine microbiomes associate with asymptomatic sexually transmitted infection. PLoS One. 2010: 5: e14116. doi:10.1371/journal.pone.0014116PMID:21124791
11. Wen L, Ley RE, Volchkov PY, Stranges PB, Avanesyan L, Stonebraker AC, et al. Innate immunity and intestinal microbiota in the development of Type 1 diabetes. Nature. 2008: 455: 1109–1113. doi:10. 1038/nature07336PMID:18806780
12. Zhou Y, Lin P, Li Q, Han L, Zheng H, Wei Y, et al. Analysis of the microbiota of sputum samples from pa-tients with lower respiratory tract infections. Acta Biochim Biophys Sin (Shanghai). 2010: 42: 754–761. doi:10.1093/abbs/gmq081PMID:20823075
13. Chen C, Shen T, Tian F, Lin P, Li Q, Cui Z, et al. New microbiota found in sputum from patients with community-acquired pneumonia. Acta Biochim Biophys Sin (Shanghai). 2013: 45: 1039–1048. doi:10. 1093/abbs/gmt116PMID:24140650
14. Mimoz O, Dahyot-Fizelier C. Mini-broncho-alveolar lavage: a simple and promising method for assess-ment of antibiotic concentration in epithelial lining fluid. Intensive Care Med. 2007: 33: 1495–1497. PMID:17594075
15. Goldberg AE, Malhotra AK, Riaz OJ, Aboutanos MB, Duane TM, Borchers CT, et al. Predictive value of broncho-alveolar lavage fluid Gram's stain in the diagnosis of ventilator-associated pneumonia: a pro-spective study. J Trauma. 2008: 65: 871–876; discussion 876–878. doi:10.1097/TA.
0b013e31818481e0PMID:18849805
16. Price LB, Liu CM, Melendez JH, Frankel YM, Engelthaler D, Aziz M, et al. Community analysis of chron-ic wound bacteria using 16S rRNA gene-based pyrosequencing: impact of diabetes and antibiotchron-ics on chronic wound microbiota. PLoS One. 2009: 4: e6462. doi:10.1371/journal.pone.0006462PMID: 19649281
17. Krimsky WS, Broussard JN, Sarkar SA, Harley DP. Bronchoscopic spray cryotherapy: assessment of safety and depth of airway injury. J Thorac Cardiovasc Surg. 2010: 139: 781–782. doi:10.1016/j.jtcvs. 2009.03.051PMID:19664781
18. Lee JH, Chung HS. Bronchoscopic, radiologic and pulmonary function evaluation of endobronchial tu-berculosis. Respirology. 2000: 5: 411–417. PMID:11192556
19. Xue Q, Wang N, Xue X, Wang J. Endobronchial tuberculosis: an overview. Eur J Clin Microbiol Infect Dis. 2011: 30: 1039–1044. doi:10.1007/s10096-011-1205-2PMID:21499709
20. Jeannin L. Pulmonary tuberculosis and primary-infection tuberculosis. Epidemiology, diagnosis, course, treatment, prevention. Rev Prat. 1997: 47: 97–106. PMID:9035551
21. Cole JR, Wang Q, Cardenas E, Fish J, Chai B, Farris RJ, et al. The Ribosomal Database Project: im-proved alignments and new tools for rRNA analysis. Nucleic Acids Res. 2009: 37: D141–145. doi:10. 1093/nar/gkn879PMID:19004872
22. Hamady M, Lozupone C, Knight R. Fast UniFrac: facilitating high-throughput phylogenetic analyses of microbial communities including analysis of pyrosequencing and PhyloChip data. ISME J. 2010: 4: 17– 27. doi:10.1038/ismej.2009.97PMID:19710709
23. Charlson ES, Bittinger K, Haas AR, Fitzgerald AS, Frank I, Yadav A, et al. Topographical continuity of bacterial populations in the healthy human respiratory tract. Am J Respir Crit Care Med. 2011: 184: 957–963. doi:10.1164/rccm.201104-0655OCPMID:21680950
24. Cruz Rde C, De Albuquerque Mde F, Campelo AR, Costa e Silva EJ, Mazza E, Menezes RC, et al. Pul-monary tuberculosis: association between extent of the residual pulPul-monary lesion and alteration in the lung function. Rev Assoc Med Bras. 2008: 54: 406–410. PMID:18989560
26. Kalka-Moll WM, LiPuma JJ, Accurso FJ, Plum G, van Koningsbruggen S, Vandamme P. Airway infec-tion with a novel Cupriavidus species in persons with cystic fibrosis. J Clin Microbiol. 2009: 47: 3026– 3028. doi:10.1128/JCM.00846-09PMID:19605576
27. Christensen JB, Vitko NP, Voskuil MI, Castillo-Mancilla JR. Implantable cardiac defibrillator pocket in-fection due to a previously undescribed Cupriavidus species. J Clin Microbiol. 2010: 48: 2623–2625. doi:10.1128/JCM.00507-10PMID:20427695