Analysis of Lymphocytic DNA Damage in
Early Multiple Sclerosis by Automated
Gamma-H2AX and 53BP1 Foci Detection: A
Case Control Study
Ludwig Rasche1,2,3, Lisa Heiserich4, Janina Ruth Behrens1,2, Klaus Lenz5,
Catherina Pfuhl1,2,3, Katharina Wakonig1,2, René Markus Gieß1,2,3, Erik Freitag1,2,
Caroline Eberle4, Jens Wuerfel1,6,7,8, Jan Dörr1,2, Peter Bauer4, Judith Bellmann-Strobl1,2,7,
Friedemann Paul1,2,3, Dirk Roggenbuck4,9‡, Klemens Ruprecht2,3‡ *
1NeuroCure Clinical Research Center, Charité - Universitätsmedizin Berlin, Berlin, Germany,2Clinical and Experimental Multiple Sclerosis Research Center, Charité - Universitätsmedizin Berlin, Berlin, Germany, 3Department of Neurology, Charité - Universitätsmedizin Berlin, Berlin, Germany,4Medipan GmbH, Berlin-Dahlewitz, Germany,5Department of Medical Biometrics and Clinical Epidemiology, Charité
-Universitätsmedizin Berlin, Berlin, Germany,6MIAC AG, Basel, Switzerland,7Experimental and Clinical Research Center, Charité - Universitätsmedizin Berlin and Max Delbrück Center for Molecular Medicine, Berlin-Buch, Germany,8Institute of Neuroradiology, Universitätsmedizin Göttingen, Göttingen, Germany, 9Faculty of Science, Brandenburg University of Technology Cottbus - Senftenberg, Senftenberg, Germany
‡These authors are joint senior authors on this work. *[email protected]
Abstract
Background
In response to DNA double-strand breaks, the histone protein H2AX becomes phosphory-lated at its C-terminal serine 139 residue, referred to asγ-H2AX. Formation ofγ-H2AX foci
is associated with recruitment of p53-binding protein 1 (53BP1), a regulator of the cellular response to DNA double-strand breaks.γ-H2AX expression in peripheral blood
mononu-clear cells (PBMCs) was recently proposed as a diagnostic and disease activity marker for multiple sclerosis (MS).
Objective
To evaluate the significance ofγ-H2AX and 53BP1 foci in PBMCs as diagnostic and
dis-ease activity markers in patients with clinically isolated syndrome (CIS) and early relapsing-remitting MS (RRMS) using automatedγ-H2AX and 53BP1 foci detection.
Methods
Immunocytochemistry was performed on freshly isolated PBMCs of patients with CIS/early RRMS (n = 25) and healthy controls (n = 27) withγ-H2AX and 53BP1 specific antibodies.
Nuclearγ-H2AX and 53BP1 foci were determined using a fully automated reading system,
assessing the numbers ofγ-H2AX and 53BP1 foci per total number of cells and the
OPEN ACCESS
Citation:Rasche L, Heiserich L, Behrens JR, Lenz K, Pfuhl C, Wakonig K, et al. (2016) Analysis of Lymphocytic DNA Damage in Early Multiple Sclerosis by Automated Gamma-H2AX and 53BP1 Foci Detection: A Case Control Study. PLoS ONE 11(1): e0147968. doi:10.1371/journal.pone.0147968
Editor:Markus Reindl, Medical University of Innsbruck, AUSTRIA
Received:July 1, 2015
Accepted:January 11, 2016
Published:January 28, 2016
Copyright:© 2016 Rasche et al. This is an open access article distributed under the terms of the Creative Commons Attribution License, which permits unrestricted use, distribution, and reproduction in any medium, provided the original author and source are credited.
Data Availability Statement:All relevant data are within the paper and its supporting Information files.
percentage of cells with foci. Patients underwent contrast enhanced 3 Tesla magnetic reso-nance imaging (MRI) and clinical examination including expanded disability status scale (EDSS) score.γ-H2AX and 53BP1 were also compared in previously frozen PBMCs of
each 10 CIS/early RRMS patients with and without contrast enhancing lesions (CEL) and 10 healthy controls.
Results
The median (range) number ofγ-H2AX (0.04 [0–0.5]) and 53BP1 (0.005 [0–0.2]) foci per
cell in freshly isolated PBMCs across all study participants was low and similar to previously reported values of healthy individuals. For both,γ-H2AX and 53BP1, the cellular focus
num-ber as well as the percentage of positive cells did not differ between patients with CIS/ RRMS and healthy controls.γ-H2AX and 53BP1 levels neither correlated with number nor
volume of T2-weighted lesions on MRI, nor with the EDSS. Althoughγ-H2AX, but not
53BP1, levels were higher in previously frozen PBMCs of patients with than without CEL,γ
-H2AX values of both groups overlapped andγ-H2AX did not correlate with the number or
volume of CEL.
Conclusion
γ-H2AX and 53BP1 foci do not seem to be promising diagnostic or disease activity
biomark-ers in patients with early MS. Lymphocytic DNA double-strand breaks are unlikely to play a major role in the pathophysiology of MS.
Introduction
Multiple sclerosis (MS) is a chronic inflammatory demyelinating and neurodegenerative dis-ease of the central nervous system and the leading cause for permanent neurological disability in young adults [1]. The diagnosis of MS can be challenging, in particular in the early phase of the disease [2]http://www.ncbi.nlm.nih.gov/pubmed/18805839. Furthermore, only a propor-tion of MS lesions seen on convenpropor-tional magnetic resonance imaging (MRI) is associated with overt clinical symptoms, complicating clinical assessment of disease activity [3,4]. Finally, the course of MS is highly variable as is the response to immunomodulatory therapies [5]. Thus, there is an immanent need for reliable diagnostic, disease activity, prognostic, and therapy response markers in patients with MS [6]. Numerous blood-based biomarkers have therefore been evaluated in MS, though very few have entered clinical practice [7]
In response to DNA double-strand breaks the histone protein H2AX becomes phosphory-lated at its serine 139 residue in the vicinity of the DNA break site [8]. The thus phosphorylated H2AX is termedγ-H2AX and plays a central role in the cellular DNA double-strand break
response pathway by providing a platform for the recruitment of other DNA damage response and repair factors [9,10]. Among those, one key element is p53-binding protein 1 (53BP1), which, much likeγ-H2AX, accumulates in discrete nuclear foci at DNA double-strand break
sites and has important regulatory functions for the cellular response to DNA double-strand breaks [11,12]. Nuclearγ-H2AX and 53BP1 foci can be visualized in isolated peripheral blood
mononuclear cells (PBMCs) by immunofluorescence microscopy. Indeed, digital fluorescence microscopy employing novel pattern recognition algorithms has recently been established for analysis, decision to publish, and preparation of the
manuscript.
Competing Interests:LR has received a travel grant from Bayer Healthcare unrelated to this study; LH is an employee of Medipan GmbH; JRB received travel support by Biogen Idec and Novartis; KL has nothing to disclose; CP has nothing to disclose; KW has nothing to disclose; RMG has received financial support from Novartis for travel and congress attendance; EF has nothing to disclose; CE is an employee of Medipan GmbH; JW is CEO of MIAC AG, Basel, Schweiz, he serves for Novartis and Biogen advisory boards, and has received speaker honoraria by Bayer, Biogen, Genzyme, Novartis and Teva. He is supported by the Bundesministerium für Wirtschaft (BMWi), the Deutsche
the automated analysis of DNA damage response foci, paving the way for a much needed stan-dardization in this field [13–16].
A recent pilot study suggestedγ-H2AX expression in PBMCs as a possible diagnostic as
well as disease activity marker for relapsing remitting MS (RRMS), as patients with RRMS exhibited higher levels ofγ-H2AX positive cells than healthy controls and levels ofγ-H2AX
positive cells were associated with MRI measures of disease activity in patients with RRMS [17]. Oxidative stress has been implicated in the pathogenesis of MS [18,19]. Because elevated levels of reactive oxygen species may cause DNA damage, a possible link between DNA damage markers in PBMCs and MS may be hypothesized [17].
To further scrutinize the possible association of lymphocytic DNA double-strand break markers and MS, we herein analyzed nuclearγ-H2AX and 53BP1 foci in freshly isolated
PBMCs from 25 patients with clinically isolated syndrome (CIS) or early RRMS and 27 healthy controls as well as in previously frozen PBMCs from 20 Patients with CIS or early RRMS and 10 healthy controls using fully automated immunofluorescence microscopy [14,15]. Moreover, we correlatedγ-H2AX and 53BP1 levels with MRI measures of disease activity.
Patients and Methods
Patients and healthy controls
The study was approved by the institutional review board of Charité–Universitätsmedizin
Ber-lin (EA1/182/10). All participants provided written informed consent.
PBMCs were freshly isolated from blood samples obtained by peripheral venipuncture from 25 patients with CIS or early RRMS and 27 age and sex matched healthy controls between March and July 2014. Additionally, previously frozen PBMC samples, obtained between April 2012 and July 2014, from each 10 age and sex matched patients with CIS/early RRMS with and without contrast enhancing lesions (CEL) and 10 age and sex matched healthy controls were included in the study. All patients were participating in an ongoing prospective observational study of patients with early MS (Berlin CIS Cohort; NCT01371071), which started recruitment in January 2011. Inclusion criteria were: age>18 years, a first clinical event suggestive of inflammatory demyelination (i.e. CIS) not meeting the McDonald 2010 criteria for RRMS [20] within six months before inclusion into the study or a diagnosis of RRMS according to the McDonald 2010 criteria within 24 months before inclusion into the study. Exclusion criteria were: a history of alcohol or drug abuse, any conditions precluding MRI examinations and any ocular diseases precluding optical coherence tomography. The patients investigated in the pres-ent analysis had not been treated with corticosteroids for at least two months prior to inclusion into the study. At the time of blood withdrawal, patients underwent a thorough neurological examination, including determination of the expanded disability status scale (EDSS) score.
PBMC isolation
(Biochrom GmbH, Berlin, Germany) and 1% Hepes (Gibco) and stored in liquid nitrogen. For thawing, aliquots were removed from liquid nitrogen and thawed at 37°C for 1 minute. Cells were quickly transferred into 10 ml of wash medium (5% fetal bovine serum, 1% Hepes and 94% RPMI-1640) at room temperature and washed two times at 300 g for 5 minutes before resuspension in PBS at a concentration of 1x10⁶cells/ml.
Microscope Slide preparation
PBMCs were transferred to 6 well Teflon coated microscope slides (Tekdon Inc., Myakka City, United States) at a concentration of 5x10⁴cells per well and incubated for 10 minutes at room temperature. Cells were subsequently fixed with 2% paraformaldehyde (Merck Chemicals GmbH, Schwalbach, Germany) for 15 minutes at room temperature. Slides were washed in PBS for 30 minutes and stored in dry conditions at 4°C until further processing.
Immunocytochemistry
Immunocytochemistry was performed following standard operating procedures at Medipan GmbH, Berlin-Dahlewitz, Germany. Fixed cells on the microscope slide were permeabilized with Triton X 100 (0.2% in 1% bovine serum albumin [BSA]/PBS) (BioUltra, Sigma-Aldrich Chemie GmbH, Taufkirchen, Germany) for five minutes at 4°C and subsequently washed three times in 1% BSA/PBS at room temperature. For co-immunostaining, slides were simulta-neously incubated with a mouse monoclonal IgG antibody specifically detecting H2AX phos-phorylated at serine 139 (Merck Millipore, Billerica, USA) and with anti-53BP1 rabbit
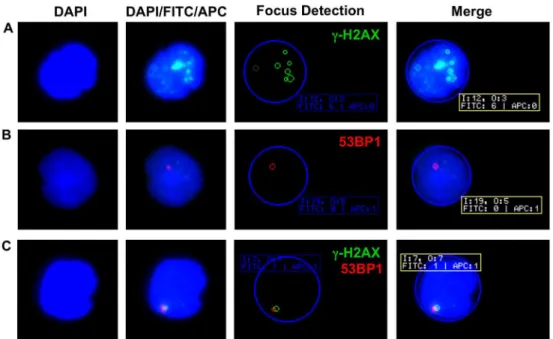
Fig 1. Examples ofγ-H2AX and 53BP1 foci in PBMCs.(A) Multiple nuclearγ-H2AX foci (green) are clearly discernible in a lymphocyte of a healthy control. (B) Single 53BP1 focus (red) in a lymphocyte nucleus of a patient with RRMS. (C) Colocalization of nuclearγ-H2AX and 53BP1 foci in a lymphocyte of a healthy control. In the automated focus detection, the blue circle represents the DAPI stained nucleus. Small green and red circles highlightγ-H2AX and 53BP1 foci as automatically detected by the AKLIDES1
reading system. The system assigns distinct image (I) and object (O) numbers and indicates the number of foci detected in each fluorescence channel (FITC or APC). Note the difference in highlighted (n = 7) and counted (n = 6)γ-H2AX foci in (A), which is explained by a weaker focus fluorescence intensity not meeting the preset definitions for scoring ofγ-H2AX foci.
polyclonal IgG (Novus Biologicals, Cambridge, United Kingdom) at a dilution of 1:200 in 1% BSA/PBS for one hour. After three further wash steps in PBS for ten minutes, secondary anti-bodies, Alexa Fluor 488 goat anti-mouse IgG (detected in the FITC channel; Invitrogen GmbH, Karlsruhe, Germany) and Alexa Fluor 647 goat anti-rabbit IgG H&L (detected in the APC channel; Invitrogen GmbH, Karlsruhe, Germany), were added simultaneously in a dilu-tion of 1:500 in 1% BSA/PBS for one hour at room temperature. Slides were washed again three times in PBS for ten minutes and mounted using a 4,6´-diamidino-2-phenylindole (DAPI) containing mounting medium (GA Generic Assays GmbH, Berlin-Dahlewitz, Ger-many) for DNA counterstaining.
Automated analysis of
γ
-H2AX and 53BP1 foci
Enumeration ofγ-H2AX and 53BP1 foci was carried out as previously described using the
automated AKLIDES1reading system (Medipan GmbH, Berlin-Dahlewitz, Germany) [14– 16]. The system uses a motorized inverse fluorescence microscope (Olympus IX81, Olympus, Hamburg, Germany) with a motorized scanning stage and is controlled by software using a set of mathematical algorithms to detect and evaluate immunofluorescence patterns. For each sample approximately 100 cells on each well were selected randomly for analysis. According to
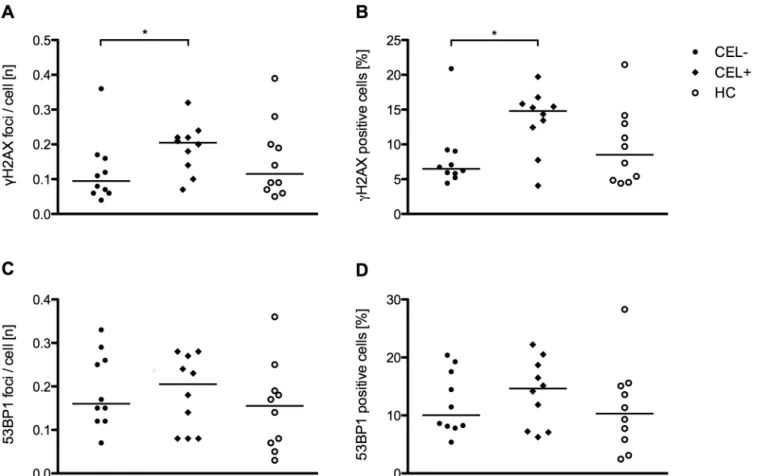
Fig 2.γ-H2AX and 53BP1 levels in freshly isolated PBMCs of patients and healthy controls.(A)γ-H2AX foci per cell in patients with CIS/early RRMS and healthy controls. (B) Percentage ofγ-H2AX positive cells in patients with CIS/early RRMS and healthy controls. (C) 53BP1 foci per cell in patients with CIS/early RRMS and healthy controls. (D) Percentage of 53BP1 positive cells in patients with CIS/early RRMS and healthy controls. Each data point represents the median of n = 6 separate measurements per individual. In each of the six separate measurements approximately n = 100 cells were scored. The horizontal bar indicates the median.
our presets, only convex nuclei with diameters between 2–15μm were evaluated. This way,
monocytes, granulocytes, heavily damaged cells, and cell aggregates were excluded. As outlined before, both cells with a high amount of induced DNA double-strand breaks as well as early apoptotic cells can show a pan-nuclear staining [21–23]. However,γ-H2AX foci analysis by the
automated interpretation system AKLIDES1cannot distinguish between these two instances. Thus, to avoid confounding of apoptotic cells and cells with a high amount of induced DNA double-strand breaks, cells with anγ-H2AX signal comprising70% of the DAPI signal were
excluded from the analysis [23]. The following exposure times were used for the different chan-nels: DAPI default exposure 24 ms, FITC default exposure 1000 ms, APC default exposure 1000 ms. Sub-nuclear foci had to meet the following requirements to be counted as such: mini-mum diameter 0.2μm, maximum diameter 1.2μm, minimum intensity 70 gray values on a 8 bit gray scale (0–255 with 0 being black) above background intensity. Results were expressed as
the quotient of theγ-H2AX or 53BP1 focus number divided by the total number of assessed
cells (cellular focus number) and as the percentage of cells carrying foci among all assessed cells (percentage of positive cells). The median values from separate measurements of six sepa-rate wells containing PBMCs from one individual were used for further statistical analysis. In setup experiments, PBMC samples were split and either processed immediately or after 2.5 and 4.5 hours. Compared to immediately processed cells, no significant time dependent change of
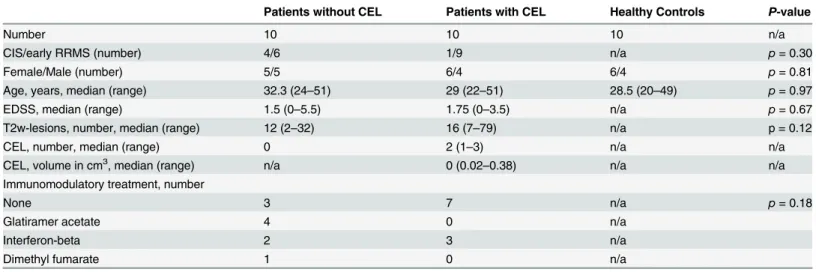
Fig 3.γ-H2AX and 53BP1 in frozen PBMCs of CIS/early RRMS patients with and without CEL and healthy controls.(A)γ-H2AX foci per cell in patients with CIS/early RRMS without CEL (CEL-; n = 10), with CEL (CEL+; n = 10) and healthy controls (HC; n = 10). (B) Percentage ofγ-H2AX positive cells in patients with CIS/early RRMS without CEL, with CEL and healthy controls. (C) 53BP1 foci per cell in patients with CIS/early RRMS without CEL, with CEL and healthy controls. (D) Percentage of 53BP1 positive cells in patients with CIS/early RRMS without CEL, with CEL and healthy controls. The horizontal bar indicates the median.*p<0.05, Mann Whitney test.
γ-H2AX and 53BP1 foci could be observed 2.5 and 4.5 hours after blood withdrawal, arguing
against a possible confounding influence of time between blood withdrawal and PBMCs pro-cessing onγ-H2AX and 53BP1 expression (data not shown).
Magnetic resonance imaging
Three-dimensional whole brain MR data (1mm3) were acquired on a 3 Tesla (3T) whole-body MRI (Magnetom Trio with TIM, Siemens Healthcare AG, Erlangen, Germany), using a clinical routine 12-channel head coil. For T2-weighted imaging (T2w), a single slab three-dimensional T2w turbo-spin-echo (TSE) sequence with high sampling efficiency (SPACE) was selected (TE 388 ms, TR 6000 ms, flip angle 120°) as well as a three-dimensional fluid attenuated inversion recovery sequence (SPACE-FLAIR; TE 502 ms, TR 5000 ms, TI 2100 ms, flip angle 120°), fol-lowed by an axial two-dimensional double-echo proton density/T2w sequence (TE 14/87 ms, TR 3400 ms, flip angle 120°, voxel resolution 1 x 1 x 3 mm3, no gap). Contrast enhanced images were acquired by a volumetric interpolated brain examination sequence optimized for short acquisition time with asymmetric k-space sampling and interpolation (VIBE; 1mm3, TE 2.2 ms, TR 4.85 ms, flip 9°) 8 min after weight adjusted 0.1 mM Gadubutrol (Bayer Vital GmbH, Leverkusen, Ger-many) injection. T2w lesions as well as CEL were counted. T2w as well as CEL lesion volume was calculated using the OsiriX software toolbox (OsiriX foundation, Geneva, Switzerland) and in-house applications. Experienced MRI raters were blinded to the results of any laboratory studies.
Statistics
Significance of different frequencies was assessed by 2 × 2 or 2 × 3 Fisher´s exact test. Signifi-cance of differences inγ-H2AX and 53BP1 cellular focus numbers and percentage of positive
cells was assessed by Mann Whitney test. Three-group comparisons were performed by Krus-kall-Wallis test. Correlation analysis between DNA damage parameters, clinical data, and MRI parameters was carried out by Spearman correlation. All statistical tests were performed with GraphPad Prism Version 5.0d.P-values<0.05 were considered significant.
Results
Participants
Demographics, clinical and MRI data, as well as immunomodulatory treatments of the 25 patients with CIS (n = 12) or RRMS (n = 13) and the 27 healthy controls of which freshly iso-lated PBMC were analyzed in this study are summarized inTable 1. The sex (p= 0.36) and age distribution (p= 0.93) did not differ between the groups of patients and healthy controls.
Levels of
γ
H2AX and 53BP1 in freshly isolated PBMCs do not differ in
patients with CIS/early RRMS and healthy controls
To compare the numbers of lymphocyticγ-H2AX and 53BP1 foci in freshly isolated PBMCs
from patients with CIS/early RRMS and healthy controls, we used a previously established immunocytochemical staining technique combined with an automated reading system [14,15]. With this methodology,γ-H2AX and 53BP1 foci could be visualized as clearly discernible
intranuclear dots, examples of which, as well as of the automated detection ofγ-H2AX and
53BP1 foci, are shown inFig 1.
Intranuclearγ-H2AX foci were detectable in PBMCs of 23 out of 25 (92%) patients with
CIS/early RRMS and 26 out of 27 (96%) healthy controls (p= 0.6). While 53BP1 foci were over-all less frequently detectable thanγ-H2AX foci, the detection frequency of 53BP1 foci did
median (range) number ofγ-H2AX foci per cell across all study subjects was low (0.04 [0–
0.49]), as was the median frequency of 53BP1 foci per cell across all study subjects (0.005 [0–
0.21]). The median (range) percentage of positive cells across all study subjects forγ-H2AX
was 4.02% (0–44.57) and for 53BP1 0.46% (0–15.79). Taken all study subjects together, there
was a strong correlation ofγ-H2AX and 53BP1 foci numbers per cell (r = 0.60;p<0.0001) as well as of the percentage ofγ-H2AX and 53BP1 positive cells (r = 0.62;p<0.0001).
The number ofγ-H2AX foci per cell did not differ (p= 0.49) between patients with CIS/ early RRMS and healthy controls (Fig 2A). Likewise, the percentage of cells positive forγ
-H2AX did not differ between patients and healthy controls (p= 0.49) (Fig 2B). Similarly, there was no significant difference of 53BP1 focus numbers (p= 0.18) and of the percentage of 53BP1 positive cells between patients and healthy controls (p= 0.17) (Fig 2C and 2D). Further-more,γ-H2AX focus numbers (p= 0.11) and the percentage ofγ-H2AX positive cells
(p= 0.12) were not different in patients with CIS compared to patients with early RRMS. A comparison of patients treated with immunomodulatory therapies (n = 10) and untreated patients (n = 15) revealed no significant difference ofγ-H2AX focus numbers per cell or the
percentage ofγ-H2AX positive cells (p= 0.11 for both) and no significant difference for 53BP1
focus numbers per cell or the percentage of positive cells (p= 0.17 for both). Likewise, a sub-group analysis of smokers (n = 7) and non-smokers (n = 18) within the sub-group of patients showed no significant difference ofγ-H2AX focus numbers per cell (p= 0.62) or of the percent-age ofγ-H2AX positive cells (p= 0.54) and no significant difference of 53BP1 focus numbers
per cell (p= 0.88) or of the percentage of 53BP1 positive cells (p= 0.92). Finally, neither in the groups of patients nor of healthy controls was there a correlation of age andγ-H2AX or 53BP1
focus numbers per cell or of the percentage ofγ-H2AX or 53BP1 positive cells.
Levels of
γ
-H2AX and 53BP1 in freshly isolated PBMCs do not appear to
be promising disease activity markers in patients with CIS/early RRMS
We next asked whether levels ofγ-H2AX and 53BP1 in freshly isolated PBMCs from patients
with CIS/early RRMS might be associated with radiological or clinical measures of MS. We
Table 1. Demographic and clinical data of patients and healthy controls of which freshly isolated PBMCs were analyzed in this study.
Patients Healthy Controls P-value
Number 25 27 n/a
CIS/early RRMS (number) 12/13 n/a n/a
Female/Male (number) 16/9 21/6 p= 0.36
Age, years, median (range) 33 (21–52) 29 (20–56) p= 0.93
EDSS, median (range) 1.5 (0–5.5) n/a n/a
T2w-lesions, number, median (range) 5 (0–107) n/a n/a
CEL, number, median (range) 0 (0–1) n/a n/a
Immunomodulatory treatment, number
None 15 n/a n/a
Glatiramer acetate 5 n/a n/a
Interferon-beta 3 n/a n/a
Dimethyl fumarate 1 n/a n/a
Fingolimod 1 n/a n/a
CIS = clinically isolated syndrome, RRMS = relapsing remitting multiple sclerosis, EDSS = expanded disability status scale, T2w = T2 weighted, CEL = contrast enhancing lesions, n/a = not applicable
therefore correlated the number and volume of T2w lesions as well as the number and volume of CEL on MRI performed at the time of blood withdrawal with levels ofγ-H2AX and 53BP1.
In the vast majority of patients (23/25) MRI was performed on the day of blood withdrawal. The delay between blood withdrawal and MRI in the remaining 2 patients was 5 and 6 days.γ
-H2AX focus numbers per cell and the percentage ofγ-H2AX positive cells did not correlate
with T2w lesion load (r = 0.15;p= 0.49 and r = 0.13;p= 0.54) or T2w lesion volume (r = 0.14;
p= 0.45 and r = 0.13;p= 0.50). Likewise, 53BP1 focus numbers per cell and the percentage of 53BP1 positive cells did not correlate with T2w lesion load (r = 0.30;p= 0.13 and r = 0.33;
p= 0.13) and T2w lesion volume (r = 0.33;p= 0.08 and r = 0.38;p= 0.05). Only two patients had each one CEL. Although one of these patients had relatively highγ-H2AX (0.46 foci/cell;
41.9% positive cells) and 53BP1 levels (0.20 foci/cell; 15.8% positive cells), the other patient had lowγ-H2AX (0.04 foci/cell; 3% positive cells) and 53BP1 levels (0.005 foci/cell, 0.5%
posi-tive cells). Clinical disability as measured by the EDSS did not correlate withγ-H2AX focus
numbers per cell (r = 0.20,p= 0.32) or percentage ofγ-H2AX positive cells (r = 0.20,p= 0.33). Likewise, there was no correlation of the EDSS and 53BP1 focus numbers per cell (r = 0.31; p = 0.12) or the percentage of 53BP1 positive cells (r = 0.30;p= 0.14).
As seen inFig 2A, there were three individuals among the patient group with relatively high
γ-H2AX foci numbers per cell. A detailed analysis of these three outliers showed no major
common characteristics. One of these patients (age: 33 years, sex: female, EDSS: 1.5) showed a high T2w lesion count (n = 107), one CEL and was treated with fingolimod. One patient (age: 44 years, sex: male, EDSS: 5.5) had a moderate T2w lesion load (n = 13), no CEL, and was treated with glatiramer acetate. The third patient (age: 35, sex: male, EDSS: 0) had one T2w lesion without corresponding contrast enhancement and did not receive any immunomodula-tory therapy.
Analysis of
γ
-H2AX and 53BP1 in frozen PBMCs from patients with CIS/
early RRMS with and without CEL and healthy controls
Because of the small number of freshly isolated PBMC samples from patients with CIS/early RRMS with CEL, we aimed to increase the number of patients with CEL. As for logistic reasons we were unable to obtain fresh PBMCs from a higher number of patients with CEL, we used previously frozen PBMCs for this part of our study. Thus, we additionally determined gamma-H2AX or 53BP1 foci in frozen PBMCs of 10 patients with CIS/early RRMS with CEL, 10 patients with CIS/early RRMS without CEL and 10 healthy controls. Demographics, clinical and MRI findings of these patients and controls are summarized inTable 2.
In the majority of patients (18/20) MRI was performed on the day of blood withdrawal. The delay between blood withdrawal and MRI in the remaining 2 patients was 5 and 14 days. Patients with CEL had higher numbers ofγ-H2AX foci per cell than patients without CEL
(p= 0.03) and patients with CEL had a higher percentage ofγ-H2AX positive cells (p= 0.03)
than patients without CEL (Fig 3A and 3B). However, theγ-H2AX focus number per cell
(p= 0.2) and the percentage ofγ-H2AX positive cells (p= 0.63) did not differ between patients
with CEL and healthy controls. Furthermore, a three-group comparison of patients with CEL, patients without CEL and healthy controls by Kruskal-Wallis test demonstrated no significant differences between the three groups in the number ofγ-H2AX foci per cell (p= 0.09) as well
as the percentage ofγ-H2AX positive cells (p= 0.06). Neither the number ofγ-H2AX foci per
cell (r = 0.31;p= 0.39) nor the percentage ofγ-H2AX positive cells (r = 0.15;p= 0.68)
corre-lated with the number of CEL. Similarly, neither the number ofγ-H2AX foci per cell (r = 0.16;
p= 0.66) nor the percentage ofγ-H2AX positive cells (r = 0.16;p= 0.66) correlated with the
Neither the number of 53BP1 foci per cell (p= 0.91) nor the percentage of 53BP1 positive cells (p= 0.63) differed between patients with and without CEL (Fig 3C and 3D). Likewise, Kruskal-Wallis tests showed no significant differences of the number of 53BP1 foci per cell (p= 0.52) as well as the percentage of 53BP1 positive cells (p= 0.49) between patients with CEL, patients without CEL and healthy controls.
Discussion
In this study, we analyzed the significance ofγ-H2AX and 53BP1 foci in nuclei of PBMCs as
potential diagnostic and disease activity markers for CIS/early RRMS using immunocytochem-istry combined with fully automated immunofluorescence microscopy. The key findings of this work are an absence of any significant differences ofγ-H2AX and 53BP1 foci levels between
patients and healthy controls and no correlation ofγ-H2AX and 53BP1 levels with MRI
mea-sures of MS and the EDSS in patients with CIS/early RRMS.
The median levels ofγ-H2AX observed in our study, expressed as number of foci per cell
(0.04), were similar to previously reported levels ofγ-H2AX foci per cell in healthy subjects
(0.05–0.1 foci/cell, see Valdiglesias et al. for review) [24,25]. Our data therefore confirm that
there is a low background rate of DNA damage foci in isolated human PBMCs. Low levels of lymphocytic DNA damage foci and underlying DNA double-strand breaks may thus represent a physiological phenomenon, which likely has no harmful consequences as it is counteracted by DNA damage repair mechanisms [26]. As expected, lymphocyticγ-H2AX and 53BP1 foci
were strongly correlated, consistent with the concept that generation ofγ-H2AX foci in
response to DNA double-strand breaks provides a platform for the recruitment of further DNA damage response proteins [10]. However,γ-H2AX and 53BP1 foci did not always
coloca-lize (seeFig 1B), suggesting thatγ-H2AX might not be a necessary prerequisite for recruitment
of 53BP1 or that expression of 53BP1 exceeds the duration ofγ-H2AX expression.
The absence of any significant differences ofγ-H2AX or 53BP1 foci between patients with
CIS/early RRMS and healthy controls suggests that lymphocytic DNA double-strand breaks are not associated with CIS/early MS and, therefore, appear unlikely to play a major role in the pathophysiology of MS. Our data are in contrast to previous findings by Grecchi et al., who
Table 2. Demographic and clinical data of patients and healthy controls of which previously frozen PBMCs were analyzed in this study.
Patients without CEL Patients with CEL Healthy Controls P-value
Number 10 10 10 n/a
CIS/early RRMS (number) 4/6 1/9 n/a p= 0.30
Female/Male (number) 5/5 6/4 6/4 p= 0.81
Age, years, median (range) 32.3 (24–51) 29 (22–51) 28.5 (20–49) p= 0.97
EDSS, median (range) 1.5 (0–5.5) 1.75 (0–3.5) n/a p= 0.67
T2w-lesions, number, median (range) 12 (2–32) 16 (7–79) n/a p = 0.12
CEL, number, median (range) 0 2 (1–3) n/a n/a
CEL, volume in cm3, median (range) n/a 0 (0.02–0.38) n/a n/a
Immunomodulatory treatment, number
None 3 7 n/a p= 0.18
Glatiramer acetate 4 0 n/a
Interferon-beta 2 3 n/a
Dimethyl fumarate 1 0 n/a
CIS = clinically isolated syndrome, RRMS = relapsing remitting multiple sclerosis, EDSS = expanded disability status scale, T2w = T2 weighted, CEL = contrast enhancing lesions, n/a = not applicable
reported a significantly (p= 0.025) higher percentage ofγ-H2AX positive cells, as measured by
immunofluorescence microscopy and manual evaluation of 500 cells per individual, in 19 patients with RRMS compared to 13 healthy controls, though there was a considerable overlap between both groups [17]. Among the reasons for the disparate findings may be the larger sam-ple size of the current study as well as different patient characteristics with more patients in the earliest phase of MS in our work. Nevertheless, the similar EDSS values of the patients included in the two studies do not suggest major differences in clinical disability between the two patient populations. Although the study by Grecchi et al. included treatment naive patients only, the fact that some patients in our study were treated with immunomodulatory therapies does like-wise not seem to be a confounder, as we did not observe any differences ofγ-H2AX and 53BP1
in treated vs. untreated patients. The study by Grecchi et al. and our study used different meth-ods for the fixation of cells. However, as in each study the method of fixation was identical for patients and controls, it appears unlikely that different fixation methods may explain the differ-ent results of both studies. While in contrast to the study by Grecchi et al. few of our patidiffer-ents did not undergo blood withdrawal and MRI on the same day, we do not feel that the short delay between blood withdrawal and MRI in these few patients might have distorted our results. It should be noted that the percentages ofγ-H2AX positive cells reported by Grecchi
et al. are higher than previously reported in PBMCs of healthy controls [25,27,28] and that the immunocytochemical staining ofγ-H2AX positive cells shown in the work of Grecchi et al.
suggests that cells with a pan-nuclearγ-H2AX staining, possibly representing apoptotic cells,
were included in the analysis. Altogether, using a highly standardized and previously evaluated method for enumeration of discrete nuclearγ-H2AX foci, we could not observe an association
ofγ-H2AX foci with CIS/early RRMS, suggesting thatγ-H2AX foci in PBMCs do not seem to
be a promising diagnostic biomarker for CIS/early RRMS. Our results are consistent with the notion that MS patients have no generally increased risk of DNA-damage related diseases such as malignancies and, consequently, are unlikely to express elevated levels of DNA-damage related markers [29].
We found no correlation ofγ-H2AX or 53BP1 foci with the number or volume of T2w
lesions on cranial MRI, indicating thatγ-H2AX or 53BP1 foci are not associated with these
classical MRI markers of MS disease burden. Evaluation ofγ-H2AX or 53BP1 foci in freshly
isolated PBMCs with respect to CEL was limited by the fact that only two patients had CEL. Nevertheless, the very differentγ-H2AX and 53BP1 foci levels in these two patients do not
seem to suggest an association ofγ-H2AX and 53BP1 foci with CEL.
To further address a possible associationγ-H2AX and 53BP1 levels with CEL, we performed
an additional analysis using previously frozen PBMCs of 10 patients with CIS/early RRMS with CEL, 10 patients with CIS/early RRMS without CEL and 10 healthy controls. Although, remi-niscent of findings by Grecchi et al. [17], the number ofγ-H2AX foci per cells as well as the
percentage ofγ-H2AX positive cells were higher in patients with as compared to patients
with-out CEL, these data should be interpreted with great caution. Firstly, a two group comparison ofγ-H2AX levels between patients with CEL and healthy controls and a three group
compari-son ofγ-H2AX levels between patients with CEL, patients without CEL and healthy controls
revealed no significant differences. Secondly, correction for multiple testing, e.g. by the Bonfer-roni method, would abolish the statistical significance of the differences between patients with and without CEL. Thirdly, there was no correlation betweenγ-H2AX levels and the number or
volume of CEL. Fourthly, both the number ofγ-H2AX foci per cell and the percentage ofγ
-H2AX positive cells completely overlapped between the three groups, questioning the clinical applicability and meaningfulness ofγ-H2AX levels as a marker of disease activity. Altogether,
compared to patients without CEL, our findings do not seem to suggest thatγ-H2AX levels
may be a promising disease activity marker for CIS/early RRMS.
Strengths of our study are the use of a standardized automated scoring method, minimizing observer influence and allowing for large numbers of scored cells per individual. Indeed, our automated reading system may also be useful to analyze other potential biomarkers in PBMCs of patients with MS with distinct subcellular staining patterns. Among the limitations of this work is the sample size. In particular, the small number of freshly isolated PBMCs from indi-viduals with CEL precluded definitive conclusions on the association ofγ-H2AX and 53BP1
levels in freshly isolated PBMCs with CEL.
In conclusion, the present study suggests that nuclearγ-H2AX and 53BP1 foci in PBMCs
do not distinguish patients with CIS/early RRMS from healthy controls, arguing against a role of these parameters as diagnostic biomarkers for CIS/early MS. Furthermore,γ-H2AX and
53BP1 foci do not seem to be promising disease activity biomarkers in patients with CIS/early RRMS. Lymphocytic DNA double-strand breaks are thus unlikely to play a major role in the pathophysiology of MS.
Supporting Information
S1 Table. DNA damage parameters, demographic and clinical data of patients and healthy controls of which freshly isolated PBMCs were analyzed.Legend: EDSS: Expanded disability status scale; IMT: Immunomodulatory treatment; T2w: T2 weighted lesions; CEL: Contrast enhancing lesions; n/a: not applicable.
(XLSX)
S2 Table. DNA damage parameters, demographic and clinical data of patients and healthy controls of which previously frozen PBMCs were analyzed.Legend: CEL: Contrast enhanc-ing lesions; CEL-: CEL absent; CEL+: CEL present; EDSS: Expanded disability status scale; IMT: Immunomodulatory treatment; T2w: T2 weighted lesions; n/a: not applicable. (XLSX)
Acknowledgments
The authors like to thank all participants of this study as well as Bibiane Seeger, Susan Pikol and Cynthia Kraut for excellent technical assistance. FP, JW and KR are supported by the Ger-man Ministry of Education and Research (BMBF/KKNMS, Competence Network Multiple Sclerosis).
Author Contributions
Conceived and designed the experiments: DR KR PB LH LR. Performed the experiments: LR CE LH CP KW RMG EF JRB JBS. Analyzed the data: LR KL KR JW JRB JBS DR LH. Contrib-uted reagents/materials/analysis tools: DR KR FP JD JW. Wrote the paper: LR KR DR. Critical revision of the manuscript for important intellectual content: LH KL CP KW RMG EF CE JW JD PB JBS FP JRB.
References
1. Compston A, Coles A. Multiple sclerosis. The Lancet. 2008; 372: 1502–1517. doi: 10.1016/S0140-6736(08)61620-7
3. Traboulsee A. MRI relapses have significant pathologic and clinical implications in multiple sclerosis. J Neurol Sci. 2007; 256, Supplement 1: S19–S22. doi:10.1016/j.jns.2007.01.064
4. Sinnecker T, Mittelstaedt P, Dörr J, Pfueller CF, Harms L, Niendorf T, et al. Multiple sclerosis lesions and irreversible brain tissue damage: A comparative ultrahigh-field strength magnetic resonance imag-ing study. Arch Neurol. 2012; 69: 739–745. doi:10.1001/archneurol.2011.2450PMID:22351849 5. Dörr J, Paul F. The transition from first-line to second-line therapy in multiple sclerosis. Curr Treat
Options Neurol. 2015; 17: 354. doi:10.1007/s11940-015-0354-5PMID:25912246
6. Bielekova B, Martin R. Development of biomarkers in multiple sclerosis. Brain. 2004; 127: 1463–1478. doi:10.1093/brain/awh176PMID:15180926
7. Raphael I, Webb J, Stuve O, Haskins WE, Forsthuber TG. Body fluid biomarkers in multiple sclerosis: how far we have come and how they could affect the clinic now and in the future. Expert Rev Clin Immu-nol. 2015; 11: 69–91. doi:10.1586/1744666X.2015.991315PMID:25523168
8. Rogakou EP, Pilch DR, Orr AH, Ivanova VS, Bonner WM. DNA Double-stranded Breaks Induce His-tone H2AX Phosphorylation on Serine 139. J Biol Chem. 1998; 273: 5858–5868. doi:10.1074/jbc.273. 10.5858PMID:9488723
9. Kuo LJ, Yang L-X.γ-H2AX—A Novel Biomarker for DNA Double-strand Breaks. In Vivo. 2008; 22: 305–309. PMID:18610740
10. Bonner WM, Redon CE, Dickey JS, Nakamura AJ, Sedelnikova OA, Solier S, et al.γH2AX and cancer. Nat Rev Cancer. 2008; 8: 957–967. doi:10.1038/nrc2523PMID:19005492
11. Schultz LB, Chehab NH, Malikzay A, Halazonetis TD. P53 Binding Protein 1 (53bp1) Is an Early Partici-pant in the Cellular Response to DNA Double-Strand Breaks. J Cell Biol. 2000; 151: 1381–1390. doi: 10.1083/jcb.151.7.1381PMID:11134068
12. Panier S, Boulton SJ. Double-strand break repair: 53BP1 comes into focus. Nat Rev Mol Cell Biol. 2014; 15: 7–18. doi:10.1038/nrm3719PMID:24326623
13. Willitzki A, Hiemann R, Peters V, Sack U, Schierack P, Rödiger S, et al. New Platform Technology for Comprehensive Serological Diagnostics of Autoimmune Diseases. J Immunol Res. 2012; 2012: e284740. doi:10.1155/2012/284740
14. Runge R, Hiemann R, Wendisch M, Kasten-Pisula U, Storch K, Zoephel K, et al. Fully automated inter-pretation of ionizing radiation-inducedγH2AX foci by the novel pattern recognition system AKLIDES1.
Int J Radiat Biol. 2012; 88: 439–447. doi:10.3109/09553002.2012.658468PMID:22280362 15. Willitzki A, Lorenz S, Hiemann R, Guttek K, Goihl A, Hartig R, et al. Fully automated analysis of
chemi-cally inducedγH2AX foci in human peripheral blood mononuclear cells by indirect immunofluores-cence. Cytometry A. 2013; 83: 1017–1026. doi:10.1002/cyto.a.22350PMID:24009179
16. Reddig A, Lorenz S, Hiemann R, Guttek K, Hartig R, Heiserich L, et al. Assessment of modulated cyto-static drug resistance by automatedγH2AX analysis. Cytometry A. 2015; n/a–n/a. doi:10.1002/cyto.a. 22667
17. Grecchi S, Mazzini G, Lisa A, Armentero M-T, Bergamaschi R, Romani A, et al. Search for Cellular Stress Biomarkers in Lymphocytes from Patients with Multiple Sclerosis: A Pilot Study. PLoS ONE. 2012; 7. doi:10.1371/journal.pone.0044935
18. Gilgun-Sherki Y, Melamed E, Offen D. The role of oxidative stress in the pathogenesis of multiple scle-rosis: the need for effective antioxidant therapy. J Neurol. 2004; 251: 261–268. doi: 10.1007/s00415-004-0348-9PMID:15015004
19. Oliveira SR, Kallaur AP, Simão ANC, Morimoto HK, Lopes J, Panis C, et al. Oxidative stress in multiple sclerosis patients in clinical remission: Association with the expanded disability status scale. J Neurol Sci. 2012; 321: 49–53. PMID:22883481
20. Polman CH, Reingold SC, Banwell B, Clanet M, Cohen JA, Filippi M, et al. Diagnostic criteria for multi-ple sclerosis: 2010 Revisions to the McDonald criteria. Ann Neurol. 2011; 69: 292–302. doi:10.1002/ ana.22366PMID:21387374
21. Solier S, Pommier Y. The apoptotic ring: A novel entity with phosphorylated histones H2AX and H2B, and activated DNA damage response kinases. Cell Cycle. 2009; 8: 1853–1859. doi:10.4161/cc.8.12. 8865PMID:19448405
22. Meyer B, Voss K-O, Tobias F, Jakob B, Durante M, Taucher-Scholz G. Clustered DNA damage induces pan-nuclear H2AX phosphorylation mediated by ATM and DNA–PK. Nucleic Acids Res. 2013; 41: 6109–6118. doi:10.1093/nar/gkt304PMID:23620287
24. Valdiglesias V, Giunta S, Fenech M, Neri M, Bonassi S.γH2AX as a marker of DNA double strand breaks and genomic instability in human population studies. Mutat Res. 2013; 753: 24–40. PMID: 23416207
25. Heydenreich J, Otto C, Mayer F, Carlsohn A. Reliability of a Fully Automated Interpretation ofγ-H2AX Foci in Lymphocytes of Moderately Trained Subjects under Resting Conditions. J Nutr Metab. 2014; 2014: 478324. doi:10.1155/2014/478324PMID:25147735
26. Rothkamm K, Barnard S, Moquet J, Ellender M, Rana Z, Burdak-Rothkamm S. DNA damage foci: Meaning and significance. Environ Mol Mutagen. 2015; n/a–n/a. doi:10.1002/em.21944
27. Scarpato R, Verola C, Fabiani B, Bianchi V, Saggese G, Federico G. Nuclear damage in peripheral lym-phocytes of obese and overweight Italian children as evaluated by theγ-H2AX focus assay and micro-nucleus test. FASEB J. 2011; 25: 685–693. doi:10.1096/fj.10-168427PMID:21068397
28. Mondal NK, Mukherjee B, Das D, Ray MR. Micronucleus formation, DNA damage and repair in premen-opausal women chronically exposed to high level of indoor air pollution from biomass fuel use in rural India. Mutat Res Toxicol Environ Mutagen. 2010; 697: 47–54. doi:10.1016/j.mrgentox.2010.02.006 29. Marrie RA, Reider N, Cohen J, Stuve O, Trojano M, Sorensen PS, et al. A systematic review of the