regional committee
PAN AMERICAN
HEALTH
ORGANIZATION
XIII Meeting
WORLD
HEALTH
ORGANIZATION
XIII Meeting
Washington, D. C.
October 1961
CD13/3 (Eng.)
26 August 1961
ORIGINAL: ENGLISHI-SPANISH
Topic 22: REPORT ON THE STATUS OF MALARIA ERADICATION
IN THE AMERICAS
IX REPORT
TABLE OF CONTENTS
Page
Introduction ... 2
I. Status of the Malaria Eradication Program ... 2
A. General picture ... 2
B. Extent of the problem ... ... 3
C. Field operations ... 3
II. Special Technical Problems ... 22
A. Epidemiological problems ... 22
B. Entomological problems ... 33
FIGURES AND TABLES
Page
Map: Status of the Malaria Eradication Program in the Americas,
31 December 1960 ... 1
Figures:
1. Slides Examined and Per Cent Positive, by Months, Mexico ... 24
2. Slides Examined and Per Cent Positive, by Months, El Salvador ... 25
3. Slides Examined and Per Cent Positive, by Months, Guatemala ... 27
4. Slides Examined and Per Cent Positive, by Months, British Honduras .... 28
5. Slides Examined and Per Cent Positive, by Months, Trinidad and Tobago . 30
6. Slides Examined and Per Cent Positive, by Months, Jamaica ... 31
7. Slides Examined and Per Cent Positive, by Months, Bolivia ... 32
Tables:
1. Status of Malaria Eradication in the Americas, by Population, 1960 ... 4
2. Status of Malaria Eradication in the Americas, by Area, 1960 ... 5
3. Percentage Distribution of Area and Population in the Americas, 1960,
by Status of Malaria Eradication ... 6
4. Dynamics of the Attack on Malaria in the Americas ... 6
5. Personnel Employed in Malaria Eradication Programs in the Americas
31 December 1959 and 31 December 1960 ...
6. Professional and Technical Personnel Employed in Malaria
Eradication Programs, 31 December 1959 and 31 December 1960 ... 8
7. Field Personnel Employed in Spraying Operations in Malaria
Eradication Programs, 31 December 1959 and 31 December 1960... 9
8. Personnel Employed in Evaluation Operations in Malaria Eradication
Programs 31 December 1959 and 31 December 1960 ... 10
9. Means of Transport in Malaria Eradication Programs in the
Americas, 1960 ... 12
10. Spraying Operations of Malaria Eradication Programs in the Americas
at the End of 1960 ... 13
11. Spraying Achievements of Malaria Eradication Programs in the
Americas at the End of 1960 ... 16
12. Case Detection in Malaria Eradication Programs in the Americas at the
End of 1960 ... 18
FIGURES ANrDi iTABLES (Concluded)
Tables: Page
13. Comparative Results of Active and Passive Case Detection in the
Americas, 1959 and 1960 ... ... 21
14. National Budgets for Malaria Eradication in the Americas, 1959-1961 .... 23
15. Insecticide Resistance Discovered in 1960 ... 33
16. Summary of Resistance to Insecticides of American Anophelines, to 31
December 1960; Results in Major Administrative Subdivisions, by
Country and Species ... 35
17. PASB/WHO Full-Time Professional and Technical Staff Assigned to
Country, Inter-Country and Inter-Zone Malaria Eradication Projects
in the Americas, 1958 to 15 June 1951 ... ... 38
18. Personnel Trained in Malaria Eradication Techniques at International
Centers, 1949-1960 and First Semester of 1961 ... ... 40
19. Fellowships for Study Travel in Malaria Eradication, 1957-1960 ... 41
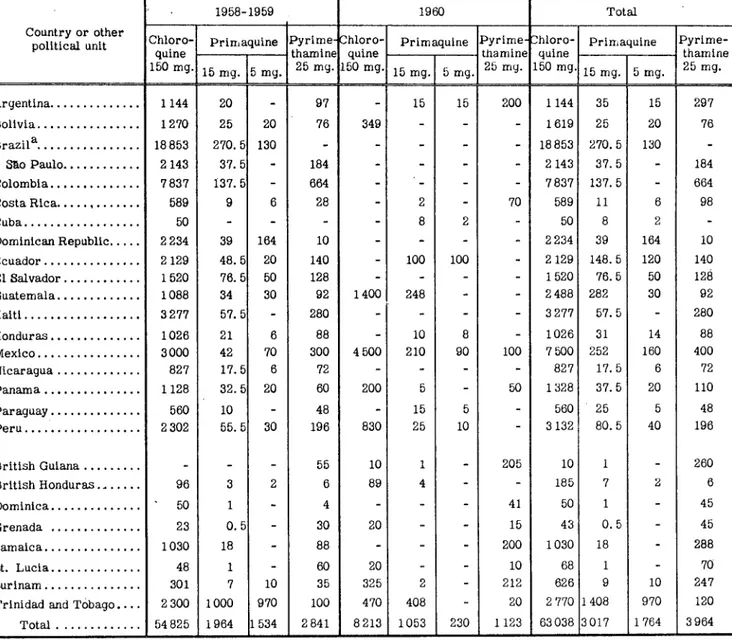
20. Drugs Provided for Malaria Eradication Programs in the Americas by
PAHO, 1958-1960 ... 42
21. Equipment and Supplies, Excluding Drugs, Contributed by PAHO to
Malaria Eradication Programs in the Americas, 1958 to December 1960.. 43
22. International Contributions to Malaria Eradication Programs in the
Americas, 1959-1961 ... ... 45
CD13/3 (Eng.) Page 1
TURKS fUDA
ITISH VIRGIN ISLANDS
MEXICO
?. HO
CANAL ZONE
COSTA RIC
PI INAM
FR GUIANA
v
COLOMBIA
ECUADOR,
F
AZIL
BOLIVIA-- PARAGUAY
CHILE
AREAS IN WHICH MALARIA HAS DISAPPEARED OR NEVER EXISTED.
AREAS WHERE MALARIA HAS BEEN ERADICATED.
URUGUAY
ARGENTINA
AREAS IN THE CONSOLIDATION PHASE.
AREAS WHERE THE CONSOLIDATION PHASE HAS NOT BEEN REACHED AND WHERE MALARIA EXISTS.
L
STATUS OF THE MALARIA ERADICATION PROGRAM IN THE AMERICAS, 31 DECEMBER 1960.
TRINIDAD,TOBAGO
JLV4
I - 1
li l
I fll
CD13/3 (Eng.) Page 2
REPORT ON THE STATUS OF MALARIA ERADICATION IN THE AMERICAS
! IX REPORT
Introduction
Following the custom of previous years, the Director of the Pan American Sanitary Bureau has the honor to present to the XIII Meeting of the Directing Council of the Pan American Health Organization the IX Report on the status of malaria eradication in the Americas.
The document consists of three parts--a summary of the status of the program in general and of the progress made by each country; a discussion of special technical problems that have arisen and of the measures taken to solve them; and a summary of international cooperative activities in the field of malaria eradication in the Americas, with special reference to the participation of PAHO/WHO.
The report has been prepared on the basis of data regularly transmitted to the Pan American
Sanitary Bureau by Member Governments. In addition to a detailed annual questionnaire, monthly
statistical returns on spraying operations, surveillance operations, and movements of personnel are submitted by National Malaria Eradication Services. This information is not always complete and up-to-date, and special efforts continue to be devoted to improving the quality and timeliness of
statistical reporting. Supplementary information is provided by PAHO/WHO staff in Regional and
country projects. In this connection, entomology may be singled out as a subject where the field
work of international staff has provided valuable information for a number of countries.
I. STATUS OF THE MALARIA ERADICATION PROGRAM
A. General picture
The last months of 1960 and early 1961 marked a turning-point in the hemisphere-wide
eradica-tion program. In the first place, the last two countries without a malaria eradication program
entered the preparatory phase. In the case of Cuba this represents a completely new effort. In
Haiti, where an earlier program had been interrupted because of financial difficulties, work was resumed and a new reconnaissance undertaken preparatory to the resumption of spraying operations.
Secondly, the area in consolidation increased in a number of countries, and parts of Mexico, Jamaica and Surinam entered the consolidation phase. In a number of countries in the attack phase progress was substantial, and attention turned to planning for the subsequent period of consolidation. This planning involves increasing epidemiological evaluation activities and devoting greater effort to obtaining epidemiological information on a locality basis. Plans were furnished and adapted by a number of countries for a system of visual recording of epidemiological information to facilitate
supervision of progress in the whole country. Active and passive case finding was augmented by
training spraymen to work in active case detection, and by increasing the number of evaluation
agents and inspectors in general. Efforts were increased in many countries both to build up and to
keep productive a comprehensive network of voluntary collaborators for passive case detection. In
the programs where all or part of a country has only recently begun eradication work (for example~ Cuba and Haiti) the malaria services are profiting from earlier experience in other areas of the Americas and are planning to develop the case detection system during the preparatory phase and thus to provide a satisfactory baseline from which to measure the subsequent trend of malaria. This will also develop a reporting system which will be ready for the greater demands of the
consoli-dation phase at a later date.
CD13/3 (Eng. ) Page 3
The general picture can be summarized as follows: In those areas where special technical problems and financial or administrative difficulties have not arisen, substantial progress is being
made towards the eradication of malaria.! In the majority of American countries, even where the
attack phase has not resulted in immediate and dramatic suppression of malaria, the prognosis is generally good and attention is turning more and more to the problems of the consolidation phase. In countries where transmission of malaria persists in small foci despite well-organized and ad-ministered residual house spraying, it is expected that drug distribution in such limited areas will be adequate. In a very few countries where serious technical, financial, and/or administrative problems are encountered the outcome is not yet certain and further intensive work is needed.
B. Extent of the problem
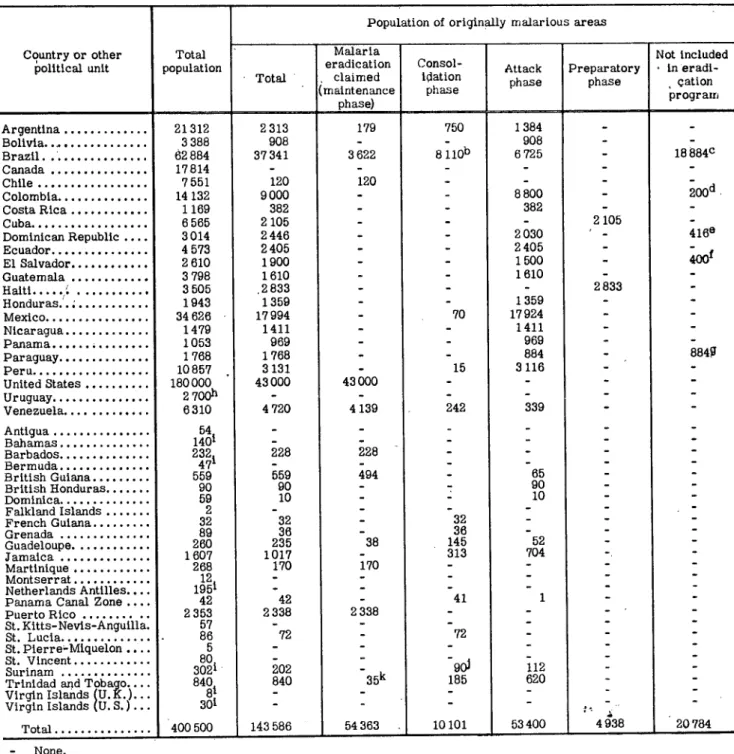
At the enj of 1960, the originally malarious area of the Americas was estimated to comprise
16,080,608 km. with a population of 143,586,000. These figures do not correspond with those given
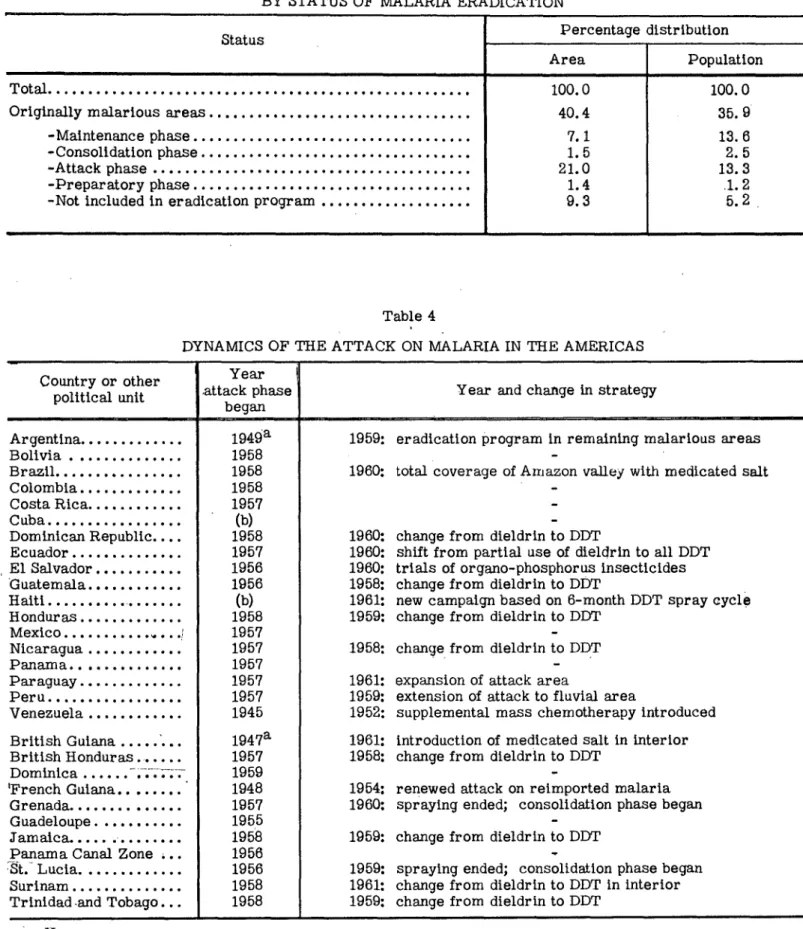
in the VIII Report for a number of reasons: Minor revisions have been made in the figures for a number of countries;a new estimate of the malarious area of Paraguay is nearly ten times as great as the former provisional figure;and datafrom the 1960 censuses of population in the Americas have replaced previous estimates. Details for individual countries are shown in Tables 1 and 2, and the percentage distribution of area and population by status of malaria eradication is shown in Table 3.
Special attention should be called to the areas not included in the eradication program. In
Brazil, because of the size of the country, eradication is being undertaken area by area, and the entire malarious region of the country is not yet covered. In Colombia, less than 1 per cent of the original malarious area is considered 'not included" because in certain areas of internal unrest the proper execution of spraying operations has been hampered. In the Dominican Republic, the shift from a 12-month dieldrin spraying cycle to a 9-month DDT cycle exceeded available resources ard some areas consequently were not sprayed. In El Salvador,new epidemiological information showed that an area provisionally withdrawn from spraying should have been maintained in the attack ph'ase; it was sprayed in 1961, but is counted as "not included" in 1960. Finally, in the case of .Pairaguay, the new estimate of the malarious area mentioned above shifts areas formerly considered free of ma-laria into the 'not included" class, and an attack on mama-laria in these areas is under study.
With entrance into the consolidation phase forecast for many areas in the near future, it is fitting at this time to review the dynamics of the attack phase which led to this favorable situation. Major events inthe attack phase are summarized in Table 4. While many countries began with major orisole reliance on a 12-month dieldrin spraying cycle, it can be seen that numerous changes and revisions of plan occurred. By 1960, most countries had found it necessary to change from an an-nual dieldrin to a 6-month DDT spraying cycle, commonlybased on an application of 2 grams of DDT per square meter of sprayable surface. Chemotherapy was employed as an adjunct to spraying in a number of countries, using tablets where practicable, but in Brazil and British Guiana largely through the medium of medicated salt. In areas where the vector showed resistance to both dieldrin
and DDT, trials of various organophosphorus imagocides and larvicides were undertaken. Much of
the success of national eradication campaigns to date has been due to the willingness of the National Malaria Eradication Services to undertake major changes in strategy when needed, even when (as in the case of a change from dieldrin to DDT with more frequent spraying) this has increased financial and manpower requirements.
C. Field operations
The changing nature of field operations is reflected in the statistics of personnel given in Tables
5-8. Table 5 provides a summary for all malaria eradication programs combined. It will be noted
that total personnel and the numbers engaged in most individual occupations increased, and the excep-tions merit special mention. The decrease in accountants and secretaries relates largely to occupa-tional nomenclature. A secretary, when promoted, often becomes an "administrative assistant" and accounting functions are often handled by general administrative personnel.
CD13/3 (Eng.)
Table 1 Page 4
STATUS OF MALARIA ERADICATION IN THE AMERICAS, BY POPULATION, 1960a (Population in thousands)
Population of originally malarious areas
Country or other Total Malaria Not included
political unit population eradication Consol- Attack Preparatory in eradi-n eradi-Total , claimed ldation phase phase Cation
(maintenance phase program
phase) . program
_ _ _ _ _ _ _ _ _ _ _ _ _ _ _ _
4
_ _ _ _ _ _ __)Argentina ... 21312 2 313 179 750 1384 Bolivia ... 3 388 908 - - 908
Brazil ... 62 884 37 341 3 622 8 110b 6 725 18 884 Canada ... 17814 - -
-Chile ... 7 551 120 120 -
-Colombia ... 14 132 9000 - 8 800 200d Costa Rica ... 1 169 382 - - 382
-Cuba ... 6 565 2105 - - - 2105
Dominican Republic .... 3 014 2 446 - - 2030 416e Ecuador ... 4 573 2 405 - - 2 405 _
El Salvador ... 2 610 1900 - - 1500 400f Guatemala ... 3 798 1610 - - 1610
-Haiti... ... 3505 2 833
Honduras.'.;... 1943 1359 - - 1 359
-Mexico ... 34626 17 994 - 70 17 924
-Nicaragua ... 1479 1411 - - 1411 -Panama ... ; ... 1053 969 - - 969
-Paraguay ... 1768 1768 - - 884 - 884w Peru ... 10857 3131 - 15 3116
-United States ... 180 000 43 000 43 000 - -
-Uruguay ... 2 7 0 0h -
-Venezuela ... 6310 4 720 4139 242 339
-Antigua ... 4 --
-Bahamas ... 1401 -
-Barbados ... 232 228 228 -
-Bermuda ... 47
British Guiana ... 559 559 494 _ 65 _
British Honduras ... 90 90 - 90
Dominica ... 59 10 10
Falkland Islands ... 2
French Guiana ... 32 32 - 32 Grenada ... 89 36 36
Guadeloupe ... 260 235 38 145 52 Jamaica ... 1607 1017 313 704 Martinique ... 268 170 170 - -Montserrat ... 12
Netherlands Antilles .... 1951
Panama Canal Zone .... 42 42 - 41 1 Puerto Rico ... 2 353 2 338 2 338
St. Kitts-Nevis-Anguilla. 57 -
-St. Lucia ... 86 72 _ 72 St. Pierre-Miquelon.... . 5
St. Vincent ... 80 - -
-Surinam ... 3021 202 90 112 Trinidad and Tobaqo ... 840 840 3 5k 185 620
Virgin Islands (U. K. )... 8 - -Virgin Islands (U.S.) .. 301 - - -:
Total ... 400 500 143 586 54363 10101 53400 4938 20 784 - None.
(a) Population refers to 1960 census or mid-1960 estimate unless otherwise indicated.
(b) Includes the estimated population of areas where evidence indicates that transmission was interrupted by the former control program as well as areas where the attack phase has ended but surveillance operations are not yet fully organized. (c) Areas in the control program. (d) Areas not sprayed or irregularly sprayed.
(e) Temporarily not protected during change in spraying operations. (f) These areas are to be added to the attack phase in 1961. (g) Population of areas formerly considered non-malarious where attack is under study.
Page 5 ?Table 2
STATUS OF MALARIA ERADICATION IN THE AMERICAS, BY AREA, 1960 (Area in km2)
Originally malarlous area
Country or other Total Malaria Not included
political unit area a eradication Consol- Attack Preparatory in eradi-Totala claimed idation phase phase catlon
(maintenance phase program
_ _ _ _ _ _ _ _ _ _ _ _ _ _ _ _ _ _ _ _ _ _ _ _ _ _ _ _ _ _ _ _ _ _ _ _ _ p h a se )
I
_ _ _ _ _ _ _ _ _ _ _ _ _ _ _ _ _ _ _ _ _ _ _ _ _ _Argentina ... 2 778 412 270400 23 600 23 000 223800
-Bolivia ... 1069 094 811 393 - - 811 393
-Brazil ... 8 513 844 7 566 774 41 164 254 666 3739179 3 371 511 Canada ... 9 974 375 -
-Chile ... 741 767 55 287 55 287 - -
-Colombia ... 1 138 355 1026433 - 1016433b -10 00c Costa Rica ... 50 900 31526 - - 31 526
-Cuba ... 114 524 36 602 - - 36 602
Dominican Republic ... 48 279 39 219 - - 26 960 - 1 2 2 5 9d Ecuador ... 291906 152 862 - - 152 862
-El Salvador ... ... 21146 19 300 - - 1 9 300e - (e) Guatemala ... 108 889 80 380 - - 80 380
-Haiti ... 27 750 19 098 - - - 19098 Honduras ... 112 088 87 390 - - 87 390
-Mexico... ... . 1969367 978 185 - 36 790 941395 - -Nicaragua ... 148 000 131000 - - 131000
-Panama ... 74 470 68 497 - 68497
-Paraguay ... 406 752 406 752 - - 110 000 296 752f Peru ... 1249 094 943 228 - 5110 938 181
-United States ... 9 346 751 2 257 809 2 257 809 -
-Uruguay ... 186 926
-Venezuela ... 912 050 600 000 418 842 25 429 155 729 Antigua ... 280 -
-Bahamas ... 11396 -
-Barbados ... 431 430 430
-Bermuda ... 53 -
-British Guiana ... 214 970 214 970 5180 (-)g 90 650 British Honduras ... 22 963 22 963 - - 22 963
Dominica ... 790 152 - _ 152 Falkland Islands ... 11961 _ -
-French Guiana ... 90000 90000 - 5000 85000 Grenada ... 344 185 - 185
-Guadeloupe ... 1 780 1 136 69 752 315 Jamaica ... 11293 8 912 - 3455 5457
Martinique ... 1102 300 300 -
-Montserrat ... 84 - -Netherlands Antilles .... 961
-Panama Canal Zone .... 1432 1432 -1 4 3 2h (h) Puerto Rico ... 8 897 8 865 8865 -
-St. Kitts-Nevis-Anguilla. 396 - -
-St. Lucia ... 603 580 _ 580
St. Pierre-Miquelon... 240 -
-St. Vincent ... 389 - - -Surinam ... 143 450 143 430 4 692 138 738 Trinidad and Tobago .... 5118 5118 295J 26 4797 Virgin Islands (U. K.)... 174 - -
-Virgin Islands (U. S.) . 344 - - -
-Total ... 39814190 16080608 2811841 361117 8 850 571 55 700 3 690 522 - None.
(a) Including a few areas not classified separately by phase.
(b) The area in the attack phase is actually slightly less than shown, owing to termination of barrier spraying in some cities and redefinition of the altitude limit of malarious areas. (c) Areas not sprayed or irregularly sprayed. (d) Temporarily not protected during change in spraying operations.
(e) Areas with 400 thousand inhabitants which are included in the attack column are to enter the attack phase in 1961. (f) Areas formerly considered non-malarious where attack is under study.
CD13/3 (Eng.)
Table 3 Page 6
PERCENTAGE DISTRIBUTION OF AREA AND POPULATION IN THE AMERICAS, 1960, BY STATUS OF MALARIA ERADICATION
Status Percentage distribution
Area Population
Total ... ... 100.0 100.0
Originally malarious areas ... 40.4 35. 9
-Maintenance phase ... 7. 1 13.6
-Consolidation phase ... 1. 5 2. 5
-Attack phase ... 21.0 13.3
-Preparatory phase ... 1.4 .1.2
-Not included in eradication program ... 9. 3 5.2
Table 4
DYNAMICS OF THE ATTACK ON MALARIA IN THE AMERICAS
Year
Country or other Year
political unit attack phase Year and change in strategy
began
Argentina ... 1 9 4 9a 1959: eradication program in remaining malarious areas
Bolivia ... 1958
Brazil ... 1958 1960: total coverage of Amazon valley with medicated salt
Colombia ... 1958
Costa Rica ... 1957
Cuba ... (b)
Dominican Republic .... 1958 1960: change from dieldrin to DDT
Ecuador ... 1957 1960: shift from partial use of dieldrin to all DDT
El Salvador ... 1956 1960: trials of organo-phosphorus insecticides
Guatemala ... 1956 1958: change from dieldrin to DDT
Haiti ... ... (b) .. 1961: new campaign based on 6-month DDT spray cycle
Honduras ... 1958 1959: change from dieldrin to DDT
Mexico ... ... 1957
Nicaragua ... 1957 1958: change from dieldrin to DDT
Panama ... 1957
Paraguay ... 1957 1961: expansion of attack area
Peru ... 1957 1959: extension of attack to fluvial area
Venezuela ... 1945 1952: supplemental mass chemotherapy introduced
British Guiana ... 1 9 4 7a 1961: introduction of medicated salt in interior
British Honduras ... 1957 1958: change from dieldrin to DDT
Dominica ... . . 1959
'French Guiana ... 1948 1954: renewed attack on reimported malaria
Grenada ... 1957 1960: spraying ended; consolidation phase began
Guadeloupe ... 1955
Jamaica ... 1958 1959: change from dieldrin to DDT
Panama Canal Zone .. 1956
St. Lucia ... 1956 1959: spraying ended; consolidation phase began
Surinam ... 1958 1961: change from dieldrin to DDT in interior
Trinidad -and Tobago... 1958 1959: change from dieldrin to DDT
- None.
(a) Control-program --which succeeded in interrupting transmission in some areas.
CD13/3 (Eng.)
Page 7 fable 5
PERSONNEL EMPLOYED IN MIALARLU ERADICATION PlROGRAMIS IN THE AMERICAS 31 DECEMBER 1959 AND 31 DECEMBER 1960
Title 31 December 1 9 5 9a 31 December 1 9 6 0b
,~~~~~~~~~~~~~~~~~~~~~~~~~.. a i, , . .. ,; . , . , .f
Physicians...
Engineers ... . ...
Entomologists ...
Entomological Assistants ...
Microscopists ...
Accountants ...
Administrators ...
Administrative Assistants...
Statisticians and Statistical Assistants...
Disbursing Officers ...
Storekeepers ... ...
Assistant Storekeepers.
Draftsmen ...
Secretaries ...
Sector Chiefs ... ...
Squad Chiefs ...
Spraymen ...
Evaluation Inspectors ... ...
Evaluators ...
Mechanics and Assistant Mechanics .. ...
Drivers. ...
Motorboat Operators ...
Boatmen ... ... ...
Laborers...
Others . ...
Total ...
245
92
25
129
383
7
81
412
51
51
90
88
89
421
427
1 399
7487
231
1 360
265
862
125
36
396
1492
16 244
263 (1i)
115 ( 1)
27 (1)
151 (2)
470 (13)
2
96 (1)
559
93
64
94 (1)
91
105
379
417
1495 ( 2)
7718 (20)
309 ( 8)
2575 ( 5)
288
1096
151
62
473
1489
18 582 (69)
(a) Including part-time personnel.
CD13/3 (Eng.)
'I'able 6 Page 8
PROFESSIONAL AND TECHNICAL PERSONNEL EMPLOYED IN MALARIA ERADICATION PROGRAMS, 31 DECEMBER 1959 AND 31 DECEMBER 1960
Entomological Country or other Total Physicians Engineers Entomologlsts assistants
political unit 1959 1960 1959 1960 1959 1980 1959 1960 1959 1960
Argentina ... 16 17 10 11 2 2 - 4 4 Bolivia ... 26 16 11 6 9 6 1 1 5 3 Brazil(excl. Sao Paulo). ... 82 ... 42 ... 27 ... 7 ... 6 Brazil (Sao Paulo) ... 41 38 18 16 9 9 1 1 13 12 Colombia ... 40 56 25 35 7 13 1 1 7 7 Costa Rica ... 8 8 1 1 2 2 1 1 4 4
Cuba ... ... 8 ... 2
Dominican Republic .... 6 5 2 2 2 2 - I 1 1
Ecuador ... 19 17 10 10 2 2 1 1 6 4 El Salvador ... 12 12 3. 3 1 1 1 1 7 7 Guatemala ... 9 13 4 3 1 1 1 1 3 8 Hatia...
-Honduras ... 5 5 1 1 - - 1 1 3 3
Mexico ... 183 166 101 86 42 38 6 3 34 39 Nicaragua ... 10 12 4 4 - - 1 1 6 7 Panama ... 5 4 1 1 1 - 1 1 2 2 Paraguay ... 8 9 3 4 1 1 1 1 3 3 Peru ... 29 29 14 15 7 8 1 1 7 5 Venezuela ... 31 37 25 13 4 2 2 3 - 19
British Guiana ... 2 2 1 1b - - - 1
British Honduras ... 2 - 1 - 1
Dominica ... 1 1 1 1b
-French Guiana ... 3 3 1 1b 1 1 1 1
Grenada ... ... 1 1 1 bi - -
-Guadeloupe ... 2 - 1 1
Jamaica... 3 3 2 2 1 1
Panama Canal Zone ... 9b 1 4b 1 1 0b 1b 1b 1b b 6b 2b
St. Lucia ... 1 1 1 b
Surinam ... 1 1 1 1
Trinidad and Tobago... 19 15 1 1 - - 1 - 17 14
Total ... 491 575 245 278 92 116 25 28 129 153 ... No information.
None.
Page 9
'Fable '7
FIELD PERSONNEL EMPLOYED IN SPRAYING OPERATIONS IN MALARIA ERADICATION PROGRAMS, 31 DECEMBER 1959 AND 31 DECEMBER 1960
Motorboat
Country or other . Total Sector Chiefs Squad Chiefs Spraymen Drivers Operators
political unit
p1959 1960 .1959 1960 1959 1960 1959 1960 1959 1960 1959 1960
Argentina ... 193 199 10 8 32 29 110 127 41 35
Bolivia ... 315 295 31 29 23 12 209 203 40 37 12 14 Brazil (excl. Sao Paulo). ... 946 ... 51 ... 122 ... 618 ... 155 ...
-Brazil (Sao Paulo) ... 441 798 20 18 30 95 306 492 83 190 2 3 Colombia ... 1590 1503 53 50 102 96 1 202 1 122 167 167 66 68 Costa Rica ... 112 112 3 3 15 15 84 85 10 9
Cubaa ...
-Dominican Republic ... 210 221 6 6 28 29 142 152 34 34
Ecuador ... 313 578 16 7 43 45 227 479 31 34 6 13 El Salvador ... 419 417 12 12 65 73 295 283 47 49
Guatemala ... 528 554 16 16 72 74 386 412 53 52 1 Haitib ...
Honduras ... 318 319 10 10 42 46 221 217 44 45 1 1 Mexico ... 3279 2455 132 120 589 473 2 519 1820 31 31 8 11 Nicaragua ... 310 338 8 8 47 48 205 233 45 44 5 5 Panama ... 157 127 7 7 25 23 120 92 5 5
Paraguay ... 137 128 4 5 16 18 86 84 27 19 4 2 Peru ... ... 365 611 14 20 56 109 249 412 40 61 6 9 Venezuela ... 770 451 41 12 91 58 570 349 59 21 9 11
British Guiana ... 62 70 - 1 7 9 51 48 4 10 - 2 British Honduras ... 26 25 2 - 4 4 19 19 1 2
Dominica ... 8 5 1 - 1 - 5 4 1 1
French Guiana ... 35 43 2 - 9 4 20 32 4 5 - 2 Grenadac ... 15 3 1 1 1 - 10 - 3 2
Guadeloupe ... 40 39 1 - 6 6 30 30 3 3 Jamaica ... 387 340 17 17 56 56 266 219 48 48 Panama Canal Zone ... 2 4d 22 - - 2 2d 2 0d 2 0d 2
St. Luciae ... - 1 - - - 1 -
-Surinam ... 95 100 7 6 16 19 58 56 9 9 5 10 Trinidad and Tobago .... 141 199 13 10 21 32 77 130 30 27
Total ... 10300 10899 427 417 1399 1497 7487 7 738 862 1096 125 151 No information.
- None.
(a) Program in preparatory phase in 1960. (b) Program interrupted 1959-1960; resumed in 1961.
(c) In consolidation phase from February 1960. (d) Part-time; spraying operations are carried out for two weeks twice a year.
CD13/3 (Eng.) Page 10 Table 8
PERSONNEL EMPLOYED IN EVALUATION OPERATIONS IN MALARIA ERADICATION PROGRAMS
'31 DECEMBER 1959 AND 31 DECEMBER 1960 Evaluation
Total Evaluators Microscopists
Country or other Inspectors valuators political unit
1959 1960 1959 1960 1959 1960 1959 1960
Argentina ... 100 116 14 12 70 84 16 20 Bolivia ... 39 46 - 1 24 30 15 15 Brazil(excl. Sao Paulo). ... 124 ... 23 ... 70 ... 31 Brazil (Sao Paulo) ... 76 60 4 - 26 - 46 50 Colombia ... 246 414 33 37 166 330 47 47 Costa Rica ... 28 35 3 3 18 25 7 7 Cuba ... ... 18 - ... 13 ... 5
Dominican Republic ... 12 12 - - 7 7 5 5
Ecuador... 67 64 2 7 36 38 19 19 El Salvador ... 23 31 3 4 16 21 4 6 Guatemala ... 44 64 4 4 29 49 11 11
Haiti b ...
-Honduras ... 40 47 4 4 22 26 14 17 Mexico ... 514 1488 6 5c 109C 386 1288 63 91 Nicaragua ... 40 50 2 4 32 38 6 8 Panama ... 38 38 2 2 25 25 11 11 Paraguay ... 28 34 6 6 13 18 9 10 Peru ... 99 136 1 12 66 86 32 38 Venezuela ... 422 380 81 72 301 268 40 40
British Guiana ... 1 6 - - - 3 1 3
British Honduras ... . 8 7 1 1 4 4 3 2
Dominica ... 5 3 - - 4 2 1 1
French Guiana ... - - -_ - 1
Grenada ... 3 7 - _ 2 6 1 1d
Guadeloupe ... 7 12 - 9e 4 3 3
Jamaica ... 46 50 - 32 36 14 14
Panama Canal Zone .... 2d 2 0d 2d 3d ... 5d ... 2d
St. Lucia ... 8 8 2 1 5 6 1 1
Surinam ... 19 36 1 1 14 30 4 5 Trinidad and Tobago .... 69 82 1 1 58 71 10 10 Total ... 1 974 3380 231 317 1360 2 580 383 483 No information.
- None.
CD13/3 (Eng.) Page 11
The decrease in the number of spray sector chiefs reflects the progress of eradication. As
areas entered the consolidation phase in some countries and the attack phase began or was strength-ened in others, differences innational practicewith respect to the ratio of supervisory to subordinate personnel were reflected in a decrease in the number of spray sector chiefs even though the number of squad chiefs and spraymen increased.
The substantial increase in the numbers of evaluators and evaluation inspectors reflects the increased emphasis on case detection, not only in areas in the consolidation phase, but in eradication
programs in general. Similarly, augmented case detection activity has increased the number of
slides to be examined and called forth a comparable increase in the number of microscopists.
Means of transport, shown in Table 9, have not changed significantly from the previous year. Jeeps and light trucks which are used for spray squads can also be utilized by groups of evaluators during the consolidation phase. The use of motorcycles and bicycles is limited by road conditions, and has not proved practicable in most cases. Boats and animals respond to special requirements in given countries and types of terrain.
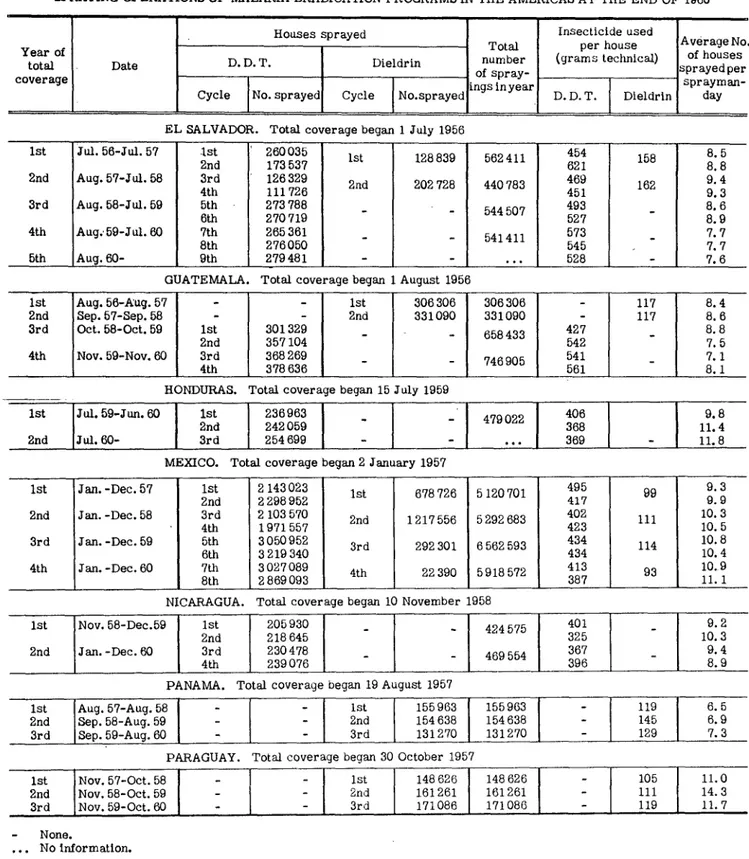
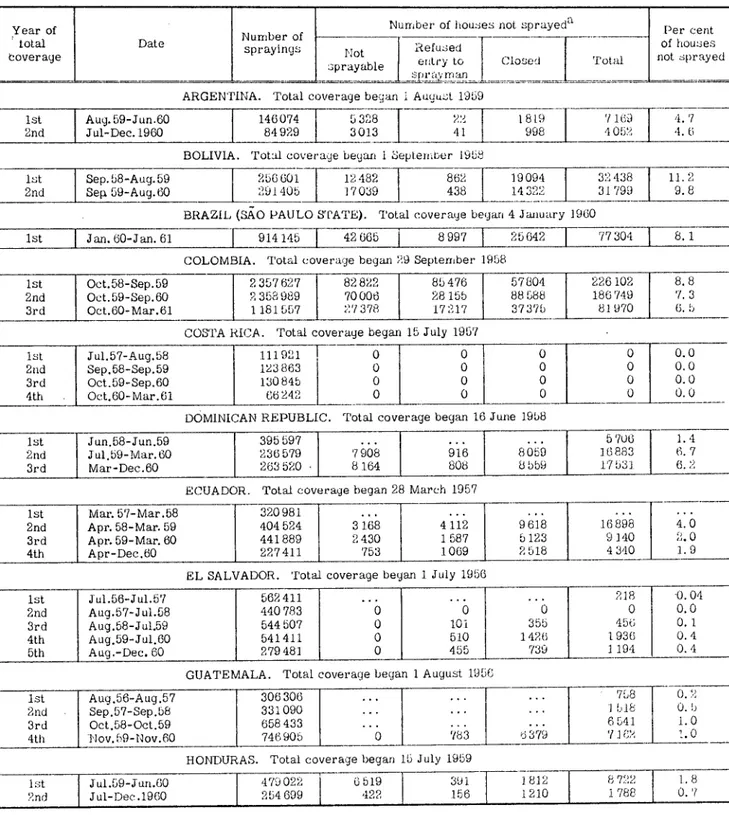
Details of spraying operations are shown in Tables 10 and 11. St. Lucia and Grenada no longer appear, since the entire originally malarious area of each island is now inthe consolidation phase. In countries where some part entered the consolidation phase, a decline in number of houses sprayed can be noted. In Mexico, where spraying was suspended in selected areas and these were not yet classified in the consolidation phase, this decline was already evident in 1960. In Panama, the steady decline inthenumber of houses sprayed is associated with organizational and administrative difficul-ties; and it can be seen from Table llthat special problems were encountered in Panama in connec-tion with closed houses. In most countries, the efficiency of spraymen measured by houses per man-day was stable or slightly improved in 1960. The declining output in Dominica relates to adminis-trative difficulties which also caused suspension of spraying in June and July 1960.
The general shift from dieldrin to DDT is clear in Table 10, while the differences in grams of insecticide applied per house for DDT relate to differences between countries in average sprayable surface and size of house. The increase in a number of countries in the per cent of houses not sprayed, while by no means of alarming proportions, may serve as a reminder that health education must be undertaken on a continuing and intensive basis so as to create an atmosphere of public sup-port in which the spraymen can work most efficiently.
Case detection is of increasing importance in malaria campaigns in the Americas as the
con-solidation phase approaches, and this is reflected in the statistics of such operations shown in
Table 12. A decrease in the percentage of positivity of slides examined can be observed in the majority of programs, with the problem areas standing out clearly in opposition to the general trend. More than one-third of the countries included in Table 12 reported less than 1 per cent positivity in
1960; this was twice as many countries as fell in the same class in 1959. Particularly in countries approaching or already in the consolidation phase, there has been an increase in the number of evaluators, microscopists, and notification posts, and a great increase in the number of slides. In Mexico, more than 1,000,000 slides were examined in 1960. On the island of St. Lucia, 13,716 slides were examined during the first year of consolidation, representing 19 per cent of the population of ,the original malarious area.
CD13/3 (E:, .) Page 12 Table 9
MEANS OF TRANSPORT IN MALARIA ERADICATION PROGRAMS IN 'TILE AMERICAS, 1960
Trucks Other AutoSo- addle
Country or other trucks iles and Motor- Motor Other d pack political unit more) and station cycles boats boats animal
pickups wagons
_______~~~~~~~~~~ __ auons_ __ -__ __
Argentina ... 8 81 12 12 2 12 4 5a Bolivia ... 2 30 25 1 - 3 14 - 160
Brazil(excl. Sao Paulo).. 15 66 130 14 - - 3 3 267 Brazil (Sno Paulo) ... 11 155 27 13 - - 5 - 26'7 Colombia ... 19 218 78 30 - 10 72 37 760 Costa Rica ... 1 14 7 1 - 6 6 -
-Cuba ... - 4
-Dominican Republic .... 2 34 25 8 - - -
-Ecuador ... 4 35 35 5 - 1 15 3 95 El Salvador ... 1 39 13 5 - - 2
-Guatemala ... 1 49 4 19 - 2 5 1
-Honduras ... 2 35 21 5 - - 1 - 27 Mexico ... 16 414 201 16 - _ 15 - 1 472 Nicaragua ... 2 23 16 5 - 9
-Panama ... _ 32 16 7 - 15
-Paraguay ... _ 21 18 3 - 1 4
Peru ... 133 67 1 - - 60 -
-Venezuela ... 3 63 67 23 4 114 2'7 '74 631
British Guiana ... 1 3 - - - 2 -
-British Honduras ... - 7 2 2 - 4 - -
-Dominica ... 2 - - 3 - -
-French Guiana ... 1 4 1 2 - 1 3 -
-Grenada ... - - 2 1 - 3 - -
-Guadeloupe ... 1 4 3 1 - - - -
-Jamaica ... 14 33 17 10 - -
-Panama Canal Zone ... - 7 - - - - 6
-St. Lucia ... 1 3 - 5 - - -
-Surinam ... 2 2 2 4 8 4 20 -
-Trinidad and Tobago .... 14 6 9 2 - 1 - 4
- None.
(a) Tank trucks.
Page 13 Table 10
SPRAYING OPERATIONS OF MALARIA ERADICATION PROGRAMS 1N THE AMERICAS AT THlE END) OF 1960
Houses sprayed
D. D. T. Dieldrin Cycle No. sprayed Cycle No.sprayed
'rot
rnum
of spi
ings in
Insecticide used al per house ber (grants technical)
ray-year
D. D. DT. Dieldrin ARGENTINA. Total coverage began 1 August 1959
1st Aug. 59-Jun. 60
2nd Jul.
60-1st 2nd 3rd
55849 a 2 1 4 6b 81 1 7 0a 6909b 78 487 a
6 442b
263 ...
146074 255 ...
... 305 ...
BOLIVIA. Total coverage began 1 September 1958 1st Sep. 58-Aug. 59
2nd Sep. 59-Aug. 60 BR
1st 2nd 3rd 4th
116 572 129 119 136 01 142 536 AZIL (SAO PAULO STATE)
1st 10910 256601 331 2 118.3 7.0
319 7.6
2nd 12 268 291 405 30 118.
309 coverage began January 1960 · Total coverage beyam 4 January 1960
1st [ Jan. -Dec. 60 | 1st 455 19
JanJan. 6an. 61 2nd 458 926 | --
I
l 914 145433 [
404 ' 8. 49.8e
COLOMBIA. Total coverage began 29 Septen.ber 1958
1st Oct. 58-Sep.59 1st 1181235 - 466 6. 6
2nd 1 176 392 627 425 8. 9
2nd Oct. 59-Sep.60 3rd 1 196 930 2 358 989 409 . 4
4th 1 162 059 - - 394 9.7
3rd Oct. 60- 5th 1181557 - ... 399 9.7
COSTA RICA. Total coverage began 15 July 1957
1st Jul. 57-Aug. 58 1st 53 297 - - 464 5.0
2nd 58 624 111419 7.4
2nd Sep. 58-Sep. 59 - 3rd 60 800 123863 465 6. 9
4th 63 063 - - 531 7. 1
3rd Oct. 59-Sep. 60 5tth 63884 - - 130845 512 8.6
6th 66961 - - 473 9.3
4th Oct. 60- 7th 66 242 ... 475 9.4
DOMINICAN REPUBLIC. Total coverage began 16 J une 1958
1st Jun. 58-Jun. 59 - 1st 395 597 395 597 - 102 11.4 2nd Jul. 59-May 60 - 2nd 236 579 236 579 119 10.5
3rd Mar. 60- IstC 263 520 - ... 481 9. 4
ECUADOR. Total coverage began 28 March 1957
1st Mar. 57-Mar.58 1+2nd 63 284 1st 25769'7 320981 590 114 8.0
2nd Apr. 58-Mar. 59 3rd 50089 490 6.9
4th 83018 435 145 8. 5
3rd Apr. 59-Mar. 60 5th 7 3771 7399 44 3
4t Ar -e3rcd 2 7I 729 4 4i |89 12
6th 97 9790 403 8. i
4th Apr. -Dec. 60 Ce) 227411 - 227411 424 -8.9
Year of total coverage
Date
Average No. of houses sprayed per
sprayn an-day
None.
. . . No inform ation.
(a) Sprayed twice. (b) Sprayed once. (c) INine-nionth cycle. (d) Cycle not completed. (e) Emergency spraying.
-L___
E __
__ __= __ ___
CD13/3 (Eng.) Table 10 (Continued) Page 14 SPRAYING OPERATIONS OF MALARIA ERADICATION PROGRAMS IN THE AMERICAS AT THE END OF 1960
Houses sprayed Insecticide used
Total per house Average No. Year of
total Date D. D. T. Dieldrin number (grams technical) of houses
coverage lpnyear
sprayman-Cycle No.sprayed Cycl No.sprayed e D. D. T. Dieldrin day EL SALVADOR. Total coverage began 1 July 1956
1st Jul. 56-Jul. 57 -1st 260 035 454 8.5
2nd 173537 Ist 128 839 562 411 621 158 8.8
2nd Aug. 57-Jul. 58 3rd 126 329 469 9. 4
4th 111726 2nd 202 728 440783 451 162
3rd Aug. 58-Jul. 59 5th 273 788 _ 544507 493 8. 6
6th 270 719 527 8.9
4th Aug. 59-Jul. 60 7th 265 361 541411 573 7. 7
8th 276050 545 7. 7
5th Aug. 60- 9th 279481 - ... 528 - 7. 6
GUATEMALA. Total coverage began 1 August 1956
1st Aug. 56-Aug. 57 - 1st 306 306 306 306 - 117 8.4 2nd Sep.7-Sep.58 - 2nd 331090 331090 - 117 8.6 3rd Oct. 58-Oct. 59 1st 301 329 658433 427 8.8
2nd 357 104 542 7. 5
4th Nov. 59-Nov. 60 3rd 368 269 746905 541 7. 1
4th 378636 561 8.1
HONDURAS. Total coverage began 15 July 1959
1st Jul. 59-Jun. 60 1st 236963 479022 406 9.8
2nd 242059 368 11.4
2nd Jul. 60- 3rd 254 699 - ... 369 11.8
MEXICO. Total coverage began 2 January 1957
1st Jan. -Dec. 57 1st 2 143 023 s495 99 9.3
2nd 2 298952 417 9.9
2nd Jan. -Dec. 58 3rd 2 103 570 2nd 1217556 5 292683 402 111 10. 3
4th 1971557 423 10.5
3rd Jan. -Dec. 59 5th 3 050 952 3rd 292 301 6 562 593 434 114 10.8
6th 3 219340 434 10.4
4th Jan. -Dec. 60 7th 3 027089 4th 22390 5918572 413 93 10.9
8th 2 869093 387 11.1
NICARAGUA. Total coverage began 10 November 1958
1st Nov. 58-Dec.59 1st 205930 424575 401 9.2
2nd 218 645 325 10.3
2nd Jan. -Dec. 60 3rd 230478 469 54 367 9.4
4th 239076 396 8.9
PANAMA. Total coverage began 19 August 1957
1st Aug. 57-Aug. 58 - - 1st 155963 155963 - 119 6.5 2nd Sep. 58-Aug. 59 - 2nd 154 638 154 638 145 6.9 3rd Sep. 59-Aug. 60 - 3rd 131270 131270 129 7. 3
PARAGUAY. Total coverage began 30 October 1957
1st Nov. 57-Oct. 58 - I - 1st 148 626 148 626 | - 105 11.0 2nd Nov.58-Oct. 59 - 2nd 161261 161261 111 i 14.3 3rd Nov. 59-Oct. 60 1 - 3rd 171086 171086 1 119 11.7
None.
Page 15
Table 10 (Concluded)
SPRAYING OPERATIONS OF MALARIA ERADICATION PROGRAMS IN THE AMERICAS AT THE END OF 1960 Insecticide used
Houses sprayed Insecticide AverageNa Total per house
Year of of houses
number (grams technical) of houses total Date D. D. T. Dieldrin of spray- sprayedper
coverage ofin yearay-
sprayman-Cycle No.sprayed Cycle No.sprayed D.D.T. Dieldrin day PERU. Total coverage began 17 November 1957
1st Noj. 57-Oct. 58 1+2nd 286 7 6 4a
70 266b 1st 121666 478696 ... ... 7.8 2nd Jan. -Dec. 59d c) 271065 2nd 341804 612 869 424 118 8.4 3rd Jan. -Dec. 60 (c) 447 848 3rd 234643 682491 468 95 8.4
BRITISH HONDURAS. Total coverage began 4 February 1957
1st Feb. 57-Jan. 58 1- st 17082 17082 - 84
2nd Feb. 58-Dec. 58 1st 6419 2nd 11873 25880 290 99 8.0
(e) 2nd 118 7 4 7 0a 416 8.2
3rd May 59-Jun. 60 3rd 17 516 35521 329 7. 5
4th 18 005 332 8.0
4th Jul. 60- 5th 18013 - ... 374 - 8.4
DOMINICA. Total coverage began 8 June 1959
1st Jun. 59-May 60 1st 2748 5352 258 8.1
2nd 2604 217 7.7
2nd Aug. 60- 3rd 2 722 .- .. 238 - 5.2
GRENADA. Total coverage began 12 February 1957, ended February 1960 JAMAICA. Total coverage began 2 January 1958
1st Jan. -Dec. 58 - - 1st 271514 271514 - 61 8.9 2nd Jan. -Sep. 59 1st 88 862 2nd 181 319 270 181 226 62 9.9 3rd Oct. 59-Sep.60 2nd 269225 - 510271 213 9.9
3rd 241046 - - 179 9.5
ST. LUCIA. Total coverage began 16 January 1956, ended October 1959 SURINAM. Total coverage began 5 May 1958
1st May 58-Apr. 59 1st 31299 1stf 7484 78994 310 53 5.8
2nd 40211 318 6.9
2nd May 59-Apr. 60 3rd 37563 2ndf 13 331 88 339 274 598.0
4th 37 445 250 7.8
3rd May-Dec. 60 5th 36861 3rdf 3 378 40 239 247 55 6.2 TRINIDAD AND TOBAGO. Total coverage began 2 January 1958
1st Jan. -Oct. 58 - - 1st 117678 117678 - 141 7. 1 2nd Jan. -Dec. 59 1 st g 68 290 2nd 81 108 149 398 315 126 9.0 3rd Jan. -Dec. 60 2nd 118978 3rd 2 322 241685 331 11.5
3rd 120385 317 9.2
None.
... No information.
(a) Sprayed twice. (b) Sprayed once. (c) Owing to different spray cycle timing in different regions, these data refer to the calendar year. (d) Total coverage of all malarious zones of the country began in December 1959.
(e) In the period January-April 1959 spraying was limited to emergency spraying of 210 houses with dieldrin.
(f) Houses sprayed with dieldrin are shown for dates corresponding to the DDT cycle, though in 1960 the dieldrin year was July-June. From January 1961, dieldrin and DDT cycles are synchronized.
CD13/3 (Eng.)
Table I1 Page 16
SPRAYING ACHIEVEMENT.OF MALARIA ERADICATION PROGRAMS IN 'TiE AMERICAS AT TI:IE END OF 1960
Date Number ofsprayings
Number of houses not sprayed" Per cent
No Refused of houses
3prayable erntry to Closed Total not sprayed
4pjayvman b
ARGENTINA. Total coverage began i Aujust; 1399
1st Aug. 9-JunGO 146074 5328 22 22'1 1819 1. 7 2nid 2d IJul-Dec. 1960 Jul-Dec. 5 9-Jun60 I4 84929 I2 3 3013 03 41 41
~
I 998 9 I 4 052 I I1.BOLIVIA. Total coverage began
i
Leplenmtber 198, 1stI
Sep.b8-Aug. 59 26601 1241822nd I Se 59-Auy.60 I 291 408 17 039
862 19094 32438 11.2
438 1432 2 31799 9 .8 BRAZIL (SAO PAULO STATE). Total coverage began 4 January 1960
1st
I
Jan. 60-Jan. 61 9141458 4266 I 89971 25642 7304 8.1 COLOMBIA. Total coverage began 2,9 September 19581st Oct.58-Sep.59 2 357 627 82 822 85476 57804 226102 8.8 2nd Oct.59-Sep.60 2 358 989 70 006 28 155 88588 186 749 17.3 3rd Oct.60-Mar.61 1 181 557 :2 378 17217 37375i 81 970 6. 5
COSTA RICA. Total coverage began 15 July 1957
1st Jul.57-Aug.b58 111921 0 0 0 0.0
2nd Sep.58-Sep.59 123863 0 0 0 0 0.0
3rd Oct.59-Sep.60 130845 0 0 0 0 0.0
4th Oct.60-Mar.61 ;6 242 0 0 0 0 0.0
DOMINICAN REPUBLIC. Total coverage began 16 June 1958
1st Jun.58-Jun.59 39 597 .... .. 5 706 1. i
2nd J ul.b9-Mar.60 236 579 79 916 8089 1 6 83 1 7 3rd Mar-Dec.60 263 520 8 164 808 8 559 17 31 6.
ECUADOR. Total coverage began 28 March 1957
1st Mar. 57-Mar.b8 320981 ... .. .
2nd Apr. 58-Mar. 59 404524 3168 4112 9618 16 j898 4. 0 3rd Apr. 59-Mar. 60 441889 2430 1587 5 123 9140 2.0 4th Apr-Dec.60 227411 753 1009 2 518 4 310 1.9
EL SALVADOR. Total coverage began 1 July 1986
1st Jul.56-Jul.57 562 411 ... ... ... 218 0.04
2nd Aug.57-Jul.58 440 783 0 0 0 0 0.0
3rd Aug.58-Jul.59 544 507 0 10i 355 456 0. 1 4th Aug.59-Jul.60 541411 0 510 1426 193( 0. 4
5th Aug.-Dec. 60 279481 0 455 739 1194 0. 4 GUATEMALA. Total coverage began 1 August l&56
1st Aug.56-Aug.57 306306 ... ... 78 0.2
2nd Sep.57-Sep.b8 331090 ... ... .... I 18 0. 3rd Oct.58-Oct.59 658433 ... ... 6541 1.0 4th Nlov. 9-Nov.60 746 908 0 '783 0 379 711 .0
HONDURAS. Total coverage began 15 July 1959
;t Jul.59-jun.60 47]022 1 519 39i 1812 8 722 1.8 2rid Jul-Dec.1960 254 699 422 156 1210 1788 0. 7
... No information.
(a) When follow-up spraying is done, the figures represent the net number of hcbu:es uar::prayed at the ernl of' the spraying cycle.
Year of total Coverage
Page 17
Table 11 (Concluded)
SPRAYING ACHIEVEMENTS OF MALARIA ERADICATION PROGRAMS IN THE AMERIICAS AT THE END OF 1960 Number of houses not sprayed a
sprlNot |Refused
entry to Closed sprayable spraymansprayman
Per cent of houses Total not sprayed
MEXICO. Total coverage began 2 January 1957
1st Jan-Dec.57 5 120 701 77 537 71 619b 149 156 2. 8 2nd Jan-Dec.58 5 292 683 102 485 90 686b 193 171 3. 5 3rd Jan-Dec.59 6 562 593 95 178 117 107b 212 28', 3. 1 4th Jan-Dec. 60 5 918 572 76 497 1 08 85 7b 1853t4 3. 0
NICARAGUA. Total coverage began 10 November 1958
1st Nov.58-Dec.59 424 575 6 802 2 099 7282 16183 3. 7 2nd Jan-Dec.60 469 554 12 487 2 102 4841 19 430 4. 0
PANAMA. Total coverage began 19 August 1957
1st Aug.57-Aug.58 155963 ... ... ... 5047 3.1
2nd Sep. 58-Aug. 59 154 638 2 247 267 5857 8371 5. 1 3rd Sep. 59-Aug. 60 131270 1825 530 6738 9093 6. 5
PARAGUAY. Total coverage began 30 October 1957
1st Nov.57-Oct.58 148 626 0 0 651 651 0. 4 2nd Nov.58-Oct.59 161261 0 90 1022 1112 0.7 3rd Nov. 59-Oct.60 171086 0 28 981 1009 0. 6
PERU. Total coverage began 17 November 1957
1st Nov.57-Oct.58 478 696 522 72 42 201 42 795 8.2 (c) Jan. -Dec. 59 612 869 16 373 2 163 22 120 40 656 6.2 (c) Jan. -Dec. 60 682 491 12 433 1479 13 661 27 573 3. 8
BRITISH HONDURAS. Total coverage began 4 February 1957
1st Feb.57-Jan.58 17082 ... ... ...
2nd Feb-Dec.58 25880 0 0 427 427 1. 6
3rd May 59-Jun.60 35521 510 3 334 847 2. 3
4th Jul-Dec.60 18013 181 1 168 350 1.9
DOMINICA. Total coverage began 8 June 1959
1st Jun.59-May 60 5352 28 104 182 314 5. 5 2nd Aug. 60-Apr.61 2722 13 49 230 292 9. 7
JAMAICA. Total coverage began 2 January 1958
1st Jan-Dec.58 271514 7395 9 0 7404 2. 7
2nd Jan-Sep.59 270 181 5 217 29 1834 7080 2.6 3rd Oct.59-Sep.60 510271 17831 141 3 916 21888 4.1
SURINAM. Total coverage began 5 May 1958
1st May 58-Apr.59 78994 196 124 4 980 5300 6.3 2nd May 59-Apr.60 88339 166 1 126 3838 5130 5.8 3rd May-Dec.60 40239 342 1 374 6697 8 413 17. 3
TRINIDAD AND TOBAGO. Total coverage began 2 January 1958
1st Jan-Oct.58 117 78 . . ... 2 519 2. 1
2nd Jan-Dec.59 149 398 27 1 477 505 0. 3
3rd Jan-Dec.60 241 685 33 0 1301 1 334 0. 5 No information.
(a) When follow-up spraying is done, the figures represent the net number of houses unsprayed at the end of the spraying cycle.
(b) Including unspecified other reasons.
(c) Owing to different spray cycle timing in different regions, these data refer to the calendar year.
--
--Table 12
CASE DETECTION IN MALARIA ERADICATION PROGRAMS IN THE AMERICAS AT THE END OF 1960
No. of in-tabitants
directly No. of protected slides by spray- .amined
ing
CD13/3 (Eng.) Page 18
%verage
No. of No. of No. of otifica- evalu- micro-on posts ators scopists
roducing at end at end
slides of year of year er month
ARGENTINA. Total coverage began 1 August 1959
1st ' Aug. 59-June 6 5359221 707001 6 2 4911 0 2 497 3. 53 107 60 19 2nd Jul. 60-Mar. 61 445818 78761 4 926 0 930 1.18 172 65 21
BOLIVIA. Total coverage began 1 September 1958
1st Sep. 58-Aug. 59a 754 635 50980 273 1 268 302 1843 3. 62 2 0 7a 23 10 2nd Sep. 59-Aug. 60 1295044 99241 124 803 .179 1106 1. 11 275 24 8 3rd Sep. 60-Jan. 61 630 612 32 989 44 156 19 219 0. 66 336 29 10
BRAZIL (SAO PAULO STATE). Total coverage began 4 January 1960
1st IJan. -Dec. 60 36449691 1146221 66 8230| 1 8297 7.24 427 l 50 41 COLOMBIA. Total coverage began 29,September 1958
1st Oct. 58-Sep. 59 13089 121 205343 731 1877 18 2 626 1.28 100 158 40 2nd Oct. 59-Sep. 60 12 701683 542 570 3 564 4 923 42 8 529 1. 57 572 223 34 3rd Oct. 60-Jan. 61 5339701 127237 915 1102 2 2019 1. 59 2918 317 33
COSTA RICA. Total coverage began 15 July 1957
1st Aug. 57-Aug.58 550660 24773 115 1661 10 1786 7.20 69 15 5 2nd Sep. 58-Sep. 59 596007 52697 135 2081 6 2222 4.22 109 17 5 3rd Oct. 59-Sep. 60 622 215 66 721 91 1888 1 1980 2. 97 202 25 6 4th Oct. 60-Mar.61 307601 35 178 23 933 0 956 2.72 286 20 8
DOMINICAN REPUBLIC. Total coverage began 16 June 1958
1st Jun. 58-Jun. 59 2015214 29718 1522 1537 1 3060 10.30 82 6 4 2nd Jul. 69-Feb. 60 1202301 19362 2453 1751 10 4214 21.76 125 6 5 3rd Mar. 60-Jan. 61 1474555 17452 2870 1642 6 4518 25.89 110 6 5
ECUADOR. Total coverage began 28 March 1957
1st Mar. 57-Mar.5E 1777566 47993 1169 1086 3 2 258 4.70 ... ... ... 2nd Apr. 58-Mar. 5 2171079 69085 2361 2437 4 4802 6.95 262 37 9 3rd Apr. 59-Mar. 6q 2080775 108041 2454 3833 4 6291 5.82 490 43 13 4th Apr. 60-Feb. 61 1391778 109 498 2938 5871 20 8829 8.06 704 56 13
EL SALVADOR. Total coverage began 1 July 1956
1st Jul. 56-Jul. 57 2845568 11829 774 1510 0 2284 19. 31 ... ... 2nd Aug.57-Jul.58 2102503 42216 4212 4891 5 9108 21.I57 ... ... .. 3rd Aug.58-Jul.59 257050&d 59463 4384 9136 0 13520 22.74 315 17 4 4th Aug. 59-Jul. 60 2 534965 75177 3061 9566 0 12627 16.80 354 17 4 5th Aug. 60-Jan. 61 1332348 45731 2440 4575 1 7016 15.34 423 24 5
GUATEMALA. Total coverage began 1 August 1956
1st Aug. 56-Aug.57 c)712 788 22965 1255 3858 3 5116 22.28 ... .. 12 2nd Sep.57-Sep.58 1501742 47945 3909 6174 1 10084 21.03 77 11 8 3rd Oct. 58-Oct. 59 2 854461 124 519 3734 9 300 0 13034 10.47 362 30 10 4th Nov. 59-Nov. 60 3099988 126667 400 2967 0 3367 2.66 633 49 11
None.
... No information.
(a) From January-August 1959. (b) Estimated. (c) 6 months only. Year of
total . coverage
Date
l
l
L-CD13/3 (Eng.)
Page 19 Table 12 (Continued)
CASE DETECTION IN MALARIA ERADICATION PROGRAMS IN THE AMERICAS AT THE END OF 1960
No; of in- Average
YaohaNo;t of in- No. of positive slides No. of No. of No. of Year of habitants No. of llPrcnnotifica- evalu-
micro-total Date directly slides tion posts ators scopists coverage rotected xamined P. falci- P. malar- positive producings at end at end
byspray- P. vivax Total
Inga parum iae slides of year of year
ing _ _ _ _ _ __ I per month
HONDURAS. Total coverage began 15 July 1959
ist IJul.59-Jun. 60 1 25564385 82673 2 925 1 3 649 1 6 575 7.95 498 26 10 2nd Jul. 60-Jan. 61 1552 8111 765081 1169 2 5081 0 3 677 4. 81 867 29 12
MEXICO. Total coverage began 2 January 1957
1st Jan -Dec. 57 23 399463 175 080 514 3856 17 4387 2. 51 ... 55 42 2nd Jan. -Dec. 58 23 744095 403 573 487 2 779 24 3 290 0.82 1781 227 42 3rd Jan. -Dec. 59 29 119920 821598 443 2705 54 3202 0. 39 2842 441 58
4th Jan. -Dec. 60 25782 965 1212770 245 3251 73 3569 0.29 4 4 2 2a 573 63
NICARAGUA. Total coverage began 10 November 1958
1st Jan. -Dec. 59 2 3521911 38966 619 1 12561 0 1 1875 1 4.81 248 33 1 5
2nd IJan.-Dec. 60 25355351 740741 4217 3311 0 7528 | 10.161 382 38 7
PANAMA. Total coverage began 19 August 1957
1st Aug.57-Aug.58 67000d 69429 1717 1 ... ... 5634 8.11 198 15 7
2nd Sep. 58-Aug.59 6670951 93338 720 4196 5 4921 5.27 328 25 7 3rd [Sep.59-Aug.60 562514| 76984 751 4479 2 5232 6.80 419 25 5
4th Sep.60-Feb. 61 211087? 37080 228 1165 0 1393 3.76[ 355 25 6
PARAGUAY. Total coverage began 30 October 1957
1st Oct. 57-Oct. 58 747 541 135261 3 1 4961 1 500 3. 70
-2nd Nov.58-Oct.59 805232 11963 3 618 0 621 5.19| 101 13 9 3rd Nov. 59-Oct. 60 844 515 42396 5 1028 0 1033 2.44 159 16 9
PERU. Total coverage began 17 November 1957
1st Nov.57-Oct. 58 1867208 ... 77 527 29 652C ... ... 60 22 (d) Jan.-Dec. 59 [ 2775694 149791| 302 4265 51 4658c 2.85 1241i 66 31 (d) [Jan.-Dec. 60 3345726 3497801 256 3560 90 3906 1.121 1754 86 37
BRITISH HONDURAS. Total coverage began 4 February 1957
1st Feb.57-Jan.58 46825 282 148 56 52 256 12.0 .. ... 2
-2nd Feb.-Nov.58 ,94937 8081 321 226 46 593 7.34 94 11 3
3rd Apr. 59-Jun. 60 167846 12985 542 207 70 819 6.31 56 4 2
4th Jul. 60-Feb. 61 115309 9895 10 64 0 74 0.75 89 4 2
DOMINICA. Total coverage began 8 June 1959
1st Jun. 59-May 601 20830 5233 51 01 0 51 0.97 5 4 1 2nd IJun. 60-Feb. 611 85161 49501 4 01 0 4 0.08 8 5 1
GRENADA. Total coverage began 12 February 1957. Entered consolidation phase February 1960
1st Feb. 57-Jan. 58 52840 3230 123 0 0 123 3.81 ... 2 1 2nd Feb.58-Jan.59 5 196 10954 50 0 0 50 0.46 9 3 1 3rd Feb. 59-Jan.60 59795 5283 2 0 0 2 0.04 14 3 1
lstconsol. Feb.60-Jan.61 - 8076 0 0 0 0 0. 00 17 6 1
None.
No information.
Table 12 (Concluded)
CASE DETECT'ION IN IMALARIA ERADICAIION PROGRAMvS IN THE AMERICAS AT THE END OF 1960
CD13/3 (Eng.) Page 20
Year of total coverage
No.of in-habitants directly protected by
spray-ing
No. of slides exaniined
No. of positive slides
P. falcl- P. vivax malar- Total parum iae
_________
~
- -I - L--.~---- -.--- --_---cent
positive
Average No. of notifica-tion posts producing slides Der month
No. of evalu-ators at end of year
No. of
niicro-scopists at end of year
JAMAICA. Total coverage began 2 January 1958
1st Jan. -Dec. 58 1054894 56266 199 0 6 205 0. 36 ... 25 10 2nd Jan. 59-Sep. 59 1037284 27953 280 0 15 295 1. 06 121 30 9 3rd Oct. 59-Sep. 60 1964 4u3 140409 180 0 14 194 0. 14 176 22 9 4th Oct. -Dec. 60 331285 55898 14 0 3 17 0.03 191 36 9
ST. LUCIA. Total coverage began 16 January 1956. Entered consolidation phase October 1959
1st Jan. 56-Jan. 57 72364 4 689 63 0 9 72 1.54 ... -
-2nd Feb. 57-Dec. 57 96326 4 288 15 0 4 19 0.44 ...
-3rd Jan. 58-Feb. 59 113066 8378 29 0 9 38 0.45 7 3 1 4th Mar. -Sep. 59 62 324 8028 3 0 0 3 0.04 10 3 1 lst consol. Oct. 59-Sep. 60 - 13 716 0 0 0 0 0.00 18 5 I 2ndconsol. Oct. 60-Feb. 61 - 5091 0 0 0 0 0.00 23 7 1
SURINAM. Total coverage began 5 May 1958
1st May 58-Apr. 5 343 373 37 292 3 356 71 120 3 547 9.51 6 12 3 2nd May 59-Apr. 60 330 837 46158 1 665 7 272 1944 4.21 7 16 4 3rd May 60-Feb. 61 162 483 38 090 773 3 50 826 2. 17 8 26 5
TRINIDAD AND TOBAGO. Total coverage began 2 January 1958
1st Jan.-Dec.58 571953 2650P. 318I 5 8b ob 3 7 6b 1.42 ... |
-2nd Jan.-Dec.59 726681 101400 67 29 1 97 0.10 22 53 9 3rd Jan.-Dec.60 10850519 109000 10 3 0 13 0.01 16 74 7
None.
No Information. May 60-January 61. January-September 1958. January-October 1960. (a)
(b) (c)
Page 21 Table 13
COMPARATIVE RESULTS OF ACTIVE AND PASSIVE CASE DETECTION IN THE AMERICAS, 1959 AND 1960 Active case detection Passive case detection Country or other
political unit Number of slides Per cent Number of slides Per cent produced positive produced positive 1959 1960 1959 1960 1959 1960 1959 1960
: .
~~95116
_Argentina ... Bolivia ... Brazil (S"o Paulo) ... Colombia ... Costa Rica ... Dominican Republic .... Ecuador ... El Salvador ... Guatemala ... Honduras ...
Mexico ... Nicaragua ... Panama ... Paraguay ... Peru ... Venezuela ...
British Honduras ... Dominica ...
French Guiana ... Grenada ... Guadeloupe ... Jamaica ... Panama Canal Zone... St. Lucia...
Surinam ... Trinidad and Tobago....
1 8 4 9 4a
53 883
323637 31618 9 748b 29 626 8 839 11590 1 276 632 983 4 566 6 949 3311 31659 463 750 2851 2 572 4055 9 720 20 170 1 772 8 523 34 288 99 965 89 306 62121 86204 390 370 41732 6646 35 187 7019 47 252 137 892 590 22 418 13 240 32 486c 110 0 8 9c 365526d
4717 4560 2096d,E 4 109 8 940d' 153890
7 5 0d
5922 38 219 108 183
2. 8 7a 1.92
1.23 2.26 7. 4 9b 4.33 7.89 5.,66 8.54 0.27 8.41 2.82 3.50 0. 17 12.38 1.56 0.00 0.00 0.96 0.28 0.04 6.12 0.07 0.87 0.70 1.24 1.59 1.36 9.90 4.71 4.33 2.40 19.71 0.27 15.45 3.00 0. 6 2C 0. 7 4c 0. 2 6d
1.10 0.04 O. 62de 0.00 0. 02d 0.06 0.40d 0.00 2.11 0.01
3 374a 29 879 5651 20 918 17104b 69 351 62 456 96458 39 947 188 615 34 400 71712 8068 118 132 40 027 8456 229 1823 1640 574 19 556 12 825 4745 12 399 1 435 7 323 25 654 28 418 119 550 25911 13 691 84375 68362 82489 109 540 320 180 51656 63 859 8 057c 166034c 68022d
8 590 1591 1247d 4 124
7 1 0d
30 644
1 9 0 6d
7009 7177 817
__ _ _ _ _ _ _ ___ .1 J.I_ __ _
16. 6 9a 3.14
3.33 5.66 15. 9 4b
6.64 26.94 7. 50 10.74 0.78 4.33 6.72 6.51 0.30 7.88 2.62 0.88 0.12 0.00 0.91 0. 16 0.00 4.87 1.88 17.25 1.80 25.45 1.87 5. 53 35.66 8.80 14.20 2.73 5.01 0.36 7.87 6.37 9.25C 1.47C 0.32d 1.68 0.31 1.92d 0.00 0.00ood 0.14
1. 2 6d 0.00 2.66 0.37 - None.
... No information.
(a) August-December. (b) Excluding August. (c) (e) Malariometric survey.
CD13/3 (Eng.) Page 22
Successful field operations--whether spraying or case detection--depend on adequate financing. Table 14 shows national budgets for malaria eradication for the years 1959 and 1960, together with commitments for 1961, expressed in U.S. dollars for the sake of rough comparability. The budgets of countries in the attack phase generally remained high or increased slightly. It should be
remem-bered, however, that price inflation can lower the purchasing power of the sums allocated. When
supplies and equipment increase in price, an equal appropriation of funds can buy less. When price increases are accompanied by increases in the general level of wages, there is pressure to raise wages in malaria services so as to maintain the level of living of the staff and avoid their leaving to take up more remunerative employment (which latter, incidentally, also raises recruitment and training costs).
For countries entering or nearing the consolidation phase, the picture is somewhat different. Grenada cut its malaria budget by one-half from 1959 to 1960, maintaining the same level in 1961. In St. Lucia the current rate of expenditure is one-third of that in the attack phase. In Mexico, where large areas entered consolidation in 1961, the budget for 1961 is about 10 per cent below 1960 ex-penditures. Financial and budgetary policies differ from country to country, and in Jamaica and Surinam the entry of areas into the consolidation phase has not affected the national budget for mala-ria eradication. Since the passage of the historic Resolution XLII of the XIV Pan American Sanitary Conference (Santiago, 1954), the Governments of the Americas have responded by investing more than $125,000,000 in their malaria eradication programs, not counting the additional sums contri-buted by international or bilateral agencies.
II. SPECIAL TECHNICAL PROBLEMS
A. Epidemiological problems
A number of graphs based on surveillance operations are presented on the following pages to il-lustrate different types of response to malaria eradication efforts in the Americas.
Figure 1 illustrates the progress of eradication in Mexico, where the fourth year of the attack phase was completed in 1960, with transmission halted over wide areas and spraying suspended in 1961 in 62 per cent of the original malarious area of the country. The over-all decline in malaria is striking, though less so for vivax cases than for falciparum. This is due in part to the high
per-centage of relapses among the vivax cases. For example, epidemiological investigations of cases during the first two months of 1961 resulted in classifying as relapses or imported all cases studied in the areas of consolidation, and three-fourths of those studied in areas still in the attack phase. The problem of relapses is being attacked by intensified radical treatment of proven cases, and sometimes of suspected cases as well.
One factor in the apparent leveling-off of positivity in 1960 may be the considerable expansion of case finding activities during the year, chiefly in smaller villages and rural areas of Mexico, thus creating a disproportionate increase in slides from areas where malaria is relatively more persistent. Case detection found a peak of 600 cases in November 1960 on the basis of 209,000 slides
examined (0. 3 per cent positivity). Finally, there was definite persistence of transmission in
certain limited areas and localities. This tended to keep the country-wide average positivity from
falling in 1960. Selective group chemotherapy and larviciding are being used in persistent foci of
transmission, and it is expected that the attack will be successful.
Figure 2 illustrates the trend of malaria in El Salvador, a country which is confronted with the most difficult combination of technical problems in the Americas. The major problems are the following:.
1. Resistance of A. albimanus to both DDT and dieldrin in wide areas.
2. The use of dieldrin, which because of resistance proved ineffective in most areas, for 18 months before change was made to DDT, which is completely effective in some areas, partially in others.
3. High population density in highly malarious lowland areas.
CD13/3 (Eng.)
Page 23 Table 14
NATIONAI BUDGETS FOR MALARIA ERADICATION IN THE AMERICAS, 1959-1961 (in thousands of U. S. dollars)
Country or other Pate of initiation National budget National budget National
political unit of program ~[959 !1960 commitments
.~~~~~~~~~~19s
Argentina ... Bolivia ...
Brasilb... SAo Paulo... Colombia ... .Costa Rica ... .Cuba ...
Dominican Republic ....
.Ecuador ...
El Salvador... Guatemala ...
Haiti ... Honduras ...
Mexico ... Nicaragua ...
Panama ... Paraguay ...
Peru ...
Venezuela ...
British Guiana... British Honduras ...
Dominica ...
French Guiana g ...
Grenada ...
Guadeloupe ...
Jamaica ... ... Panama Canal Zone ... St. Lucia...
Surinam ... Trinidad and Tobago,..
Sept. 1959
Sept. 1958
Jan. 1959
1 Sept. 1958
8 Sept. 1958
15 July 1957
1960
1 July 1958
18 Mar. 1957
1 July 1956
1 Aug. 1956
Sept. 1958
Jan. 1958
2 Jan. 1957
10 Nov. 1958
19 Aug. 1957
30 Oct. 1957
15 Nov. 1957
1950
Jan. 1947
4 Feb. 1957
Jun. 1959
May 1948
Feb. 1957
Nov. 1955
Jan. 1958
1 Jul. 1956
2 May 1958
Jan. 1958
________________________ A. ____________________ I.
312
4 3 7a
1 310 645 2410 289
4 0C
348 505 543 485 (e) 145 5 540 232 433 202 704 7000 70f 36 8 20 78 502 50 35 175 293 327 420a 2 222 1 336 2925 275
2 6 0d
411 480 490 499 (e) 175 5 280 331 425 228 689 87 44 8 10 80 504 50 12 175 338 336
4 2 0a
2 373 1 197 2625 283 943 505 588 600 485 740 300 4 800 331 530 265 893 100 50 8 10 80 504 12 175 345
... No information.
(a) ICA counterpart funds.
(d) Second semester 1960.
spraying recommenced.
(b) Excluding S.o Paulo State. (c) Preliminary investigation.