A gravity approach of agricultural trade: The nexus
of the EU and African, Caribbean and Pacific countries
Jeremiás Máté Balogh
1*, Nuno Carlos Leitão
2,31Department of Agricultural Economics and Rural Development, Corvinus University of Budapest, Budapest, Hungary
2Polytechnic Institute of Santarém, Santarém, Portugal
3Center for Advanced Studies in Management and Economics, University of Évora, Évora, Portugal *Corresponding author: jeremias.balogh@uni-corvinus.hu
Citation: Balogh J.M., Leitão N.C. (2019): A gravity approach of agricultural trade: The nexus of the EU and African, Cari-bbean and Pacific countries. Agricultural Economics – Czech, 65: 509–519.
Abstract: The European Union (EU) is one of the biggest traders of agricultural products. In 2017, extra-EU agri-cultural trade accounted for 7.4% of the total EU international trade. Furthermore, Europe is the main destination for agricultural goods arriving from African, Caribbean and Pacific (ACP) trading partners. The paper analyses the effect of geographical proximity, cultural similarity, free trade agreements on bilateral agricultural trade as well as intra-industry trade between EU member states and its trading partners (intra and extra EU trade), employing gravity model for a period of 1996–2017. Regression results suggest that EU countries export more agricultural products to their common markets. In addition, the export costs of agricultural products are lower if the EU and its external trading partners are culturally similar; have the same religion or both have regional trade agreements. We found a moderate intra-industry trade between the EU and ACP countries at 18%. The results indicate rather inter-industry trade between EU and non-EU members, with a lower index level for ACP countries. A higher posi-tive impact is revealed on the agricultural import between ACP-EU countries than export.
Keywords: African, Caribbean and Pacific countries; agricultural trade; European Union; gravity model; intra-industry trade
The European Union (EU) is an important player in the world economy. Nowadays, the EU is deeply integrated into global markets. Moreover, the EU is one of the biggest exporters and importers of agricultural products in the world. The extra-EU trade in agri-cultural products accounted for 7.4% of the total EU international trade in 2017. Trade analysis of the ag-ricultural products is crucial for the EU Common Agricultural Policy (CAP) and trade policy, which also manages trade relations with non-EU countries. The EU trade of agricultural products is doubled between 2002 and 2017, equivalent to average annual growth of 5.4% (Eurostat 2018). According to the re-cent statistics, the USA was the main recipient of EU
agricultural exports (16%), followed by China (8%), Switzerland (6%), Japan, Russia (5%) and Norway (4%). Furthermore, Brazil and the United States (8%) were the main origins of EU agricultural imports fol-lowed by Norway, China (5%), Argentina and Ukraine (4%). China and the United States are ranked among the top four biggest agricultural trading partners of the EU (Eurostat 2018).
Trade plays a crucial role in the economic integra-tion and growth of African, Caribbean and Pacific (ACP) countries (EC 2019). Therefore, the EU in-tends to support trade diversification by shifting ACP countries’ reliance on commodities to higher-value products via the so-called Economic Partnership
Agreements1 (EPAs). The majority of ACP countries are either implementing an EPA or have concluded EPA negotiations with the EU (EC 2018). Consequently, EU agricultural export might have less trade barrier to ACP countries and vice versa comparing to other non-EU countries. Furthermore, the EU trade with ACP countries represents more than 5% of EU imports and exports while the EU is also the main destination for agricultural goods of ACP countries (EC 2018).
The gravity equation is evidence for the relation-ship between the size of economies, their distances and the amount of their trade. The gravity equa-tions have been used to refer to a variety of different specifications for determining bilateral trade flows (Head and Mayer 2013). The intra-industry trade (IIT) is a commonly accepted tool for analysing trade pat-terns in the international literature (Nilsson 1997; Qasmi and Fausti 2001; Sharma 2002; Leitão 2012; Jámbor 2014; Łapinska 2014; Onogwu et al. 2014; Jámbor and Leitão 2016) and used in gravity models.
However, the EU-ACP trade relation is not negligible, in turn, limited articles were already published in in-ternational trade literature investigating agricultural trade between the EU and non-EU or ACP countries explored by gravity models (Persson 2008; Bourdet and Persson 2010; Cipollina et al. 2013). In addition, we cannot find an up-to-date study referring to the ac-tual pattern of the agricultural trade between the EU and ACP countries.
Therefore, the research considers the costs of ag-ricultural trade of the EU-27 countries and its trad-ing partners, focustrad-ing on ACP relations. Moreover, it investigates the effect of geographical distances, cultural similarity, EU membership, EU-ACP relations and the role of regional trade agreements using panel econometrics, between 1996 and 2017.
The paper has multiple contributions to the litera-ture. First, it employs a large sample gravity model, assesses the intra-industry trade (IIT) within the EU member states as well as between EU and non-EU, EU-ACP countries. Second, the paper aims to discover the trade advantage or disadvantage in EU-ACP rela-tions. Third, we revisit the empirical works of Helpman (1987), Hummels and Levinsohn (1995) to consider the countries characteristics as explanatory variables of intra-industry trade (IIT). These variables have theoretical support on classic models of Krugman
(1979), Lancaster (1980), Helpman and Krugman (1985). Finally, it investigates the trade costs with spe-cific insight into the EU-ACP relationships.
MATERIAL AND METHODS
The assumptions of the Newton Laws applied to the gravitational model of trade have been im-plemented over the past decades. The empirical gravity studies usually evaluate trade costs between two countries, demonstrating that there is a multi-plicative association between trade and countries’ GDP as well as an inverse relationship between trade and bilateral geographic distance (Tinbergen 1962; Pöyhönen 1963; Caves 1981). The most recent em-pirical studies (Braha et al. 2017; Balogh and Jámbor 2018) show that common language, trade agreements, cultural and historical features promote bilateral trade and reduce trade costs. Furthermore, Gould (1994), Grin (1994), Breton (1999) prove that the com-mon official language, migrations, comthat the com-mon borders, geographical proximity are supporting international trade. Thus, the common language and the historical and cultural background of countries are impor-tant explanatory factors of the global trade. Moons and Van Bergeijk (2013) point out that the common language spoken allows eliminating trade barriers and expanding bilateral trade relations between economies with linguistic, cultural or historical similarities. Anderson (1979), Helpman and Krugman (1985), Hummels and Levinshon (1995), Rauch (1999) conclude that the gravitational model is explained through monopolistic competition, with increasing returns to scale and economies of scale.
Relevant literature
The empirical study of Hatab et al. (2010) researched the determinants of agricultural exports for the Egyp-tian case, using panel techniques (OLS, Fixed Effects, Random Effects) for the period 1994–2008. The Alba-nian agricultural exports were investigated by Braha et al. (2017) applying Poisson Pseudo-Maximum Like-lihood estimation technique considering the period 1996 to 2013. Balogh and Jámbor (2018) evaluated the impact of culture, common langue and free trade agreements in the wine industry. Recently, Port wine
1The history of Economic Partnership Agreements is dating back to the Cotonou Agreement. Economic Partnership
Agreements are WTO-compatible agreements focusing on ACP development, taking account of their socio-economic circumstances to help ACP countries benefit from the agreements.
exports were investigated by Gouveia et al. (2018) using a gravity approach with Hausman-Taylor estimator.
Persson (2008) analysed the effects of trade facilita-tion for ACP countries and the Economic Partnership Agreements of the EU. Significant negative trade ef-fects are found for the transaction costs of most EPA groups. Cipollina et al. (2013) studied the EU trade policies and suggested that preferences have only a minor impact (3% of EU imports) on trade.
The literature also mentions some studies that evalu-ate the two-way trade and intra-industry trade of ag-ricultural products (Jámbor 2014; Łapinska 2014). Moreover, the empirical studies on agri-food intra-industry trade (Pelzman 1977; McCorriston and Shel-don 1991; Hirschberg et al. 1994; Qasmi and Fausti 2001; Sharma 2002; Onogwu 2014) have supported the theoretical models of Krugman (1979), Lancas-ter (1980), Eaton and Kierzkowski (1984), Hummels and Levinshon (1995).
The agricultural and food industry between Poland and the European Union was investigated by Łapinska (2014) for the period 2002–2011. IIT was employed as dependent while income per capita differences, geographical distance, European Union countries, common language, and the trade imbalance as ex-planatory variables. The econometric results suggest that common language, EU membership have a positive effect on IIT. By contrast, income per capita differ-ences and trade imbalance are negatively correlated with IIT. Jámbor (2014) examined the determinants of horizontal and vertical IIT applied in agriculture between EU-27 and the New Member States. The au-thor concluded that the EU accession has a positive effect on horizontal and vertical IIT.
Despite the importance of EU-ACP trade relation-ships, only limited studies are available in international trade literature (Persson 2008; Bourdet and Persson 2010; Cipollina et al. 2013) that investigates EU agri-cultural trade by gravity models considering the ACP trading partners.
Methodology
Regression models frequently employ OLS or Pseu-do-Poisson maximum likelihood (Santos and Tenrey-ro 2006, Braha et al. 2017, and Balogh and Jámbor 2018). In this study, we employ a standard gravity model for a sample of EU-27 agricultural trade and 242
destina-tion countries, for the period 1996–2017, using Pseudo-Poisson maximum likelihood (PPML) estimation.
The standard formula of gravity equation is calculat-ed as follows (Bergstrand 1989; Anderson and van Win-coop 2003; Blanes 2005; Braha et al. 2017; Gouveia et al. 2017; Balogh and Jámbor 2018):
1 2
0 3 ij ij ij GDPi GDPj TRADE Dist (1)where TRADEij is the trade flow from country i to country j; β0 isa constant of the gravity equation; GDPi captures exporter’s GDP; GDPj represents the im-porter country’s GDP; Distij denotes the geographical distance; εij represents the error term.
Log-linear form of the gravity Equation (2) is cal-culated by taking the natural logarithms of these variables (Bacchetta et al. 2012):
0 1 2
LnTRADEij LnGDPi LnGDPj 3LnDistij ij
(2)
In addition to the classical variables (importer and ex-porter GDP, and geographic distance), researchers have introduced additional factors to the gravitational equations such as islands-landlocked countries, com-mon borders, comcom-mon language or cultural features (past colonial history, common religion) and free trade agreements. La Porta et al. (1999), Kang and Fratianni (2006), Linders and de Groot (2006), Balogh and Jám-bor (2018) supported the assumptions of this variable on international trade.
In the past decades, the analyses of intra-industry trade (IIT) received considerable research attention in the literature. IIT refers to the trade of similar products belonging to the same industry, used when the same types of goods are both imported and ex-ported (Grubel and Lloyd 1975; Bergstrand 1983; Handjiski et al. 2010).
Grubel and Lloyd (1975) proposed an index for intra-industry trade, calculated as follows:
1 – – /
i i i i i
GL X M X M (3)
where GL denotes the Grubel–Lloyd index; Xi denotes the export; Mi represents the import of good i.
The value of the GL index varies between 0 and 1. 0 indicates complete inter-industry trade2 and 1
sig-2Inter-industry trade is defined as trade between two countries where the goods are from different sectors. In contrast,
nals complete intra-industry trade. The index also can be multiplied by 100 to obtain values in percent.
Data and econometric specifications Based on the empirical evidence of gravity literature the following hypotheses are tested here:
H1: Standard gravity hypothesis applies for EU extra and EU-ACP agricultural trade.
In empirical gravity models, larger countries trade more, therefore, the size of economies (GDP) have a positive effect on trade flow (Bacchetta et al. 2012). The literature suggests that trade costs increase with geographical distances (Bacchetta et al. 2012; Head and Mayer 2013). If the trader country is landlocked that makes the trade costs higher (Bacchetta et al. 2012) since the sea access enables cheaper water transport compared to land transport (rail and road transport). Trade costs are lower in those countries that are similar culturally because they know better each other’s business practices (Hummels and Lev-inshon 1995; Bacchetta et al. 2012; Braha et al. 2017; Balogh and Jámbor 2018).
H2: The EU export more agricultural products to cul-turally related destination countries since the cultural similarity reduces trade costs.
The European Common Market guarantees the free movement of goods, capital, services, and labour within the European Union. Consequently, trade within the EU might be more advantageous and trade costs are lower within the EU.
H3: The European Common Market is more beneficial for intra-EU agricultural trade than extra EU trade.
The empirical studies of Braha et al. (2017), describe a positive impact of the European Common Market on agricultural trade. The EU with the common mar-ket became a single market and a customs union between its member states. Various research on international trade validates that free trade agreements promote trade flows (Łapinska 2014; Jámbor and Leitão 2016).
H4: Free trade agreements between the EU and non-EU countries are encouraging agricultural trade and re-duce the costs of trade.
Lower trade barriers stimulate trade by reduc-ing trade costs (Bacchetta et al. 2012) and ease ex-porter’s access to destination markets. Furthermore, the EU is a major trading partner of ACP countries and the main destination for agricultural goods from ACP countries. The Economic Partnership Agreements (EPAs) support trade diversification by shifting ACP countries’ reliance on commodities to higher-value products (EC 2018). Consequently, EU agricultural export has less trade barrier to ACP countries than other non-EU countries.
H5: The costs of trade are lower in the case of agri-cultural products shipped from EU to ACP countries. In this research, we applied strongly balanced panel data of the agricultural trade of the EU-27 Member States and their trading partners, between 1996–2017. The dependent variable comes from EU-27 bilateral agricultural trade data of World Bank (2018a) Harmonised System database in aggregated category (agricultural products including 678 ag-gregated products for 010111–530290 category), used in a level form.
The model employs economic size (exporter’s and importer’s GDP), geographical distances (short-est distances between capital cities), cultural dis-tances (common official language, common religion, island-landlocked dummies), free trade area, EU mem-berships, ACP countries as explanatory variables. The PPML estimation method (Santos and Tenreyro 2006) was applied to estimate the gravity equation for the EU agricultural trade and IIT in Equations (4–5).
In Equations (4–5), EU agricultural tradeij vari-able represents the agricultural export from EU-27 to its trading partner, the agricultural import from trading partner to EU-27, and EU agricultural total trade (agricultural export plus import of the EU-27 member states), zero trade flows are included.
In the model, dependent variables (agricultural ex-ports, imex-ports, trade and GL index) are derived from the World Bank (2018a). The GL index is employed at level forms in percentage (varies between 0 and 100) measuring IIT. lnGDPexp is the logarithm of the ex-porter’s GDP (of EU member states expressed
in cur-(4)
1 2 3 4 5
ln ln ln ij i j ij _ ij ij
EU agricultural trade GDPexp GDPimp dist comlang off contig
6comreligij 7landlockedij 8RTAij 9EU O_ ij 10EU D_ ij 11ACP uij ij
(5)
1 2 3 4 5 6
ln ln ln ij i j ij _ ij ij ij
GL index GDPexp GDPimp dist comlang off contig comrelig
7landlockedij 8RTAij 9EU O_ ij 10EU D_ ij 11ACP uij ij
rent USD), lnGDPimp illustrates the logarithm of GDP for importer country (in current USD) including EU and non-EU members. The lndist measures the simple distance between the capital cities of traders in kilome-tres. The common official language (comlang_off) equals to 1 if trader countries have common official primary language, 0 otherwise. Contiguity (contig) equals to 1 if both traders have common borders. The landlocked variable is 1 if both traders are landlocked, 0 oth-erwise. Common religion (comrelig) takes 1 if both countries have a common main religion, 0 otherwise. RTA is a dummy that equals to 1 if both countries have regional trade agreements, 0 otherwise. The EU membership is measured by EU_O (1 if origin country is an EU member in the given year) and EU_D (1 if a des-tination country is an EU member in the given year). Finally, ACP (EU_TO_ACP) is 1 if the agricultural trade is realised between the EU and ACP countries. The set of bilateral dummies are derived from CEPII (2018); the detailed description (Table S1) and sum-mary statistics for each variable (Table S2) [Tables S1–2 in the electronical supplementary material (ESM); for ESM see the electronic version].
Pattern of EU trade
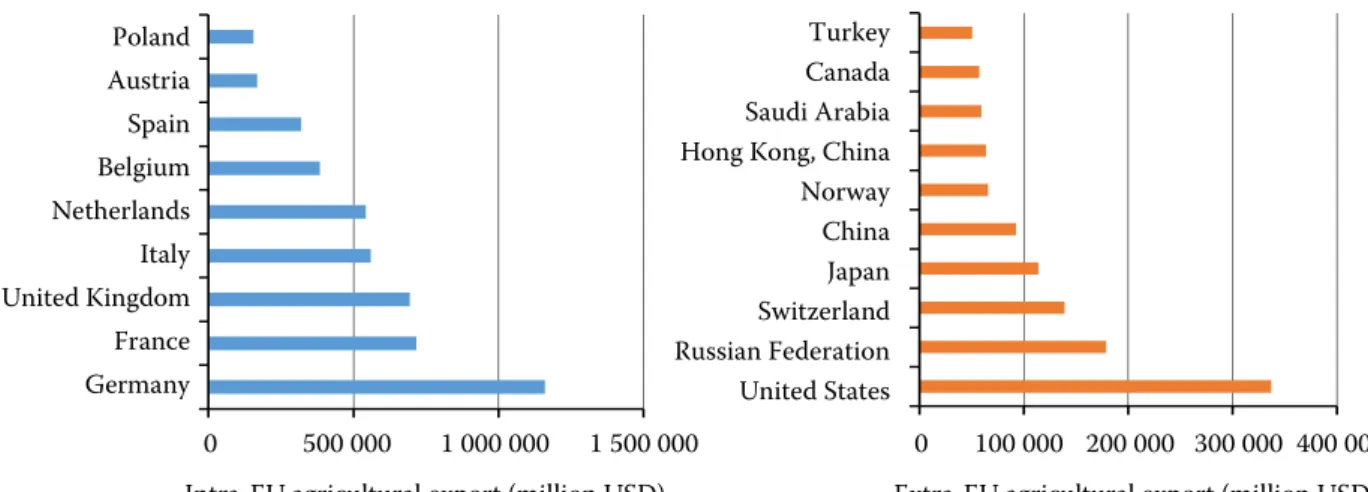
Regarding the pattern of the EU bilateral agricul-tural trade (Figure 1), Germany, France, the UK, Italy, and the Netherlands realised the highest amount of ag-ricultural export during the analysed period within the EU, emphasising the importance of intra-EU trade.
Moreover, the older EU member states (Germany, France, the UK, Italy, and the Netherlands) can be considered as the top destinations of the EU-27
ag-ricultural products, underlining the trade advantage of the European Common Market. On the other hand, non-EU countries are also comprised in the sample (as EU trade destinations) of which the USA, Russia, Switzerland, Japan, and China were the most signifi-cant considering EU extra trade. Among these trading partners, larger countries (e.g. Germany, France, USA, Canada, and China) accounted for higher trade flows for agricultural products predicting the validity of standard gravity hypothesis (larger countries trade more).
Figure 1 indicates that the share of the observation comprising EU to ACP export destination countries reached 24% in the sample, between 1996 and 2017, by contrast, its share of export in terms of value, was only 1.65% compared to the value of total EU-27 agricultural export, during the analysed period. In ad-dition, the EU imported only 3.3% of its agricultural products from ACP countries in value. The top ACP export destinations of EU agricultural products were South Africa, Angola, Nigeria, Senegal and Cote d’Ivoire (Ivory Coast).
In Table 1, past colonial trade relationship is ob-served between the major EU agricultural exporters and its top trading partners (e.g. former British colo-nies: South Africa, Nigeria, Ghana or former French colonies: Senegal, Cote d’Ivoire, Cameroon, Benin, Dominican Republic, Gabon).
To analyse the pattern of EU trade, intra-industry trade (IIT) was also discovered by GL index. Regard-ing intra-EU trade (Figure 2), the GL index reached 52.8% on average, with the highest value recorded in Germany (65%) and the lowest in Malta (19%). In other words, most of the EU members favour
intra-Germany 0 500 000 1 000 000 1 500 000 0 100 000 200 000 300 000 400 000 France United Kingdom Italy Netherlands Belgium Spain Austria Poland
Intra-EU agricultural export (million USD)
United States Switzerland China Hong Kong, China Canada Saudi Arabia Norway Japan Russian Federation Turkey
Extra-EU agricultural export (million USD)
Figure 1. Intra and extra European Union (EU) agricultural export, top 10 destinations of EU, mean, 1996–2017 Source: own calculation based on World Bank (2018a) and CEPII (2018)
industry agricultural trade within the Common Eu-ropean Market (GL > 50%) indicating trade between similar agricultural products.
By contrast, in terms of extra EU trade (EU to non-EU countries), the GL index reached only 21% on average. With Canada (61%) in the first place followed by the USA (56%) while in indices of Christmas Island and Western Sahara indicates complete inter-industry trade (0%).
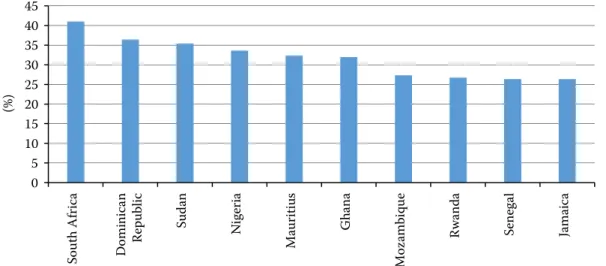
Moving toward ACP destination countries (Figure 3), we have found a moderate GL index for ACP countries at 18% on average, with the highest level for South
Africa (41%), followed by Dominican Republic, Sudan, Nigeria and Mauritius (GL < 32%). These figures sug-gest that between EU and non-EU members (GL = 25%) rather inter-industry trade is realized, with a lower index level for ACP countries (GL = 18%). These sta-tistics reveal that inter-industry trade (instead of IIT) dominates the EU-ACP trade relation. It indicates the EU members exchanged mainly similar (processed) agricultural products with each other. By contrast, ACP countries were able to exchange mostly differ-ent agricultural products (raw materials) with the EU Table 1. European Union (EU) and African, Caribbean and Pacific (ACP) agricultural trade relations, top 10 exporters and its destinations, in the sample, 1996–2017
Top exporters EU to ACP export (million USD) Top destinations EU to ACP export (million USD)
France 31 989 South Africa 19 958
Netherlands 22 572 Angola 14 982
United Kingdom 14 609 Nigeria 14 765
Portugal 10 362 Senegal 7 262
Germany 10 284 Cote d’Ivoire 7 091
Belgium 10 199 Ghana 4 823
Spain 8 518 Cameroon 4 507
Italy 7 908 Benin 4 322
Ireland 6 591 Dominican Republic 4 009
Denmark 3 180 Gabon 3 611
Source: own calculation based on World Bank (2018a)
0 10 20 30 40 50 60 70 G er m an y Be lg iu m Ita ly Bu lg ar ia Li th ua ni a Po la nd A us tr ia U ni te d K in gd om C ze ch R ep ub lic Sl ov ak R ep ub lic D en m ar k H un ga ry Fr an ce Ro m an ia Po rt ug al N et he rla nd s G re ec e Sp ai n Sw ed en La tv ia Fi nl an d Sl ov en ia C ro at ia C yp ru s Es to ni a Ir el an d Lu xe m bo ur g M al ta (%)
Figure 2. Grubel–Lloyd (GL) index (mean) calculated for European Union (EU) 27 intra agricultural trade (EU to EU), 1996-2017
than they imported (processed products) from the EU, realizing only moderate grains from trade partnerships in value, in line with Cipollina et al. (2013).
RESULTS AND DISCUSSION
Table 2 presents the gravity regression results for EU (comprising EU and non-EU) agricultural export, import, trade, and GL index including zero trade flows, applying trade in absolute value and GL index in percent, using Pseudo-Poisson maximum likeli-hood (PPML).
Based on the estimations, the size of exporter’s GDP (of the EU member states) and the importer’s GDP af-fect positively while geographical distance, and land-locked attributes negatively related to EU agricultural trade confirming standard gravity hypothesis for ag-ricultural products (H1). Braha et al. (2017), Hatab et al. (2010), Balogh and Jámbor (2018) give support to our results.
The estimated distance coefficients of EU agri-cultural trade (–0.2 and –0.74) are closely related to the elasticity of trade to distance that is usually between –0.7 and –1.5 in empirical gravity models in line with Bacchetta et al. (2012).
We found a negative impact of geographical distance on intra-industry trade in line with Łapinska (2014), Jámbor (2014) revealing that the intra-industry trade increases while the geographical distance decreases between trade partners. The classic empirical works of Loertscher and Wolter (1980), and Balassa and Bau-wens (1987) give support to our result. The positive
effect of common official language and religion on trade flow are revealed in all models indicating the reduc-tion of agricultural trade costs (H2) along with Gould (1994), Grin (1994), Breton (1999), Linders and de Groot (2006), Balogh and Jámbor (2018). Moreover, the studies of Lafay et al. (1999), and Zhan et al. (2005) also found a positive effect on intra-industry trade.
The agricultural trade within the EU is more advanta-geous if the origin and the destination countries both are already accessed to the EU confirming the Euro-pean Common Market hypothesis (H3). If we compare the estimation for agricultural export and import, we can observe that in terms of import (0.484), the ACP countries have a higher positive impact on EU trade than agricultural export from EU to ACP (0.225). It indicates that the EU agricultural export to ACP has a moderate effect (lower trade costs) than EU im-port from ACP countries (ACP exEU im-port to EU).
In summary, these models can prove the hypoth-esised relationship (common cultural, historical and geographical link) between the EU with their non-EU, and ACP trading partners in terms of agri-cultural trade (H1 and H2). The European Common Market hypothesis is supported (H3). The results also confirm the positive role of the regional trade agree-ments (RTA) in the EU and non-EU relations (H4).
Furthermore, the estimations suggest significant pos-itive common trade relations between the EU and ACP countries emphasizing the importance of Economic Partnership Agreements (EPAs) and confirming H5. On the other hand, regarding the agricultural prod-ucts, this trade relationship is more beneficial for EU
0 5 10 15 20 25 30 35 40 45 So ut h A fr ic a D om in ic an R ep ub lic Su da n N ig er ia M au rit iu s G ha na M oz am bi qu e Rw an da Se ne ga l Ja m ai ca (%)
Figure 3. Grubel–Lloyd (GL) index calculated for European Union (EU) to African, Caribbean and Pacific (ACP) agri-cultural trade, top 10 ACP destinations of the EU, 1996–2017
member states (with lower export costs, estimated co-efficient at 0.225) compared to ACP countries (import coefficient at 0.484) (Table 2). More specifically, the EU is able to export agricultural products to ACP at lower trade costs than import from the ACP. In conclusion, the EU provides a trade advantage for ACP countries, however, this trade advantage is only moderate in terms of agricultural import, more favourable for EU-ACP export than ACP-EU trade.
CONCLUSION
Trade analysis of the agricultural products is essential for the EU Common Agricultural Policy and for com-mon trade policy, which manages EU trade relations with non-EU countries.
The paper presented quantitative research of the grav-ity model, and investigated the characteristics of the cross-border trade flows of agricultural products, Table 2. Estimation results for European Union agricultural export
Variables EU_agri_export(1) EU_agri_import(2) EU_agri_trade(3) GL_index(4)
ln_exp_GDP (0.000)0.715*** (0.000)0.776*** (0.000)0.744*** (0.000)0.176*** ln_imp_GDP (0.000)0.724*** (0.000)0.647*** (0.000)0.683*** (0.000)0.130*** ln_dist_cap –0.741*** –0.376*** –0.563*** –0.195*** (0.000) (0.000) (0.000) (0.000) landlocked (1.68e-05)–0.388*** –0.133*(0.0587) –0.259***(0.0006) –0.0340(0.133) contig 0.731*** 0.696*** 0.707*** 0.00576 (0.000) (0.000) (0.000) (0.698) comlang_off (1.28e-06)0.188*** (0.000)0.372*** (0.000)0.279*** (0.000)0.202*** comrelig 0.215*** 0.639*** 0.441*** –0.0572*** (2.36e-08) (0.000) (0.000) (0.000)
RTA (9.40e-11)–0.206*** (5.04e-09)–0.227*** –0.220***(0.000) (0.000)0.156***
EU_O 0.540*** 0.130*** 0.330*** –0.143*** (0.000) (0.000459) (0.000) (0.000) EU_D (0.000)0.675*** (0.000)1.178*** (0.000)0.916*** (0.000)0.205*** EU_TO_ACP 0.225*** 0.484*** 0.402*** 0.0313** (6.19e-08) (0.000) (0.000) (0.0140) Constant –28.81***(0.000) –31.09***(0.000) –29.11***(0.000) –7.527***(0.000) Observations 94 738 94 738 94 738 78 687 Pseudo R2 0.690 0.681 0.756 0.219
*** p < 0.01, ** p < 0.05, * p < 0.1; p-values in parentheses; agri – agricultural; exp – export; imp – import; GDP – gross domes-tic product; GL –Grubel–Lloyd; EU – European Union; dist_cap – distance between capital cities; landlocked – landlocked countries; contig – contiguity; comlang_off – common official language; comrelig – common religion; RTA – Regional Trade Agreements; EU_O – European Union’s country as origin of trade; EU_D – European Union’s country as destination of trade;
EU_TO_ACP – European Union’s country exporting to a country in African, Caribbean and Pacific region
with specific devotion to the EU-ACP relationships. This research also considers the cross-country analysis to explain the determinants of intra-industry trade (IIT). To analyse the pattern of EU bilateral trade, IIT was dis-covered by GL index. The result for the GL index re-vealed a high intra-industry trade between EU member states and inter-industry trade between EU and non-EU members, with a lower index level for ACP countries (18%). However, the share of ACP countries consists of one-quarter of the EU agricultural export partners, the EU import from ACP is more expensive (trade costs are higher) than EU export to ACP.
Furthermore, we analysed the hypothesised effects of cultural, geographical proximity, free trade agree-ments, EU membership on the trade costs of the EU agricultural products. Econometric models were cal-culated for all EU export destinations (EU, and non-EU countries), employing a panel gravity model from 1996 to 2017. Furthermore, it investigated the role of ACP countries in the EU trade.
Results suggest that standard gravity hypothesis also applies to the EU agricultural trade. The findings of the article confirmed that more agricultural trade can be realised between larger EU and non-EU coun-tries, the transport costs increase in line with the geo-graphical distance and it is higher for landlocked trading partners (lack of sea access).
The costs of the EU agricultural trade could be lower if trading partners have common cultural relations, or both are the members of the EU or entered into a regional trade agreement.
However, the EU provides an advantage for ACP countries, from the perspective of the ACP countries this trade advantage remains moderate (higher trade costs for ACP) during the analysed period.
The IIT equation allows us to infer important consid-erations. The size of markets measured by per capita income is expected a positive signal (Greenaway et al. 1995; Jámbor and Leitao 2016). The result shows that EU-ACP relations present dimension to differ-entiate products. The coefficients of geographical distance and trade agreements show that commer-cial relations allow the reduction of transport costs between trading partners. Our results find empirical support in the studies of Badinger and Breuss (2008), and Blanes (2005). Moreover, the common language promotes intra-industry trade, allowing for lowering transaction costs.
In terms of policy recommendation, our results suggest that in ACP-EU relations, the EU has more benefits from agricultural trade (lower export costs
for EU to ACP trade, selling processed products) than ACP countries (higher import costs for ACP trade to EU, importing raw materials), therefore, the EU should provide more market opportunities for ACP region to make trade more mutual. Moreover, ACP-EU relations should strengthen commercial and industrial policy agreements in order to proliferate innovation and differentiation of agricultural products. The states should support the most competitive companies in the agricultural sector, thus strengthening the agricultural cluster. The contribution of the paper to the empirical literature is multiple. First, it adopts a large sample of EU-27 agricultural industry. Second, the results are robust for the European Union and also for ACP countries. Third, it revealed a significant trade ad-vantage between the EU and ACP countries in term of agricultural products. Finally, the gravity model supported our specifications of the EU common market hypothesis, regional trade agreements, and the EU-ACP trade hypothesis.
REFERENCES
Anderson J.E., van Wincoop E. (2003): Gravity with gravi-tas: A solution to the border puzzle. American Economic Review, 93: 170–92.
Anderson J.E. (1979): A theoretical foundation for the grav-ity equation. American Economic Review, 69: 106–116. Bacchetta M., Beverelli C., Cadot O., Fugazza M.,
Gre-ther J.-M., Helble M., Nicita A., Piermartini R. (2012): A Practical Guide to Trade Policy Analysis. World Trade Organisation and United Nation, Switzerland: 106. Badinger H., Breuss J. (2008): Trade and productivity:
An in-dustry perspective. Empirica, 35: 213–231.
Balassa B., Bauwens L. (1987): Intra-industry specializa-tion in a multi-country and multi-industry framework. The Economic Journal, 97: 923–939.
Balogh J.M., Jámbor A. (2018): The role of culture, language and trade agreements in global wine trade. AGRIS on-line Papers in Economics and Informatics, 10: 17–29. Bergstrand J. (1983): Measurement and determinants
of in-tra-industry international trade. In: Tharakan P. (ed.): Intra-Industry Trade, Empirical and Methodological Aspects. North-Holland, Amsterdam: 201–253.
Bergstrand J.H. (1989): The generalized gravity equation, monopolistic competition and the factor-proportions theory in international trade. The Review of Economics and Statistics, 71: 143–53.
Bourdet Y., Persson M. (2010): Completing the EU customs Union. The effects of trade procedure harmonization IFN. Working Paper No. 848.
Breton A. (1999): Exploring the Economics of Language. New Canadian Perspectives, Canadian Heritage, Ottawa. Blanes J.V. (2005): Does immigration help to explain intra-industry trade? Evidence for Spain. Review of World Eco-nomics, 141: 244–270.
Braha K., Qineti A., Cupák A., Lazorčáková E. (2017): De-terminants of Albanian agricultural export: The gravity model approach. AGRIS on-line Papers in Economics and Informatics, 9: 3–21.
Caves R. (1981): Intra-industry trade and market struc-ture in the industrial countries. Oxford Economic Papers, 33: 203–223.
Cipollina M., Laborde D., Salvatici L. (2013): Do preferen-tial trade policies (actually) increase exports? An analysis of EU trade policies. In: Proceedings Agricultural & Ap-plied Economics Association’s AAEA & CAES Joint Annual Meeting, Washington, DC, Aug 4–6, 2013.
CEPII (2018): GeoDist and Language database. Available at www.cepii.fr (accessed Sept 10, 2014).
Eaton J., Kierzkowski H. (1984): Oligopolistic competition, product variety and international trade. In: Kierzkowki H. (Eds): Monopolistic Competition and International Trade. Oxford University, Oxford, USA.
Eurostat (2018): Extra-EU trade in agricultural goods. Avail-able at ec.europa.eu/eurostat/statistics-explained/index. php/Extra-EU_trade_in_agricultural_goods (accessed Oct 5, 2018).
European Commission (EC) (2018): Economic partnerships. EU trade policy and ACP countries. Available at ec.euro-pa.eu/trade/policy/countries-and-regions/development/ economic-partnerships/ (accessed Oct 5, 2018).
European Commission (EC) (2019): International coopera-tion and development. Building partnerships for change in developing countries. Available at ec.europa.eu/euro-peaid/regions/african-caribbean-and-pacific-acp-region/ acp-multi-country-cooperation/trade-relationship_en (accessed June 19, 2019).
Greenaway D., Hine R., Milner C. (1995): Vertical and hori-zontal intra-industry trade: A cross-industry analysis for the United Kingdom. The Economic Journal, 105: 1505–1518. Gouveia S., Rebelo J., Gomes L.L. (2018): Port wine exports:
A gravity model approach. International Journal of Wine Business Research, 30: 218–242.
Gould D. (1994): Immigrant links to the home country: em-pirical implications for US bilateral trade flows. Review of Economics and Statistics, 76: 302–316.
Grin F. (1994): The economics of language: Match or mis-match? International Political Science Review, 15: 25–42. Grubel H., Lloyd P. (1975): Intra-industry trade. The Theory
and Measurement of International Trade in Differentiation Products. The Macmillan Press, London.
Handjiski B., Lucas R., Martin P., Guerin S.S. (2010): Enhanc-ing Regional Trade Integration in Southeast Europe. World Bank Publications, No. 185.
Hatab A.A., Romstad E., Huo X. (2010): Determinants of Egyptian agricultural exports: A gravity model approach. Modern Economy, 1: 134–143.
Head K., Mayer T. (2013): Gravity equations: Workhorse, toolkit, and cookbook. CEPII Working Paper (Centre d’études prospectives et d’informations internationales), No. 2013–27.
Helpman E., Krugman P. (1985): Market Structure and For-eign Trade. Harvester Wheatsheaf, Brighton, United Kingdom.
Helpman E. (1987): Imperfect competition and international trade: Evidence from fourteen industrial countries. Journal of Japanese and International Economies, 1: 62–81. Hirschberg J., Sheldon I., Dayton J. (1994): An analysis
of bi-lateral intra-industry trade in the food processing sector. Applied Economics, 26: 159–167.
Hummels D., Levinsohn J. (1995): Monopolistic compe-tition and international trade: Reconsidering the evi-dence. The Quarterly Journal of Economics, 110: 799–836. Krugman P. (1979): Increasing returns, monopolistic
com-petition and international trade. Journal of International Economics, 9: 469–79.
Jámbor A. (2014): Country-specific determinants of hori-zontal and vertical intra-industry agrifood trade: The case of the EU new member states. Journal of Agricultural Economics, 65: 663–682.
Jámbor A., Leitão N.C. (2016): Industry-specific determi-nants of Vertical intra-industry trade: The case of EU new member states’ agri-food sector. Post-Communist Econo-mies, 28: 34–48.
Kang H., Fratianni M. (2006): International trade, OECD membership, and religion. Open Economies Review, 17: 493–508.
Lafay G., Herzog C., Freudenberg M., Unal-Kesenci D. (1999): Nations et Mondialisation. Economica, Paris, France. La Porta R., Lopez-de-Silanes F., Shleifer A., Vishny R. (1999):
The quality of government. Journal of Law, Economics and Organization, 15: 222–279.
Lancaster K. (1980): Intra-industry trade under perfect mo-nopolistic competition. Journal of International Econom-ics, 10: 151–76.
Łapinska J. (2014): Determinants of intra-industry trade in agricultural and food products between Poland and EU countries. DANUBE: Law and Economics Review, 5: 159–172.
Leitão N.C. (2012): GMM estimator: An application to in-tra industry to in-trade. Journal of Applied Mathematics, 12: 857824.
Linders G.M., de Groot H.L. (2006): Estimation of the grav-ity equation in the presence of zero flows. Discussion Paper 2006–072/3. Tinbergen Institute.
Loertscher R., Wolter F. (1980): Determinants of intra-indus-try trade: Among countries and across industries. Review of World Economics, 116: 289–293.
McCorriston S., Sheldon M. (1991): Intra-industry trade and specialization in processed agricultural products: The case of the USA and the EC. Review of Agricultural Economics, 3: 173–184.
Moons J., Van Bergeijk V.S. (2013): Economic diplomacy works: A meta-analysis of its effect on international eco-nomic flows. MAER Colloquium, 1–28.
Nilsson L. (1997): The measurement of intra-industry trade between unequal partners. Review of World Economics, 133: 554–565.
Onogwu G.O. (2014): Determinants of the intra-industry trade in cereal and miscellaneous edible preparations: the evidence for Nigeria and the ECOWAS partners. Ag-ricultural Economics – Czech, 60: 21–30.
Pelzman J. (1977): Trade creation and trade diversion in the council of mutual economic assistance, 1954–1970. American Economic Review, 67: 713–722.
Persson M. (2008) Trade facilitation and the EU-ACP eco-nomic partnership agreements. Journal of Ecoeco-nomic In-tegration, 23: 518–546.
Pöyhönen P. (1963): A tentative model for the volume of trade between countries. Weltwirtschaftliches Archiv, 90: 93–100.
Qasmi B., Fausti S. (2001): NAFTA intra-industry trade in agricultural food products. Agribusiness, 17: 255–271. Rauch J. (1999): Networks versus markets in international
trade. Journal of International Economics, 48: 7–35. Santos S.J., Tenreyro S. (2006): The log of gravity. The Review
of Economics and Statistics, 88: 641–58.
Sharma K. (2002): How important is processed food in intra-industry trade? The Australian experience. Journal of Eco-nomic Studies, 29: 121–130.
Tinbergen J. (1962): Shaping the World Economy. Twentieth Century Fund, New York, USA.
World Bank (2018a): World Integrated Trade Solution (WITS), Commodity Trade Database. Available at wits. worldbank.org (accessed Oct 15, 2018).
World Bank (2018b): World Development Indicators (WDI). Available at data.worldbank.org/data-catalog/world-devel-opment-indicators (accessed Oct 10, 2018).
Zhang J., Witteloostuijn A.V., Zhou C. (2005): Chinese bilat-eral intra-industry trade: A panel data study for 50 coun-tries in the 1992–2001 period. Review of World Economics, 141: 510–540.
Received May 13, 2019 Accepted July 16, 2019