O R I G I N A L PA P E R
Labour costs dynamics in the Euro area:
some empirical evidence
Sofia Gouveia&Leonida Correia
Published online: 11 May 2013
# Springer-Verlag Berlin Heidelberg 2013
Abstract Little is known about how the introduction of a common currency and a single monetary policy has affected the labour cost dynamics in the Euro area. The literature has focused mainly on business cycle synchronisation. This paper analyses labour costs convergence in the Euro area since 1995, combining results from different data and two complementary approaches. First we present some relevant facts about wages and unit labour cost dynamics and, in a second phase, we investigate whether the physical introduction of the euro has changed the volatility and the synchronisation of labour costs cycles, in a context of globalisation. Overall, our results indicate that labour markets in the Euro area are very heterogeneous. However, some signs of labour cost convergence are beginning to emerge. After the circulation of the euro, it seems that a reduction in nominal unit labour costs differences and an increase on the degree of synchronisation has occurred, which has been strengthened in the economic and financial crisis period. Keywords Unit labour costs . Synchronisation . European integration .
OCA endogeneity
JEL classification E32 . F15 . J30
1 Introduction
Ten years have passed since the beginning of the physical circulation of the euro. It is straightforward to investigate how this fact has changed the historical pattern of convergence/divergence in labour costs across Euro area countries.
The foundation for this study is provided by the optimal currency areas (OCA) theory which extensively analysed the criteria and the costs associated with partici-pation in a common currency area. In short, OCA theory holds that a stable monetary
DOI 10.1007/s10368-013-0232-0
S. Gouveia (*)
:
L. CorreiaCentre for Transdisciplinary Development Studies, Department of Economics, Sociology and Management, University of Trás-os-Montes and Alto Douro, Vila Real, Portugal e-mail: [email protected]
L. Correia
union can exist if the benefits associated with economic and monetary integration outweigh the costs of losing independent control over monetary and exchange rate policies. According to this theory, the need for nominal exchange rate adjustments is lower when prices and wages are more flexible and the factors of production have more mobility across regions.
The limited nature of labour mobility in the Euro area has been widely document-ed. So, the endogenous synchronisation of labour market responses to important events in the euro process assumes particular relevance. However, although interest-ing, little is known about how the introduction of a common currency and a single monetary policy has affected the dynamics of cyclical labour costs in the Euro area. The literature has focused mainly on synchronisation of the business cycle. The importance of this issue, and a serious lack of research in this area, has prompted us to carry out this study.
Our paper contributes to the existing empirical literature in several ways. First, we provide consistent comparative evidence of labour costs developments in the Euro area, using annual data for several relevant variables. Second, we present an empirical assessment of the synchronisation between the Euro area aggregate unit labour costs cycle and each of the 17 member states’ unit labour cost cycles, using quarterly data for a large sample of OECD countries, before and after the circulation of the euro, in a context of globalisation. Third, we explore the implications of the recent economic and financial crisis paying extra attention to the period after 2008.
The rest of the paper is organised as follows. In the following section we briefly review the OCA literature. Section three presents some facts on wages and unit labour cost developments across the Euro area countries. The fourth section contains the empirical results of the unit labour cost volatility and synchronisation analysis. Section five concludes.
2 The optimum currency areas literature
The studies that analyse the impact of the inception of the European Monetary Union (EMU) are closely related to the OCA literature, pioneered by Mundell (1961), McKinnon (1963) and Kenen (1969), which present the theoretical foundations of currency unions. An OCA is regarded as a set of regions with integrated commodity, capital and labour markets, which may have a common currency since the structures of the regions are sufficiently similar. This means that the static pre-requisites of an OCA are labour market flexibility, identical production structures and synchronized business cycles.
From the middle of the 1990s, a number of seminal papers focused on determining the specific mechanisms through which the creation and working of the EMU would endogenously induce an OCA in the Euro area: more similar supply conditions (Coe and Helpman 1995), more similar policies (Frankel and Rose 1998), fewer trade barriers (Frankel and Rose 1998), and greater financial market integration (Kalemli-Ozcan et al.2003).1
Over the years, OCA theory has stressed the relevance of synchronisation between member states of a monetary union as a key variable. More specifically, it has been 1
asserted that the closer the member states’ cycles are the lower will be the stabilization cost of giving up an independent monetary policy. Theorists have tended to pursue two distinct explanatory paths when assessing the effects of monetary union on synchroni-sation. On the one hand, the specialization hypothesis argues that a deepening of integration results in greater sectorial specialization through financial integration would ex post lead to a less optimum currency area (Krugman1993). On the other hand, the OCA endogeneity hypothesis argues that the sharing of a common currency unleashes forces conducive to the synchronisation of developments and structures (Frankel and Rose1998). The relevance of this endogeneity hypothesis is that it considers that optimum conditions need not be fulfilled ex ante but must arise ex post under the influence of the common currency and the single monetary policy.
Recently, several empirical studies have discussed the existence of a euro cycle and others have addressed the specific question about OCA endogeneity in the EMU. The conclusions of these studies are also far from being consensual and have not been very conclusive. The short data sample makes results less robust, depending on the data, the sample or the methods chosen.2
Another related strand of literature has investigated the emergence of a world business cycle. Several authors (Kose et al.2003,2008; Canova et al.2007; Darvas and Szapáry2008) demonstrate the presence of a significant world business cycle, making it unclear whether the emergence of a European business cycle is specific to the Euro area or due to the globalisation and consequent intensification of interna-tional trade.
There is also a complementary strand of literature that examines the determinants of synchronisation, namely the degree of trade integration, sectorial similarity, finan-cial integration and policy coordination. The great majority of studies such as Frankel and Rose (1998), Clark and van Wincoop (2001), Baxter and Kouparitsas (2005), Imbs (2004,2006) and Cerqueira and Martins (2009) provide evidence that countries with higher levels of bilateral trade have greater synchronisation. For the second determinant, sectoral specialization, the results are mixed. While Imbs (2004,2006) concludes that countries with a more similar structure are more synchronous, the findings of Clark and van Wincoop (2001) and Cerqueira and Martins (2009) are that industrial similarity is non-significant and Baxter and Kouparitsas (2005) conclude that this relationship is not robust. Concerning financial integration, the empirical results obtained by Imbs (2004, 2006) show that economies with more financial interaction have a higher degree of synchronisation, while Cerqueira and Martins (2009) go in the opposite direction, reporting a significant negative effect of financial openness. Finally, monetary and fiscal policy coordination has been evaluated with mixed results. While the empirical evidence provided by Darvas et al. (2007) de-scribes a positive role of policy coordination, Clark and van Wincoop (2001) do not find a direct link.
As already stated, most the studies in the OCA endogeneity literature has focused on business cycle synchronisation. Few papers have stressed the labour market and, one question in particular, needs further investigation: that is whether the Euro area country’s labour cost have become more synchronised due to the common currency. 2
See De Haan et al. (2008) and Giannone et al. (2009) for a survey of this research program and the references therein.
In theory, it is expected that the introduction of a common currency and a single monetary policy will increase, via several channels, the coordination of nominal wage responses to shocks in partner countries given their effects on productivity, expectations about inflation and on labour market institutions, which determine the wage formation process.
One possible channel is trade intensity. As documented above, there seems to be a relative consensus among economists that close bilateral trade tends to accompany highly correlated business cycles. Higher trade intensity implies more competition, exerting a disciplining effect on wage setters (trade unions) and leading to a greater synchronisation of member countries’ labour cost/wage dynamics (Buscher and Gabrisch2012). It is also expected that a currency union will increase the synchronisation of labour cost dynamics because labour markets will be forced to become more flexible. In this sense, Calmfors (2001) stated that there is a need for more flexible labour market institutions in the EMU because monetary union will increase the demand for nominal wage flexibility.
There has been little quantitative work on the implications of the launch of the euro for the endogeneity of the labour market across the Euro area members. This question has generally been overlooked in previous studies, Silvia (2004) and Buscher and Gabrisch (2012) being the exceptions. Silvia (2004), working with quarterly data for 9 Euro area countries, performed t-tests on standard deviations for two distinct periods, 1995:1–1998:4 and 1999:1–2002:4, respectively. He concluded that there is no statistically significant difference in the standard deviations of nominal unit labour costs in the periods before and after the introduction of the euro, indicating that labour costs are not converging in the Euro area.
However, the author claims that those five years may be too short for the impact of the EMU to have worked its way through the labour markets. In a recent paper, Buscher and Gabrisch (2012) also pay attention to this issue by analysing 11 Euro area member countries (the 12 initial except Luxembourg) for the 1980–2007 period, with particular reference to the driving forces (trade intensity, sector specialization and financial integration) for the endogenous convergence of wage dynamics. Their tests have revealed that there is no strong effect of the currency area on national nominal dynamics nor does it provide the impetus to create the conditions of an optimum currency area ex post, concluding that the Euro area is not endogenous with respect to wage formation.
The relevance of the synchronisation of labour costs in the OCA context for the Euro area motivates the present investigation. Specifically, in this paper we explore labour cost convergence in the Euro area that would be, in essence, the short-run manifestation of greater labour market flexibility. However, full labour cost conver-gence would not be expected since national productivity rates could differ signifi-cantly. Nevertheless, a convergence toward a common unit labour cost which does take productivity into account could be expected (Silvia2004).
3 Wages and unit labour cost developments: some facts
In this section we analyse some aspects of wages and unit labour cost developments among the Euro area (EA) countries over the period 1995–2010. We present a level perspective and the growth patterns of each member’s wages and unit labour costs
vis-à-vis the Euro area average, comparing the period before and after the circulation of the euro.
The source of all variables used in this section is OECD (http://stats.oecd.org). Our data are annual time series of seasonally adjusted nominal compensation per employee in euro, labour productivity per person employed in euro, nominal unit labour costs (NULC) as a ratio and trade balance in goods and services as percentage of GDP at constant prices for the period from 1995 through 2010 of sixteen EMU countries as well as for the Euro area aggregate.3 The Euro area aggregate includes the current 17 members of EMU.
The wage concept used in this paper is that of nominal compensation per employee (NCE), i.e., overall compensation paid by employer. The NCE includes contractual wages and employers’ social contributions. We adopt the concept of NCE because this allows international comparisons owing to the availability of related data and its similar definition across countries, as opposed to other“narrower” wage concepts where the definitions may differ substantially from one country to the other (Andersson et al.2008). From now on the words “wage” and “compensation per employee” will be used interchangeably.
Labour productivity per person employed is defined in the OECD dataset as real output (gross value added) divided by the total number of persons employed, where the base year for real output is 2005. Unit labour costs reported by the OECD are calculated as the ratio of total labour costs and real output. The total labour cost measure is the compensation of employees adjusted for the self-employed. Data used throughout the paper is for the total economy.
Figure1 displays developments in NCE levels across Euro area countries in the period 1995–2010.
Figure 1 shows that wage levels vary enormously among the EA countries. Luxembourg is the country with the highest wages, while those of Estonia are only 25 % of that figure.
In 2010, wage levels in seven countries were above the EA level, namely, Luxembourg, Belgium, Ireland, Finland, France, Austria and the Netherlands (in that order), while seven countries were below the EA average, those being Spain, Greece, Cyprus, Slovenia, Portugal, Slovakia and Estonia. It is interesting to note, however, that the level of NCE in five countries (Luxembourg, Belgium, Austria, France and Finland) was above average in 1995 and remained there, while two countries, Ireland and the Netherlands, changed their position: having been below the EA average in 1995 whilst now being above the EA average. On the other hand, Germany is the country where wages grew the least in the period under consideration. In the beginning of the sample period, it had above-average wages, but from 2007 it went slightly below the EA average. Italy has always remained very close to the Euro area average. Seven countries were below average and remained in that position between 1995 and 2010.
With regard to patterns of growth, all EMU countries, except Germany and, to a lesser extent Austria, have experienced NCE growth persistently above the EA average during the past 16 years. Over the same period, NCE rose at an annual 3
Data series are available for all EA countries except Malta. For Cyprus data are not available in 2009 and 2010.
average rate of 2.1 % in the EA as a whole, while in Germany NCE rose 1 % per year on average. The remaining countries experienced a greater increase, lying between 2.3 % a year (Italy) and 12.4 % a year (Estonia). However, we note that higher rates of NCE growth had been observed in countries with initially low NCE levels, while growth in NCE had been visibly slower in countries with high initial levels of NCE. In 1999, Ireland surpassed the EA average growing at a much faster pace until 2008. Until 2009, Greece registered an average annual growth of 6 % but was, however, still very far from the EA nominal wage level.
Since 2009 the growth in NCE slowed down in the EA as a whole because some countries implemented adjustment plans and had to make cuts in wages. These were Ireland, EA17 AT BE FI FR DE EL IE LU NL PT ES CY SK EE SI IT 0 10000 20000 30000 40000 50000 60000 1995 Source: OECD 1996 1997 1998 1999 2000 2001 2002 2003 2004 2005 2006 2007 2008 2009 2010 Eur o EA17 Austria Belgium Finland France Germany Greece Ireland Luxembourg Netherlands Portugal Spain Cyprus Slovakia Estonia Slovenia Italy
which contracted on average 1.2 % and 3.2 % in 2009 and 2010, respectively; Greece, where wages declined 3.3 % in 2010; and Spain where wages stagnated in the same year. Fig. 2 displays labour productivity levels across the Euro area countries in the period 1995–2010. Overall Fig.2suggests that labour productivity levels and the way in which they evolved were very heterogeneous across the EA countries.
In 2010, it is notable that seven countries had levels of productivity above the EA average, namely: Luxembourg, Ireland, Belgium, France, Finland, Austria, and the Netherlands (in this order). As can be seen from comparison of Figs.1 and 2, EA countries with wages above average also recorded productivity levels above average. On the one hand, Italy, from 1995 to 2008, had higher productivity than the EA average, but since 2009 it went below the EA average. On the other hand, Germany in 1995 had slightly lower productivity and in 2010 is slightly higher than the average. In the remaining EA countries the productivity levels were below the EA average: Spain was in line with the EA average, while Greece, Cyprus, Slovenia, Portugal and Slovakia had lower productivity; Estonia is the country with the lowest productivity. Regarding labour productivity growth, all countries registered productivity gains. Between 1995 and 2010, the largest increases were those of Estonia (5.5 % a year), Slovakia (4.2 %), Slovenia (3.1 %), Ireland (2.2 %) and Greece (1.9 %). The lowest increases were registered by Italy and Luxembourg (with average annual growth rates of 0.1 % and 0.3 %).
However, a general decline in productivity is noted in 2008 and 2009. Spain is an exception as its labour productivity increased 1.2 % and 3.3 % in 2008 and 2009, respectively.
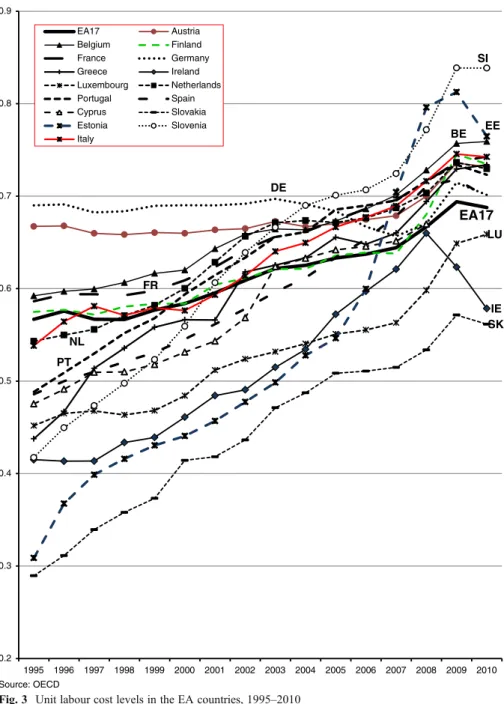
It should be noted, however, that productivity grew significantly less in all countries than nominal wages, which is reflected in NULC.4 Figure 3 shows NULC across Euro area countries between 1995 and 2010.
As can be seen from Fig.3, the NULC levels seem to have converged gradually to the EA average between 1995 and 2010. In 2010 only Slovakia, Ireland and Luxembourg have NULC below the EA average. In contrast, Slovenia is the country with the highest unit labour costs.
The NULC increased in all countries in the period analysed, but the size of the increase differed significantly between countries (see Fig. 7, Appendix1). The largest increases occurred in Estonia (annual average rate of 6.4 %), Slovenia (5.2 %) and Slovakia (4.8 %), followed by Greece (2.6 %), Portugal (2.6 %), Spain (2.5 %) and Luxembourg (2.5 %).5 By contrast, Germany (0.3 %) and Austria (0.4 %) experienced the smallest increases.
Over the 2008–2009 period, it is worth stressing a general increase in unit labour costs, with the exception of Ireland whose NULC contracted by almost 6 % in 2009. By contrast, in 2010 NULC fell in most EA member countries. Note for the EA as a whole, NULC contracted 0.9 %, Ireland’s ULC contracted 7.2 % whilst that of Luxembourg rose 1.5 %. We now move on to an analysis of changes in NULC, NCE and labour produc-tivity growth rates relative to the Euro area for the relevant sub-periods. As mentioned above, we consider the sub-samples 1995–2001 and 2002–2010, each corresponding to successive stages in the process of European monetary integration. Figure4shows 4Between 2005 and 2010, for the EA, productivity gains averaging 0.8 % a year while nominal wages rose
2.1 % a year on average.
5
Luxembourg had a cumulative increase of 46 %, with the particularity of having grown 19 % between 2007 and 2009.
the average growth rates of the NCE, productivity and NULC for each country, relative to those of the Euro area, for the two selected sub-samples.
Inspection of Fig.4suggests that the contribution of relative wages and produc-tivity to the dynamics of relative NULC before and after 2002 differs across coun-tries. Compared to the pre-2002 period, during the first years of the circulation of the euro the differences of annual average growth rates of NCE in Euro area countries relative to the Euro area average have declined across many Euro area countries.
At the same time, it is worth noting that Austria and Germany have been able to lower relative unit labour costs. Before 2002, Germany and Austria
EA17 AT BE FI FR DE EL IE LU NL PT ES CY SK EE SI IT 0 10000 20000 30000 40000 50000 60000 70000 80000 90000 100000 1995 Source: OECD 1996 1997 1998 1999 2000 2001 2002 2003 2004 2005 2006 2007 2008 2009 2010 Eur o
EA17 Austria Belgium
Finland France Germany
Greece Ireland Luxembourg
Netherlands Portugal Spain
Cyprus Slovakia Estonia
Slovenia Italy
experienced identical competitive gains but while Austria benefited from a favorable differential in productivity growth, Germany has experienced signifi-cant competitiveness gains that appear to be largely driven by wage growth, which continued to be relatively more restrained than in the other EA countries, especially in the last sub-period.
In Greece, Portugal, the Netherlands, Ireland, Spain, and Belgium, the differential in NULC growth decreased after 2002. Greece and Portugal had large wage increases EA17 BE FR DE IE LU NL PT SK EE SI 0.2 0.3 0.4 0.5 0.6 0.7 0.8 0.9 1995 Source: OECD 1996 1997 1998 1999 2000 2001 2002 2003 2004 2005 2006 2007 2008 2009 2010 EA17 Austria Belgium Finland France Germany Greece Ireland Luxembourg Netherlands Portugal Spain Cyprus Slovakia Estonia Slovenia Italy
before the euro, which were, however, reduced after the euro circulation. Productivity increases were recorded in Greece before the euro while in Portugal, productivity remained almost unchanged. In the Netherlands and Ireland, before the euro, wage developments were the main source of the deterioration in their competitiveness, but while productivity growth is in line with the average in the Netherlands, Ireland benefited from a favorable differential in productivity growth; after the euro both countries experienced a decrease in relative wage growth, which was accompanied by decline in productivity growth.
Source: author’s calculations based in OECD data
Note: Scales are the same for all countries except for the new euro area members, Greece, Ireland and Portugal.
Since the circulation of the euro, Spain has experienced a decline in competitive-ness that appears to have been caused by wage growth and decreasing relative labour productivity; in the last sub-period the differential in wage growth decreased and there was a slight increase in relative productivity growth. From the first to the second sub-period the differential in wage growth in Belgium reduced.
In contrast, from the first to the second sub-period, in countries such as Finland, France and Italy, the differential in NULC increased. In Finland, before the euro, wage growth followed productivity growth. Since 2002, the reduction in the differential in wage growth has been higher than the decrease in the differential in productivity growth. In France the increase in wages relative to the Euro area as a whole was the source of an increase in the differential in NULC growth. In Italy, despite wage moderation, the unfavorable differential in productivity growth contributed to a slight deterioration in competitiveness after the euro. Luxembourg and Cyprus were the only two countries which had the same NULC before and after the euro.
In Estonia, Slovakia and Slovenia NCE grew very much faster than labour productivity, although since 2002 the differential in wage growth has been reduced. In the group of new members, Slovakia is the one with the most dynamic conver-gence of NULC after 2002.
We look also at trade balance dynamics, as unit labour costs are widely regarded as a measure of competitiveness. The developments of trade balance in goods and services as a percentage of GDP are illustrated in Fig.5.
Inspection of Fig.5reveals that the variation of trade positions has widened substan-tially over the period, giving rise to intra-euro area trade imbalances. Some countries built up significant surpluses while others accumulated very large deficits. In 1995 Portugal's trade deficit was 6.5 % of GDP, and it increased substantially until 1999 (11.7 %); in 2010 it had fallen back to 9.4 % of GDP. For its part, Greece has always run wide trade deficits reaching a peak of 14.4 % of GDP in 2002. In Spain, from a trade surplus (0.5 % of GDP) in 1997, it deteriorated to a trade deficit of 10.4 % in 2007, and arrived at a trade deficit of 4 % in 2010. Italy and France’s trade balances have both deteriorated over the past decade to a negative 2.2 % of GDP in 2010, while Austria and Germany’s trade balances had improved to 6.5 % and 5.4 % of GDP, respectively, in 2010. Surplus countries such as Ireland and Luxemburg experienced a significant increase reaching a trade surplus of 22 % and 25 % of GDP, respectively, in 2009.
4 Synchronization of labour costs dynamics
In this section we carry out an empirical investigation of the synchronisation of labour cost cycles in the Euro area. This analysis focuses on the results of the correlation coefficients between the labour cost cycle of each country and the Euro area aggregate labour cost cycle (EA17) and also on the dispersion measures (mean and standard deviation). 4.1 Data and methodology
Our sample consists of 28 OECD countries: the 17 belonging to the Euro area and a control group with other 11 countries. This last group includes 8 non-EA European countries (Czech Republic, Denmark, Hungary, Latvia, Lithuania, Poland, Sweden and
United Kingdom) and 3 non-European Union countries (Japan, Norway and the United States of America). We also use the Euro area aggregate data with 17 economies (EA17), which is the reference cycle. The sources of the data are the Eurostat Quarterly National Accounts and OECD Main Economic Indicators Database and cover, in general, the 1995–2011 period (see Appendix2for details).
We focus on seasonally adjusted data for unit labour costs (ULC) for the total economy. We choose ULC data because they reflect the full trade-off of producing in one location versus another, this being an appropriate measure of convergence. We use nominal unit labour costs (NULC) and real unit labour costs (RULC) as an index Source: OECD, Macro Trade Indicators
Note: For Ireland and Luxemburg data are not available in 2010.
(2005: 100).6 For the NULC series the main source is the OECD. As Portugal, Cyprus, the Czech Republic, Latvia and Lithuania don’t have available data in OECD, we use the NULC series published by Eurostat. Data for RULC comes from Eurostat; Sweden, Japan, Norway and the USA are the exceptions. For these econ-omies we take the series in nominal terms from OECD and the GDP deflator, also available from OECD, to obtain the RULC series.
The ULC series for the Euro area only begins in 1995, when the‘stage two’ in the process of European Monetary Union is ongoing. This permits the correlations calculation only after 1995, whereas some countries have data sets that begin earlier. Moreover there are 4 countries that have NULC data only after 1995: data from Greece, Malta and Latvia begins in 2000:1 and Czech Republic in 1996:1. For the RULC data, the exceptions are Greece, Malta and Latvia commencing in 2000:1, Poland in 1999:4 and Ireland in 1998:1.
To obtain the cycle movements in the labour cost component, we apply the band-pass filter proposed by Baxter and King (1999) and the Hodrick and Prescott (1997) filter. Out of these, the BK filter is preferable from a theoretical point of view (Stock and Watson,1998). For this reason, and because we have obtained similar results, for the sake of brevity, in the study of the correlation coefficients we only present the BK filtered correlations.7
After the filtering process, we calculate the Spearman correlation coefficients of ULC cycles. For each country under study, the synchronisation indicator consists of a bilateral contemporaneous correlation between the ULC cycle of this country and the ULC Euro area aggregate cycle. In order to examine ULC dynamics, after calculating the correlations for the whole period, we obtain the statistics for the period before (1995–2001) and after the circulation of the euro (2002–2011), for all 28 OECD countries. The question is if the circulation of the euro has had impact on the degree of synchronisation of labour costs. As well as this, during the euro period, we separate the period before the recent financial and economic crisis (2002–2007) and the period of crisis itself (2008–2011) to evaluate if the synchronisation pattern could have changed due to the effects of the crisis.
Finally, to check whether the ULC cycles in the Euro area countries present similar values of dispersion we calculated the mean absolute deviation from trend and the standard deviation. These two measures of volatility are important because they allow us to assess the evolution of the amplitude of the Euro area ULC cycles over the sub-periods. 4.2 Results
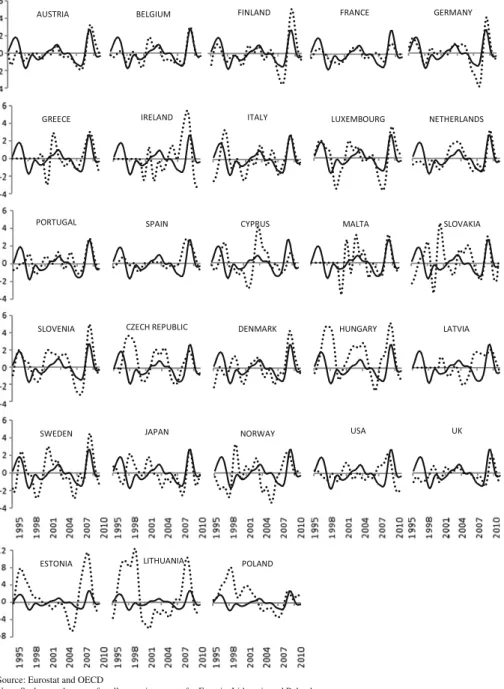
Figure6displays the cyclical components of NULC, BK filtered, with solid and dotted lines representing the NULC cycle of the Euro area aggregate and of each of the 28 6
For an easier understanding of the comparative figures, the body of the paper does not include the results for RULC variable, which are presented in Appendix2. This option does not introduce significant distortion in the analysis, considering that values for NULC are generally qualitatively similar to RULC, despite differences in their magnitude for some particular countries.
7We have configured the BK filter to extract fluctuations between 1.5 and 8 years and in the HP filter we
used a smoothing parameter of 1600, which is the conventional value for quarterly data. Although this indeed affected the correlation coefficients, our main conclusions do not change. All results are available on request.
OECD countries respectively, over the whole period. Examination of the graphs reveals that synchronisation fluctuates substantially over time and differs between countries. However, overall, it seems that NULC synchronisation has increased over the last seventeen years, suggesting that globalisation has fostered business cycle co-movements across the OECD countries and the Euro area. It is also clearly visible that the Euro area group shows the higher association, particularly in the group of the initial Source: Eurostat and OECD
Note: Scales are the same for all countries except for Estonia, Lithuania and Poland.
12 EA members. Moreover, it is remarkable that there is substantial synchronisation in the period correspondent to the recent financial and economic global crisis for all Euro area countries, albeit with some differences in amplitude. The correlations analysis from Tables1and2points to the same conclusion. Over the whole sample, the EA members reveal a greater degree of synchronisation than the other OECD countries.
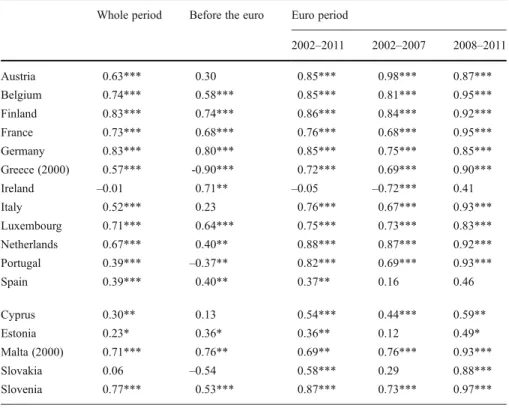
Table1presents the coefficients of the correlations for Euro area countries, divided into two groups, the first 12 Euro area members and the 5 more recent members, over the whole period, before and during the period of circulation of the euro.
From Table 1 we conclude that, over the whole sample, the degree of NULC synchronisation varies considerably across Euro area members. Finland, Germany and Slovenia display the highest degree of association (0.8). This contrasts with the low level of synchronisation of Cyprus and Estonia (0.2–0.3) and the inexistent linkage in both Ireland and Slovakia.
The contemporaneous correlation coefficients in the 1995−2001 period denotes a considerable divergence between the labour cost cycles across the Euro area econo-mies. Germany and Malta show a high level of NULC synchronisation (0.8), followed by Finland, France and Ireland (0.7). Most other correlations are low, not statistically significant or even negative; the exceptions are Belgium, Luxembourg and Slovenia that record a moderate level of synchronisation (0.5–0.6).
Table 1 Contemporaneous correlations of NULC cycles, BK filtered, for Euro area countries Whole period Before the euro Euro period
2002–2011 2002–2007 2008–2011 Austria 0.63*** 0.30 0.85*** 0.98*** 0.87*** Belgium 0.74*** 0.58*** 0.85*** 0.81*** 0.95*** Finland 0.83*** 0.74*** 0.86*** 0.84*** 0.92*** France 0.73*** 0.68*** 0.76*** 0.68*** 0.95*** Germany 0.83*** 0.80*** 0.85*** 0.75*** 0.85*** Greece (2000) 0.57*** -0.90*** 0.72*** 0.69*** 0.90*** Ireland –0.01 0.71** –0.05 –0.72*** 0.41 Italy 0.52*** 0.23 0.76*** 0.67*** 0.93*** Luxembourg 0.71*** 0.64*** 0.75*** 0.73*** 0.83*** Netherlands 0.67*** 0.40** 0.88*** 0.87*** 0.92*** Portugal 0.39*** –0.37** 0.82*** 0.69*** 0.93*** Spain 0.39*** 0.40** 0.37** 0.16 0.46 Cyprus 0.30** 0.13 0.54*** 0.44*** 0.59** Estonia 0.23* 0.36* 0.36** 0.12 0.49* Malta (2000) 0.71*** 0.76** 0.69** 0.76*** 0.93*** Slovakia 0.06 –0.54 0.58*** 0.29 0.88*** Slovenia 0.77*** 0.53*** 0.87*** 0.73*** 0.97***
Author’s calculations based in Eurostat and OECD data
As is well known, in the period before the euro, potential participants in the EMU were obliged to pursue policies that would increase the convergence and coordination of their economies. So, it is not surprising that almost all the Euro area countries have increased their synchronisation with the NULC Euro area cycle in the period of circulation of the euro compared with the period before. However, the dynamics are heterogeneous across the 17 economies when we compare NULC synchronisation between the two sub-periods. We see that the relative increase was stronger for Austria, Greece, Italy, Portugal, Cyprus, and Slovakia. The correlations have not changed for Spain and Estonia (0.4) and have decreased slightly in Malta and most clearly in Ireland. Moreover, there are some differences between the group of the 12 initial Euro area members and the group of the 5 new members. The correlations are stronger for the 12 initial Euro area members group, where the majority of economies have high correlations (above 0.8); in comparison, Spain (0.4) and Ireland (not significant) produced the worst figures.
Another important outcome is that when we compare the sub-periods 2002–2007 and 2002–2011, the correlations are in general lower in the period before the crisis. However, attention should be drawn to the special case of Ireland that presents a negative coefficient before the crisis and a not significant value in the 2002–2011 period, indicating a nonexistent or even contrary NULC linkage with the Euro area. In examining the correlations for the crisis period (2008–2011), it is important to highlight the increase in the level of association from the 2002–2007 period and the strong synchronisation with the Euro area NULC cycle for almost all the countries, with figures between 0.8–1.0. In the group of the 12 initial Euro area economies only Ireland and Spain are below this level, along with Cyprus and Estonia from the other group.
In the literature it is still an open hypothesis that, in the most recent years, business cycles of the largest world economies have become increasingly synchronised. If
Table 2 Contemporaneous correlations of NULC cycles, BK filtered, for the control group Whole period Before the euro Euro period
2002–2011 2002–2007 2008–2011 Czech Republic (1996) 0.31** –0.18 0.70*** 0.72*** 0.83*** Denmark 0.41*** –0.04 0.74*** 0.68*** 0.92*** Hungary 0.36*** –0.07 0.75*** 0.69*** 0.79*** Latvia (2000) –0.19 –0.95*** –0.65*** –0.09 0.78*** Lithuania 0.00 –0.02 –0.65*** –0.03 0.62** Poland 0.01 –0.49*** 0.56*** 0.72*** 0.32 Sweden 0.52*** 0.25 0.77*** 0.66*** 0.90*** U. Kingdom 0.22* –0.36** 0.77*** 0.96*** 0.74*** Japan 0.08 –0.56*** 0.64*** 0.36* 0.95*** Norway –0.03 –0.24 0.20 0.04 0.20 USA –0.10 –0.02 –0.07 –0.52*** 0.35
Author’s calculations based in Eurostat and OECD data
such a hypothesis is also valid for labour costs, this will have implications for their synchronisation in the Euro area, because when a growing tendency is detected for each member-state ULC cycle, it can be due to specific forces acting on that Euro area, but it will also be due to a global tendency. Consequently, we have to compare the evolution in the Euro area with developments on a worldwide scale. Table 2 shows the correlation results for the 11 OECD countries belonging to the control group, for the whole sample period, the period before and after the circulation of the euro.
The comparison between Tables1and2reveals that, in general, the correlations are rather low and more heterogeneous in the case of the control group OECD countries. Looking at the whole sample we see that the estimates are, in general, weak or not statistically significant, indicating a low or inexistent labour-cost-cycle convergence with the Euro area cycle. The higher figures are exhibited by 3 EU countries: Denmark, Hungary and Sweden (0.4–0.5).
The results also show a remarkable change between the period before and after the circulation of the euro. Looking at the 1995–2001 estimates, and with exception of Sweden, they are negative or not statistically significant. In the euro period, some countries start to exhibit substantial association with the Euro area NULC cycle. The outstanding examples are the Czech Republic, Denmark, Hungary, Sweden and the United Kingdom which display high correlations (0.7–0.8) and Poland which has a moderate figure (0.6). Outside the European Union, only Japan (0.6) is positively correlated with the Euro area NULC cycle. The other countries display negative or non-significant correlations. In the crisis period, with the exception of Poland and the United Kingdom, the correlations are stronger than in the 2002–2007 period. Finally a case to highlight is that of the negative or non-significant coefficients of the USA, showing a decoupling from the NULC Euro area cycle. Overall, the results imply that the degree of NULC synchronisation varies consider-ably across Euro area members. Another important outcome is that almost all the Euro area countries have tighter synchronisation in the period of euro circulation comparing with the previous period. However, the estimated correlations for several non-Euro area countries seem to experience a similar increase. So, in this respect, it´s not possible, without ambiguity, to conclude that the introduction of the euro has been the source of closer synchronisation of labour costs. This could also be seen as evidence of part of a worldwide scale developments rather than being specific to the Euro area.
With regard to the amplitude of the cycles, Table3 presents the mean absolute deviation from trend (Mean) and the standard deviation (SDev) for the NULC series. The dispersion measures based on BK filtered data reveal that, for the whole period, almost all the economies display greater dispersion in their NULC cycles than the Euro area aggregate. Another outcome is that, over the time, the group of the 12 initial Euro area members has experienced, on average, NULC cycles with lower amplitude than the group of the new members. The comparison between sub-periods reveals that, in general, the euro period generates lower means (in absolute value) and higher standard deviations than the previous period. It is also worth noting that, during the crisis period, volatility has increased for the Euro area aggregate and for 16 Euro area economies, Cyprus being the exception. It should be said that, at the level of individual countries, there are some idiosyncra-sies to point out. Firstly, over the whole time, Estonia displays the highest volatility. Second, over the 1995–2001 period, Austria and Spain have the lowest standard de-viations. Third, in the euro period, the standard deviation of NULC cycles has a substantial increase for almost all countries, with the exception of France, Greece,
Italy, Malta and Slovakia. During this time, France exhibits the smallest volatility in the sample, which is below that of the EA17. Finally, from the 2002–2007 to the crisis period, almost all countries display an intensification in the volatility of their cycle (Cyprus is the exception), and Ireland and Spain exhibit the strongest increase.
5 Conclusions
Little is known about how the introduction of a common currency and a single monetary policy has affected the cyclical labour cost dynamics in the Euro area. The literature has focused mainly on business cycle synchronisation. Our study is an approach related to the endogenous OCA business cycle literature but is distinctive: looks at the labour costs convergence across the Euro area countries.
We find that nominal wages, labour productivity and nominal unit labour costs and the evolution of each of them were very heterogeneous across the Euro area countries during 1995–2010. Concerning wages, between 1995 and 2010, growth in nominal wages was faster in countries with low initial levels of nominal wages. The biggest differences are between the Northern and Central European countries on the one
Table 3 Dispersion measures of NULC, BK filtered, for Euro area countries (%)
Country Whole Period Before euro Euro period 2002–2007 2008–2011 Mean SDev Mean SDev Mean SDev Mean SDev Mean SDev Austria –0.12 1.07 –0.35 0.44 0.06 1.34 –0.48 0.81 1.06 1.57 Belgium –0.10 1.05 –0.32 0.75 0.07 1.21 –0.26 0.92 0.68 1.46 Finland –0.02 1.63 –0.20 0.76 0.11 2.06 –0.58 1.36 1.38 2.56 France –0.05 0.61 –0.32 0.59 0.15 0.54 0.04 0.50 0.36 0.58 Germany 0.06 1.55 0.20 0.82 –0.05 1.93 –0.35 1.56 0.50 2.45 Greece (2000) 0.15 1.53 –1.10 1.47 0.42 1.41 0.02 1.20 1.16 1.52 Ireland 0.14 2.33 –0.57 1.43 0.30 2.47 –0.03 1.40 0.90 3.74 Italy 0.05 1.40 –0.24 1.68 0.27 1.12 –0.06 0.96 0.88 1.17 Luxembourg 0.06 1.82 0.10 1.80 0.03 1.85 –0.51 1.54 1.01 2.05 Netherlands 0.01 1.21 –0.53 0.54 0.42 1.41 0.24 1.31 0.74 1.58 Portugal 0.22 0.96 –0.01 0.67 0.38 1.09 0.15 0.80 0.79 1.37 Spain 0.23 0.91 –0.11 0.44 0.48 1.08 –0.05 0.43 1.45 1.24 Cyprus 0.00 1.51 –0.43 1.32 0.31 1.57 0.59 1.82 –0.16 0.79 Estonia 1.46 4.34 2.59 2.77 0.60 5.06 –1.61 3.14 4.68 5.39 Malta (2000) 0.08 1.70 –0.54 2.34 0.21 1.50 0.11 1.41 0.39 1.64 Slovakia 0.27 1.77 0.38 2.03 0.18 1.53 0.20 1.31 0.15 1.89 Slovenia 0.41 1.83 0.29 1.25 0.50 2.17 –0.02 1.87 1.53 2.37 Euro area 17 0.05 1.04 –0.07 1.02 0.13 1.05 –0.15 0.79 0.64 1.30 Author’s calculations based in Eurostat and OECD data
hand, and the Southern countries and the new EMU economies on the other. Ireland is a particular case: wages grew significantly, reaching levels far above Euro area average by the end of the period. Conversely, in Germany, and to a lesser extent Austria, wages grew at rates persistently below the Euro area average. So as wage level convergence is far from complete, it may continue to be a factor behind wage growth differences within the EA.
Nominal unit labour cost analysis indicates an increase in all Euro area countries. We find that nominal wages appear to have contributed to differences in nominal unit labour cost developments across countries. Greece and Portugal show the fastest increases as a result of wage rates that increased faster than productivity. In contrast, Germany had a much smaller increase than other countries.
Additionally, we looked at trade balance dynamics in the same period and we detected that there has been a serious deterioration in competitiveness in the Southern European countries. We find that trade imbalances widened considerably between Euro area members after the circulation of the euro. The loss of competitiveness in those countries could become a problem if it becomes a persistent characteristic.
Overall, these findings are in line with the conclusions from the synchronization analysis. For the whole sample period (1995–2011), the evidence reveals that the degree of synchronisation in labour costs varies considerably over time and between Euro area members. Another outcome that should be mentioned is that, in general, the correlations are rather low and more heterogeneous in the case of the control group OECD countries.
The comparative analysis by sub-periods shows that almost all the Euro area countries have tightened synchronisation of labour costs with the Euro area cycle in the period of circulation of the euro comparing with the period before. However, the estimated correlations for several non-Euro area countries seem to indicate a similar increase in these periods. So, in this respect, it is not possible, without ambiguity, to conclude that the introduction of the euro has been the source of increased labour cost synchronisation. This could also be seen as evidence of part of a worldwide scale developments rather than being specific to the Euro area.
Another aspect analysed is whether the introduction of the common currency changed the labour cost volatility in the Euro area. Dispersion measures of cyclicality show cross-country heterogeneity and that, in general, the euro period has produced higher cyclical dispersion than the previous period and furthermore that, during the crisis period, almost all countries display intensification in the volatility of their cycle. In conclusion, our analysis suggests that some signs of labour cost convergence are beginning to emerge in the Euro area. After the circulation of the euro, it seems that a reduction in nominal unit labour costs differences and an increase on the degree of synchronisation has occurred, which has been strengthened in the economic and financial crisis period. However, the labour markets in the Euro area are yet very heterogeneous, implying that some Euro area members remain vulnerable to asymmet-rical shocks.
This paper represents a first step in the analysis of labour costs convergence in the Euro area. We might be cautions and cannot draw any strong conclusion because it is still very early to completely evaluate all the implications of the introduction of the common currency and the effects of the current crisis in the labour markets. Research on this topic should be ongoing.
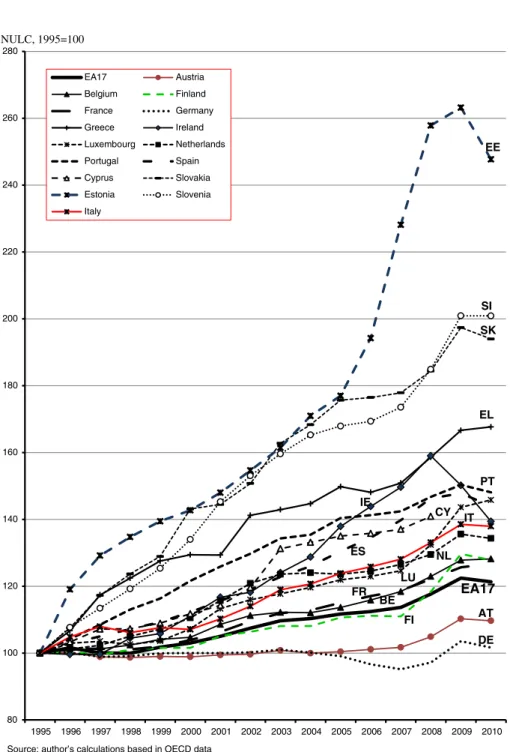
Appendix 1 NULC, 1995=100 EA17 AT BE FI FR DE EL IE LU NL PT ES CY SK EE SI IT 80 100 120 140 160 180 200 220 240 260 280 1995
Source: author’s calculations based in OECD data
1996 1997 1998 1999 2000 2001 2002 2003 2004 2005 2006 2007 2008 2009 2010 EA17 Austria Belgium Finland France Germany Greece Ireland Luxembourg Netherlands Portugal Spain Cyprus Slovakia Estonia Slovenia Italy
Appendix 2 Data Sources and Availability
Table 4 ULC in total economy (index, 2005=100): sample period, sources and available data
Country Code Sample Period Sources (available data)
Austria AT NULC 1995:1–2011:1 OECD(1988:1–2011:1)
RULC 1995:1–2011:2 Eurostat(1995:1–2011:3)
Belgium BE NULC 1995:1–2011:1 OECD(1980:1–2011:1)
RULC 1995:1–2011:2 Eurostat(1980:3–2011:3)
Finland FI NULC 1995:1–2011:1 OECD(1975:1–2011:1)
RULC 1995:1–2011:2 Eurostat(1975:1–2011:3)
France FR NULC 1995:1–2011:1 OECD(1978:1–2011:1)
RULC 1995:1–2011:2 Eurostat(1978:1–2011:3)
Germany DE NULC 1995:1–2011:1 OECD(1970:1–2011:1)
RULC 1995:1–2011:2 Eurostat (1991:1–2011:3)
Greece EL NULC 2000:1–2011:1 OECD(2000:1–2011:2)
RULC 2000:1–2011:1 Eurostat (2000:1–2011:1)
Ireland IE NULC 1995:1–2011:1 OECD(1985:1–2011:1)
RULC 1998:1–2011:2 Eurostat(1998:1–2011:3)
Italy IT NULC 1995:1–2011:1 OECD(1981:1–2011:1)
RULC 1995:1–2011:2 Eurostat (1980:1–2011:3) Luxembourg LU NULC 1995:1–2011:1 OECD(1995:1–2011:2)
RULC 1995:1–2011:2 Eurostat(1995:1–2011:3) Netherlands NL NULC 1995:1–2011:1 OECD(1987:1–2011:1)
RULC 1995:1–2011:2 Eurostat(1995:1–2011:3) Portugal PT NULC 1995:1–2011:2 Eurostat(1995:1–2011:3) RULC 1995:1–2011:2 Eurostat(1995:1–2011:3)
Spain ES NULC 1995:1–2011:1 OECD(1980:1–2011:2)
RULC 1995:1–2011:2 Eurostat(1980:1–2011:3) Cyprus CY NULC 1995:1–2011:2 Eurostat(1995:1–2011:3) RULC 1995:1–2011:2 Eurostat(1995:1–2011:3)
Estonia EE NULC 1995:1–2011:1 OECD(1995:1–2011:1)
RULC 1995:1–2011:2 Eurostat(1995:1–2011:3)
Malta MT NULC 2000:1–2011:2 Eurostat(2000:1–2011:3)
RULC 2000:1–2011:2 Eurostat(2000:1–2011:3)
Slovakia SK NULC 1995:1–2010:4 OECD(1995:1–2010:4)
RULC 1995:1–2011:2 Eurostat(1995:1–2011:3)
Slovenia SI NULC 1995:1–2010:4 OECD(1995:1–2010:4)
RULC 1995:1–2011:2 Eurostat(1995:1–2011:3) Euro area 17 EA17 NULC 1995:1–2011:1 OECD(1995:1–2011:2)
RULC 1995:1–2011:2 Eurostat(1995:1–2011:2) Czech Republic CZ NULC 1996:1–2011:2 Eurostat(1996:1–2011:3) RULC 1995:1–2011:2 Eurostat(1995:1–2011:3)
Appendix 3
Table 4 (continued)
Country Code Sample Period Sources (available data)
Denmark DK NULC 1995:1–2011:1 OECD(1988:1–2011:2)
RULC 1995:1–2011:2 Eurostat(1990:1–2011:3)
Hungary HU NULC 1995:1–2011:1 OECD(1995:1–2011:1)
RULC 1995:1–2011:2 Eurostat(1995:1–2011:3) Latvia LV NULC 2000:1–2011:2 Eurostat(2000:1–2011:3) RULC 2000:1–2011:2 Eurostat(2000:1–2011:3) Lithuania LT NULC 1995:1–2011:2 Eurostat(1995:1–2011:3) RULC 1995:1–2011:2 Eurostat(1995:1–2011:3)
Poland PL NULC 1995:1–2011:1 OECD(1995:1–2011:2)
RULC 1999:4–2011:2 Eurostat (1999:4–2011:3)
Sweden SE NULC 1995:1–2011:1 OECD(1993:1–2011:1)
RULC 1995:1–2011:1 OECD(1993:1–2011:1) United Kingdom UK NULC 1995:1–2011:1 OECD(1970:1–2011:1) RULC 1995:1–2011:2 Eurostat(1992:2–2011:3)
Japan JP NULC 1995:1–2011:1 OECD(1980:1–2011:1)
RULC 1995:1–2011:1 OECD(1994:1–2011:1)
Norway NO NULC 1995:1–2011:1 OECD(1978:1–2011:1)
RULC 1995:1–2011:1 OECD(1978:1–2011:1) United States of America US NULC 1995:1–2011:1 OECD(1970:1–2011:2) RULC 1995:1–2011:1 OECD(1970:1–2011:1)
Table 5 Contemporaneous correlations of RULC cycles, BK filtered, for Euro area countries Whole period Before the euro Euro period
2002–2011 2002–2007 2008–2011 Austria 0.70*** 0.26 0.89*** 0.94*** 0.95*** Belgium 0.61*** 0.13 0.85*** 0.84*** 0.92*** Finland 0.61*** 0.35* 0.69*** 0.47** 0.92*** France 0.72*** 0.59*** 0.80*** 0.73*** 0.82*** Germany 0.69*** 0.35* 0.87*** 0.75*** 0.88*** Greece (2000) 0.60*** –0.64* 0.72*** 0.64*** 0.86*** Ireland (1998) 0.14 –0.18 0.31* 0.12 0.38 Italy 0.31*** –0.18 0.59*** 0.55*** 0.94***
Table 6 Contemporaneous correlations of RULC cycles, BK filtered, for the control group Whole period Before the euro Euro period
2002–2011 2002–2007 2008–2011 Czech Rep. 0.18 –0.04 0.23 0.76*** –0.79*** Denmark 0.47*** –0.06 0.73*** 0.55*** 0.91*** Hungary 0.24** 0.11 0.29* 0.08 0.53* Latvia (2000) –0.09 –0.90*** 0.04 –0.57*** 0.64** Lithuania 0.12 –0.32* 0.42*** 0.10 0.81** Poland (1999) 0.49*** 0.63* 0.54*** 0.60*** 0.30 Sweden 0.43*** –0.01 0.73*** 0.55*** 0.91*** U. Kingdom 0.41*** –0.04 0.78*** 0.66*** 0.90*** Japan 0.27** –0.28 0.60*** 0.34* 0.84*** Norway 0.34*** –0.21 0.76*** 0.64*** 0.86*** USA –0.03 –0.12 0.05 0.19 0.10
Author’s calculations based in Eurostat and OECD data
*, ** and *** denote significance at the 10 %, 5 % and 1 % levels, respectively Table 5 (continued)
Whole period Before the euro Euro period
2002–2011 2002–2007 2008–2011 Luxembourg 0.52*** –0.01 0.78*** 0.56*** 0.90*** Netherlands 0.81*** 0.51*** 0.90*** 0.84*** 0.89*** Portugal 0.48*** –0.14 0.77*** 0.57*** 0.93*** Spain 0.14 –0.68*** 0.61*** 0.67*** 0.85*** Cyprus 0.30** –0.10 0.54*** 0.74*** 0.64** Estonia 0.45*** 0.07 0.60*** 0.58*** 0.73*** Malta(2000) 0.58*** 0.57 0.64*** 0.50*** 0.90*** Slovakia 0.30*** –0.52*** 0.72*** 0.53*** 0.95*** Slovenia 0.45*** 0.12 0.60*** 0.44** 0.72***
Author’s calculations based in Eurostat data
References
Andersson M, Gieseck A, Pierluigi B, Vidalis N (2008) Wage growth dispersion across the euro area countries– Some Stylised Facts. Occasional Paper Series 90, European Central Bank
Baxter M, King R (1999) Measuring business cycles: approximate band-pass filters for economic time series. Rev Econ Stat 81:575–593
Baxter M, Kouparitsas M (2005) Determinants of business cycle comovement: a robust analysis. J Monet Econ 52(1):113–157
Buscher H, Gabrisch H (2012) The synchronization of wage dynamics across EMU members. A test of the endogeneity hypothesis. Empirica 39(3):327–340
Calmfors L (2001) Wages and wage-bargaining institutions in the EMU– a survey of the issues. Cesifo Working Paper 520
Canova F, Ciccarelli M, Ortega E (2007) Similarities and Convergence in G7 Cycles. J Monet Econ 54(3):850–878
Cerqueira P, Martins R (2009) Measuring the determinants of business cycle synchronisation using a panel approach. Econ Lett 102(1):106–108
Clark T, van Wincoop E (2001) Borders and business cycles. J Int Econ 55:59–85 Coe D, Helpman E (1995) International R&D Spillovers. Eur Econ Rev 39(5):859–887
Darvas Z, Szapáry G (2008) Business cycle synchronisation in the enlarged EU. Open Econ Rev 19:1–19 Darvas Z, Rose A, Szapáry G (2007) Fiscal divergence and business cycle synchronisation: irresponsibility is idiosyncratic. In: Frankel J, Pissarides C (eds) NBER international seminar on macroeconomics 2005. MIT Press, Cambridge, pp 261–298
Table 7 Dispersion measures of real unit labour costs, BK filtered, for the Euro area countries (%) Country Whole Period Before euro Euro period 2002–2007 2008–2011
Mean SD Mean SD Mean SD Mean SD Mean SD
Austria 0.01 1.03 0.03 0.35 0.01 1.33 –0.49 0.86 0.88 1.57 Belgium –0.13 1.08 –0.30 0.89 –0.01 1.21 –0.30 1.10 0.49 1.26 Finland –0.11 1.51 –0.39 0.99 0.10 1.80 –0.46 1.38 1.05 2.08 France –0.06 0.61 –0.20 0.47 0.04 0.70 –0.05 0.61 0.19 0.83 Germany –0.02 1.24 –0.02 0.67 –0.02 1.56 –0.35 1.39 0.54 1.72 Greece (2000) 0.10 1.62 –0.91 1.79 0.31 1.52 0.02 1.29 0.86 1.81 Ireland (1998) –0.07 2.56 0.33 1.26 –0.21 2.97 –1.60 1.48 2.16 3.40 Italy –0.12 1.04 –0.48 1.27 0.13 0.77 –0.21 0.70 0.72 0.50 Luxembourg 0.06 2.49 –0.08 2.05 0.16 2.83 –0.31 2.58 0.98 3.13 Netherlands 0.07 1.26 0.04 0.75 0.11 1.56 –0.21 1.30 0.65 1.85 Portugal 0.11 1.02 0.12 0.78 0.11 1.18 –0.21 1.01 0.68 1.28 Spain –0.03 1.09 –0.25 0.80 0.17 1.24 –0.50 0.60 1.31 1.23 Cyprus –0.03 1.74 –0.44 1.62 0.25 1.83 0.75 1.68 –0.69 1.78 Estonia –0.02 2.50 –0.33 0.93 0.31 3.23 –1.24 1.73 3.18 3.44 Malta (2000) 0.08 1.58 –0.12 2.15 0.19 1.48 0.03 1.37 0.48 1.69 Slovakia 0.14 1.79 0.39 1.66 –0.03 1.93 –0.61 1.27 1.03 2.49 Slovenia –0.20 1.54 –0.45 0.78 –0.05 1.94 –0.61 1.58 1.00 2.17 Euro area 17 –0.03 0.81 –0.03 0.42 –0.02 1.01 –0.30 0.83 0.46 1.14 Author’s calculations based in Eurostat data
De Grauwe P, Mongelli F (2005) Endogeneities of Optimum Currency Areas? What brings countries sharing a single currency closer together? ECB Working Paper 468
De Haan J, Inklaar R, Jong-A-Pin R (2008) Will business cycles in the euro area converge? A critical survey of empirical research. J Econ Surv 22:234–273
European Commission (2011)“Labour Market Developments in Europe”
Frankel J, Rose A (1998) The endogeneity of the optimum currency area criteria. Econ J 108:1009–1025 Giannone D, Lenza M, Reichlin L (2009) Business Cycles in the Euro Area. ECB Working Paper Series
1010
Hodrick R, Prescott E (1997) Post-war U.S. business cycles: an empirical investigation. J Money, Credit, Bank 29:1–16
Imbs J (2004) Trade, finance, specialization and synchronisation. Rev Econ Stat 86:723–734 Imbs J (2006) The real effects of financial integration. J Int Econ 68:296–324
Kalemli-Ozcan S, Sorensen B, Yosha O (2003) Risk sharing and industrial specialization: regional and international evidence. Am Econ Rev 93(3):903–918
Kenen P (1969) The theory of optimum currency areas: an eclectic view. In: Mundell R, Swoboda AK (eds) monetary problems of the international economy. University of Chicago Press, Chicago, pp 41–60 Kose M, Prasad E, Terrones M (2003) How does globalization affect the synchronisation of business
cycles? Am Econ Rev 93(2):57–62
Kose M, Otrok C, Whiteman C (2008) Understanding the evolution of world business cycles. J Int Econ 75(1):110–130
Krugman P (1993) Lessons from Massachusetts for EMU. In: Torres F, Giavazzi F (eds) Adjustment and growth in the European Union. Cambridge University Press, Cambridge, pp 241–260
McKinnon R (1963) Optimum currency areas. Am Econ Rev 53:717–725 Mundell R (1961) A theory of optimum currency areas. Am Econ Rev 51:657–665
Silvia S (2004) Is the Euro working? The Euro and European labour markets. J Public Policy 24(2):147– 168