INSTITUTO DE INVESTIGAÇÃO E FORMAÇÃO AVANÇADA ÉVORA, Fevereiro 2019 ORIENTADOR:Manuel Collares-Pereira
Tese apresentada à Universidade de Évora
para obtenção do Grau de Doutor em Engenharia Mecatrónica e Energia
Luis André Pereira Fialho
Photovoltaic generation with energy
storage integrated into the electric grid:
Modelling, simulation and experimentation
Orientador | Manuel Collares Pereira
Tese apresentada à Universidade de Évora para obtenção do Grau de
Doutor em Engenharia Mecatrónica e Energia
Évora, 2019
Title | Photovoltaic generation with energy storage integrated into the electric grid: Modelling, simulation and experimentation
Photovoltaic generation with energy storage
integrated into the electric grid: Modelling,
simulation and experimentation
This page is intentionally left blank.
Título | Photovoltaic generation with energy storage integrated into the electric grid: Modelling, simulation and experimentation
2
Acknowledgements
“No man is an island entire of itself”.This work would not have been possible without the support of many people, to whom I owe special thanks.
First, to Carla, for the immense hours and patience to put up with me, trough the daily obstacles, but also for sharing the victories and happy moments.
To my parents, my sister and my family, for being always on my side, my support and my roots. To my invaluable and patient advisor, Prof. Manuel Collares Pereira, for having always supported and encouraged me, keeping the bearing towards the sun. His guidance and mentoring are always an inspiration and without which none of this would be possible.
With a special mention to all the team of the Renewable Energies Chair. It is a fantastic opportunity to work in our facilities with you, sharing countless laughs and challenging moments. Thank you for teaching me so much.
I would also like to extend my thanks to the IIFA staff, for their complete availability to help me wherever it was needed.
3
Contents
Photovoltaic generation with energy storage integrated into the electric grid: Modelling, simulation and experimentation
CHAPTER 1. INTRODUCTION ...12
1.1MOTIVATION ... 12
1.2RESEARCH QUESTIONS... 16
1.3THESIS STRUCTURE ... 16
REFERENCES ... 18
CHAPTER 2. PV CONVERSION AND INVERTERS – MODELLING, SIMULATION AND VALIDATION ...19
2.1INTRODUCTION ... 19
2.2PV SYSTEMS LINKED TO THE GRID: PARAMETER IDENTIFICATION WITH A HEURISTIC PROCEDURE ... 19
2.3AMORPHOUS SOLAR MODULES SIMULATION AND EXPERIMENTAL RESULTS: EFFECT OF SHADING ... 43
2.4ASIMULATION OF INTEGRATED PHOTOVOLTAIC CONVERSION INTO ELECTRIC GRID ... 51
2.5SIMULATION OF A-SI PVSYSTEM GRID CONNECTED BY BOOST AND INVERTER ... 84
2.6SIMULATION OF A-SI PVSYSTEM LINKED TO THE GRID BY DCBOOST AND THREE-LEVEL INVERTER UNDER CLOUD SCOPE ... 101
CHAPTER 3. COMMISSIONING, INSTALLATION AND CHARACTERIZATION OF THE UEVORA MICROGRIDS ... 109
3.1INTRODUCTION ... 109
3.2FRAMEWORK OF THE UEVORA MICROGRIDS WITH ENERGY STORAGE ... 109
3.3THE VANADIUM REDOX FLOW BATTERY ... 111
3.4THE LITHIUM-ION BATTERY ... 112
3.5INSTALLATION OF THE MICROGRIDS... 114
3.6COMMISSIONING OF THE MICROGRIDS ... 115
3.6.1 VRFB microgrid ... 115
3.6.2 Lithium-Ion Battery microgrid ... 120
3.6.3 Software control and communication ... 126
3.6.4 Implementation Outcomes ... 128
3.7ENERGY STORAGE SYSTEMS CHARACTERIZATION TESTS ... 130
REFERENCES ... 131
CHAPTER 4. ENERGY MANAGEMENT STRATEGIES - IMPLEMENTATION AND REHEARSAL ... 132
4.1VALIDATION OF THE ENERGY MANAGEMENT STRATEGIES... 132
4.2IMPLEMENTATION AND VALIDATION OF A SELF-CONSUMPTION MAXIMIZATION ENERGY MANAGEMENT STRATEGY IN A VANADIUM REDOX FLOW BIPVDEMONSTRATOR ... 132
CHAPTER 5. CONCLUSIONS... 152
5.1CONCLUSIONS ... 152
CHAPTER 6. FUTURE RESEARCH LINES ... 154
6.1FUTURE RESEARCH LINES ... 154
REFERENCES ... 157
4
Conversão fotovoltaica com armazenamento de energia
integrado em rede elétrica: modelação, simulação e
experimentação
Resumo
Esta tese apresenta o trabalho e resultados da investigação desenvolvida sobre conversão fotovoltaica com armazenamento de energia integrado em rede elétrica. Começa por apresentar a modelação, simulação e validação da conversão fotovoltaica e inversores com injeção para a rede. Descreve também seguidamente o processo de conceção, construção, comissionamento e desenvolvimento experimental das infraestruturas hoje existentes na Cátedra Energias Renováveis da Universidade de Évora, no que diz respeito às duas microgrids desenvolvidas no âmbito do projeto europeu PVCROPS. Estas microgrids são compostas, de forma geral, por um elemento de produção fotovoltaica, um elemento de armazenamento de energia, uma ligação à rede e um sistema de controlo e datalogging. Relativamente ao armazenamento de energia, esta tese aborda e caracteriza ainda as duas tecnologias instaladas: a bateria de iões de lítio e a bateria de fluxo redox de vanádio. Estas microgrids servem assim para implementação e validação de uma estratégia de gestão de energia tendo como objetivo a maximização do autoconsumo, cujos conteúdos são apresentados no capítulo 4. Depois das conclusões, no último capítulo, apontam-se ainda as linhas de investigação futuras de maior potencial, na sequência do trabalho desenvolvido e apresentado nesta tese.
Palavras-chave
Sistemas Fotovoltaicos, Armazenamento de energia, Bateria de Fluxo Redox de Vanádio, Bateria de Lítio, Estratégias de Gestão de Energia.
5
Photovoltaic generation with energy storage integrated into
the electric grid: Modelling, simulation and experimentation
Abstract
This thesis presents the work and results of the research developed on photovoltaic conversion with energy storage integrated into the electric grid. It begins by presenting the modeling, simulation and validation of the photovoltaic conversion and inverters with injection into the electric grid. It also describes the process of design, construction, commissioning and experimental development of the existing infrastructures in the Renewable Energies Chair of the University of Évora, with respect to the two microgrids developed under the European project PVCROPS. These microgrids are generally composed by a photovoltaic production element, an energy storage element, a grid connection and a control and datalogging system. Regarding energy storage, this thesis also discusses and characterizes the two installed technologies: the lithium-ion battery and the redox-flow vanadium battery. These microgrids thus serve to implement and validate an energy management strategy with the objective of maximizing self-consumption, the contents of which are presented in Chapter 4. Following the conclusions, in the last chapter are pointed the future research lines of greater potential, following the work developed and presented in this thesis.
Keywords
Photovoltaic Systems, Energy Storage, Vanadium Redox Flow Battery, Lithium-Ion Battery, Energy Management Strategies.
6
List of scientific papers
This thesis includes the following papers:L. Fialho, T. Fartaria, L. Narvarte, M. Collares-Pereira, “Implementation and Validation of a Self-Consumption Maximization Energy Management Strategy in a Vanadium Redox Flow BIPV Demonstrator”, Energies, Vol. 9, pp. 496, 2016. (Chapter 4, Section 4.2)
http://dx.doi.org/10.3390/en9070496
L. Fialho, R. Melício, V.M.F. Mendes, M. Collares-Pereira, "Simulation of a-Si PV system linked to the grid by DC boost and three-level inverter under cloud scope", Technological Innovation for Cloud-based Engineering Systems, DoCEIS 2015 Proceedings, Vol. 450, pp. 423-430, 2015. (Chapter 2, Section 2.6)
https://doi.org/10.1007/978-3-319-16766-4_45
L. Fialho, R. Melício, V.M.F. Mendes, A. Estanqueiro, M. Collares-Pereira, “PV systems linked to the grid: Parameter identification with a heuristic procedure”, Sustainable Energy Technologies and Assessments, Vol. 10, pp. 29-39, June 2015. (Chapter 2, Section 2.2)
http://dx.doi.org/10.1016/j.seta.2015.01.006
L. Fialho, R. Melício, V.M.F. Mendes, A. Estanqueiro, "Simulation of a-Si PV System Grid Connected by Boost and Inverter", International Journal of Renewable Energy Research, Vol.5, Nº.2, pp. 443-451, May 2015. (Chapter 2, Section 2.5)
http://hdl.handle.net/10174/16472
L. Fialho, R. Melício, V. M. F. Mendes, J. Figueiredo, M. Collares-Pereira, "Amorphous Solar Modules Simulation and Experimental Results: Effect of Shading", Technological Innovation for Collective Awareness Systems, DoCEIS 2014 Proceedings, Vol. 423, pp. 315-323, 2014. (Chapter 2, Section 2.3)
http://link.springer.com/chapter/10.1007%2F978-3-642-54734-8_35
L. Fialho, R. Melício, V.M.F. Mendes, S. Viana, C. Rodrigues, A. Estanqueiro, "A simulation of integrated photovoltaic conversion into electric grid", Solar Energy, vol. 110, pp. 578-594, 2014. (Chapter 2,
Section 2.4)
http://dx.doi.org/10.1016/j.solener.2014.09.041
Also published with blind peer review (not included in this thesis):
Ricardo Conceição, Hugo G. Silva, José Mirão, Michael Gostein, Luis Fialho, Luis Narvarte, Manuel Collares-Pereira, “Saharan dust transport to Europe and its impact on photovoltaic performance: A case study of soiling in Portugal”, Solar Energy, Vol. 160, pp. 94–102, 2018.
https://doi.org/10.1016/j.solener.2017.11.059
L. Fialho, R. Melicio, V.M.F. Mendes, “Poly-Si PV system grid connected and fuzzy controlled”, EUROCON 2015 - International Conference on Computer as a Tool (EUROCON), IEEE, Salamanca, pp. 1-6,
7
September 2015.
http://dx.doi.org/10.1109/EUROCON.2015.7313668
L. Fialho, R. Melício, V.M.F. Mendes, J. Figueiredo, M. Collares-Pereira, "Effect of shading on series solar modules: simulation and experimental results", Procedia Technology (Elsevier), Vol. 17, pp. 295–302, 2014.
https://doi.org/10.1016/j.protcy.2014.10.240
L. Fialho, R. Melício, V.M.F. Mendes, L. Rodrigues, S. Viana, and A. Estanqueiro, "Simulation of a-Si PV System Linked to the Grid by DC-DC Boost and Two-level Converter", 16th International Power Electronics and Motion Control Conference and Exposition – PEMC 2014, Antalya, Turkey, pp. 21-24, September 2014.
http://ieeexplore.ieee.org/xpl/articleDetails.jsp?arnumber=6980627%2F06980627
L. Fialho, R. Melício, V.M.F. Mendes, "PV system modeling by five parameters and in situ test", SPEEDAM International Symposium on Power Electronics, Electrical Drives, Automation and Motion, pp. 577-582, 2014.
http://ieeexplore.ieee.org/xpl/articleDetails.jsp?arnumber=6872097
Submitted papers (currently under peer review):
Ricardo Conceição, Hugo G. Silva, Luis Fialho, Francis M. Lopes, Manuel Collares-Pereira, “PV system design with the effect of soiling on the optimum tilt angle”, Renewable Energy, 2018.
List of conference posters
This thesis includes the following conference posters in the annexes:
Marios Theristis, Carolina Senabre, Emilio Gómez, Sonia Pinto, Luis Fialho, Emilio Muñoz, JonathanLeloux, “EU COST Action PEARL-PV: Performance and Reliability of Photovoltaic Systems: Evaluations of Large-Scale Monitoring Data WG5: PV in grids”, Conference 2018 NREL/SNL/BNL PV Reliability Workshop, USA.
https://doi.org/10.13140/RG.2.2.24190.48963
Luis Fialho, Tomás Fartaria, Manuel Collares Pereira, “Validation of a Energy Management Strategy for a BIPV System with a Vanadium Battery Demonstrator”, EU PVSEC 2015, European PV Solar Energy Conference and Exhibition, Hamburg, Germany.
Luis Fialho, Tomás Fartaria, Manuel Collares Pereira, Aitor Makibar, “Validation of a Energy Management Strategy for a BIPV System with a Lithium Ion Battery Demonstrator”, EU PVSEC 2015, European PV Solar Energy Conference and Exhibition, Hamburg, Germany.
8
Luis Fialho, Tomás Fartaria, Manuel Collares Pereira, “Performance Characterization of a Vanadium Redox Flow Battery”, EU PVSEC 2015, European PV Solar Energy Conference and Exhibition, Hamburg, Germany.
Submitted conference posters (currently under review):
A.B. Cristóbal, A. Martí, L. Navarte, I. Antón, G. Revuelta, L. Fialho, D. Hernández, R. Schwald, M. Ackermann, N. Tyutyundzhiev, I. Cuesta, E. Unger, B. Müller, R. Zilles and Carlos del Cañizo “Putting Open Science into Practice: The Photovoltaic Sector”. To be presented as a poster at the B-Debate “Open science: from values to practice. Building a roadmap for transformative change”. Barcelona, 4th-5th October 2018.
9
List of figures
FIGURE 1:GLOBAL PHOTOVOLTAIC INSTALLED POWER EVOLUTION [5] ... 13
FIGURE 2:POSITIONING OF DIFFERENT ENERGY STORAGE TECHNOLOGIES [7] ... 14
FIGURE 3:GLOBAL ELECTROCHEMICAL STORAGE INSTALLED POWER,1996-2016[10] ... 15
FIGURE 4:VANADIUM REDOX FLOW BATTERY OPERATING MODE [3] ... 112
FIGURE 5:SCHEMATIC MODEL OF A LITHIUM-ION BATTERY [7] ... 113
FIGURE 6:SELECTED SITE TO INSTALL THE VRFBMICROGRID (POLO DA MITRA) ... 114
FIGURE 7:SELECTED SITE TO INSTALL THE LIBMICROGRID (POLO DA MITRA) ... 115
FIGURE 8:VRFBMICROGRID ROOFTOP PV SYSTEM ... 116
FIGURE 9:SIMPLIFIED SCHEME OF THE VRFB MICROGRID (ORANGE ARROWS REPRESENT POWER FLOW) ... 116
FIGURE 10:THE SELECTED VRFB MODEL FOR THE MICROGRID ... 117
FIGURE 11.SIMPLIFIED COMMUNICATION SETUP OF THE VRFB MICROGRID ... 117
FIGURE 12.VRFB AT UEVORA.ON THE LEFT AND RIGHT THE ELECTROLYTE TANKS ARE VISIBLE, IN THE MIDDLE, THE CONTROL PANEL AND BEHIND IT THE STACK (NOT VISIBLE)... 118
FIGURE 13:INVERTERS AT THE VRFB MICROGRID:PV INVERTER (GRAY),EMSHOME BAT. INVERTERS (GREEN) ... 119
FIGURE 14:MICROGRID PC CONTROL SYSTEM ... 119
FIGURE 15.VRFB STACK: OUTLET PIPING (A), REFERENCE CELL (B) AND INLET PIPING (C). ... 120
FIGURE 16: SIMPLIFIED SCHEME OF THE LI-ION BAT. MICROGRID ... 120
FIGURE 17:CEGASA LIB INSTALLED IN THE MICROGRID ... 121
FIGURE 18:ENERGY MODULE (5.3 KWH).THE INSTALLED BATTERY IS COMPOSED BY SIX ENERGY MODULES. ... 122
FIGURE 19.COMMUNICATION SET-UP FOR THE LIBMICROGRID ... 123
FIGURE 20.LI-ION BATTERIES OF THE MICROGRID:CEGASA BATTERY(LEFT) AND LGRESU10 BATTERY (RIGHT) ... 123
FIGURE 21:INVERTERS AT THE LIB MICROGRID:PV INVERTER (LEFT),EMSHOME BAT. INVERTER (CENTER) AND SMA BAT. INVERTER (RIGHT) ... 124
FIGURE 22:GROUND INSTALLED PV STRINGS CONNECTED TO THE LI-ION BAT. MICROGRID ... 124
FIGURE 23:LGRESU10LI-ION BATTERY INSTALLED IN THE MICROGRID IN 2018 ... 125
FIGURE 24:MODULAR PROGRAMMING ... 126
FIGURE 25.DISPLAY INTERFACE OF THE CONTROL SOFTWARE MADE IN LABVIEW.VRFB FULL CHARGE-DISCHARGE CHARACTERIZATION CYCLES TEST SHOWING. ... 127
FIGURE 26:LABVIEW GRAPHICAL PROGRAMMING INTERFACE: EXAMPLE OF USAGE OF SUBFUNCTIONS TO READ THE POWER FACTOR AND RMSAC VOLTAGE WITH THE MULTIFUNCTION WATTMETERS. ... 128
FIGURE 27:PV DATALOGGER SOFTWARE OF THE VRFB MICROGRID (8TH AUGUST 2018PV PRODUCTION PROFILE SHOWING) ... 128
FIGURE 28:GRAPHIC OF A TWO-DAY PERIOD OF THE SELF-CONSUMPTION OPTIMIZATION STRATEGY RUN IN THE LIB MICROGRID. ... 149
FIGURE 29:GRAPHIC OF A TWO-DAY PERIOD OF THE SELF-CONSUMPTION OPTIMIZATION STRATEGY RUN IN THE LIB MICROGRID. ... 150
FIGURE 30.SELF-CONSUMPTION OPTIMIZATION RESULTS ON THE LIB MICROGRID. ... 151
Note: The figures of the scientific papers included in the chapters of this thesis are not included in this list to preserve all the formatting and numbering of the papers, presenting them as published in the journals.
10
Acronyms
AC Alternating Current BEV Battery Electric Vehicle
BIPV Building Integrated PhotoVoltaics BoS Balance of System
CAPEX CAPital EXpenditure
CPV Concentrating Photovoltaics CSP Concentrated Solar Power DC Direct Current
DOD Depth of Discharge
DSM Demand Side Management DSO Distribution System Operator DSO Distribution System Operator EC European Commission EMS Energy Management Strategy
EPC Engineering, Procurement and Construction ESS Energy Storage System
EU European Union EV Electric Vehicle FIT Feed-In Tariff
GPS Global Positioning System HMI Human Machine Interface
IEEE Institute of Electrical and Electronics Engineers IGBT Insulated-Gate Bipolar Transistor
IoT Internet of Things IT Information Technology KPI Key Performance Index
LCoE Levelized Cost of Energy (in €/kWh) LIB Lithium-Ion Battery
MPP Maximum Power Point
MPPT Maximum Power Point Tracking NOCT Normal Operating Cell Temperature O&M Operation and Maintenance
OPEX OPerational Expenditure PC Personal Computer
PERC Passivated Emitter and Rear Cell
11 PHEV Plug-in Hybrid Electric Vehicle
PID Potential-Induced Degradation PLC Programmable Logic Controller PPA Power Purchase Agreement PR Performance Ratio
PV Photovoltaic
PVCROPS PhotoVoltaic Cost reduction, Reliability, Operational performance, Prediction and Simulation
PWM Pulse Width Modulation RES Renewable Energy Sources RMS Root Mean Square
SCADA Supervisory Control and Data Acquisition SME Small and Medium Enterprises
SMES Superconducting Magnetic Energy Storage SOC State of Charge
STC Standard Testing Conditions TCO Transparent Conductive Oxide
TCP/IP Transmission Control Protocol / Internet Protocol THD Total Harmonic Distortion
TSO Transmission System Operator UEvora University of Évora
UPS Uninterruptible Power System V2G Vehicle to Grid
VRFB Vanadium Redox Flow Battery
12
C
HAPTER 1. Introduction
1.1 Motivation
In Greek mythology, Prometheus defies the gods by stealing fire and giving it to humanity, an act that enabled progress and civilization. Throughout history, humankind has been able to utilize energy in ways that other species have failed to attain, differentiating us as the dominant species on the planet. Developments in the production and use of energy have improved the economic and social aspects of our lives, influencing everything from quality of life and health to science and research.
However, the growth of humanity and the use of energy has left us in an increasingly fragile equilibrium with our planet. The use of non-renewable resources, at a rapid rate of acceleration since the industrial revolution, for the energy production of the growing world population places us facing a critical problem. These finite resources are being depleted and carbon emissions continue to cause large-scale environmental impacts. [1]
The extraction, transport and burning of fossil fuels often have negative impacts not visible in our daily lives. The extraction and transport of natural gas, for example, is often accompanied by important leaks of its main component, methane. Methane is a much more potent greenhouse gas than carbon dioxide, about 34 times more effective at trapping heat over a 100-year timescale and 86 times more effective over a 20-year timescale [2]. Also, the transport of these fossil fuels often has other disastrous environmental consequences for ecosystems such as the known examples of Exxon Valdez's spill of 262 000 barrels of oil in 1989 or the Prestige oil spill in 2002, releasing 64 000 tonnes of oil and affecting Portugal, Spain and France with this black tide. Also, burning fossil fuels emits several air pollutants as SO2, NOx or particulate matter, increasing respiratory problems as asthma, pulmonary infections or other chronic respiratory diseases with direct consequences on human health and lifespan.
However, humanity is taking action and facing the energy challenge with sustainable energy resources. In the past decades, global perceptions of renewable energy changed considerably and is viewed today as a tool for improved energy security, mitigation for climate change and a secure investment. Declining costs in recent years played a significant role in this expansion, being today cost competitive with fossil energy sources. [3]
Renewable energies as wind, tidal, hydropower, geothermal or solar represent a sustainable alternative with added advantages. Solar energy in particular is a vast and clean resource, a real alternative to fossil fuels.
The total solar energy reaching our planet far exceeds mankind’s total primary energy needs. An indication of the abundance of solar energy is, paradoxically, the threat of climate change itself. Solar energy technologies are coming of age and are increasingly cost competitive with conventional fuels.
Active solar technologies use photovoltaics (PV), concentrated solar power (CSP), solar thermal collectors and convert solar radiation into useful outputs. Passive solar techniques include selecting materials with favourable thermal properties, passive solar heating and
13 cooling/ventilation for buildings, natural illumination, etc. Active solar technologies increase the supply of energy and are considered supply side technologies, while passive solar technologies reduce the need for alternate resources and are generally considered demand side technologies. Solar fuels production, as hydrogen or other fuels should also be considered a potential to be explored, being attractive candidates for research and development. [4]
Figure 1: Global photovoltaic installed power evolution [5]
Global photovoltaic installed power in 2015 has reached 227 GW (Figure 1). Solar PV is a fast-growing market, with emerging countries starting to contribute to the global share. Rising demand for electricity and lower costs improve the market competitiveness for this technology. [5]
Solar PV already plays a substantial role in electricity generation in some countries. Once the share of electricity generated from variable renewable sources increases in our energy grids, it becomes necessary to compensate for generation shortages when resources are not available. Nonetheless, besides the need for storage technologies to replace parts of the power grid or support integration of large shares of variable solar power, a wide range of tasks are required today for the energy storage technologies to perform. There are numerous concepts today, from a decentralized approach where consumers consume, produce, and store their energy (prosumer) locally up to large grid support power storage facilities.
Storage technology is also now available at different stages of development, variable scale projects, and for meeting both short and long-term energy storage needs. Short-term storage technologies can compensate for output fluctuations ranging from milliseconds up to a few hours, whereas longer term or seasonal storage technologies can bridge the gap over several weeks (Figure 2) [6].
14
Figure 2: Positioning of different energy storage technologies [7]
Figure 2 legend: Zn-Cl = zinc chlorine flow battery; Zn-Air = zinc air flow battery; ZBFB = zinc bromine flow battery; VRFB = vanadium redox flow battery; PSB= polysulfide bromine flow battery; NaS = sodium sulphur; NaNiCI = sodium nickel chloride; NiCd = nickel cadmium; NiMH = nickel–metal hydride; SMES = superconducting magnetic energy storage.
Energy storage applications are increasing and range from bulk energy services as energy time shifting or on-site power, ancillary services as power quality and reliability (frequency, voltage regulation), black start, electric bill management or increased self-consumption, peak shaving, increased resilience of grids (e.g. stability of micro/minigrids), demand response, reliability of grid connected residential systems, the transport sector, etc.
In the transport sector, electric mobility still has a very marginal share, with electric vehicles (EV’s) representing less than 0.1% of the global vehicle fleet [8]. Most electric vehicles are still hybrid electric, generating electricity from recovering braking energy and with small electrochemical batteries. In some countries such as China, the Netherlands, Norway and the United States, plug-in hybrid-electric vehicles (PHEV’s) and battery-electric vehicles (BEV’s) have increased their sales numbers in the last few years with some countries already stating their will to completely ban fossil fuels vehicles in the future. Norway’s National Transport Plan 2018–2029 already states that all the new passenger cars and light vans sold in 2025 shall be zero-emission vehicles. [9]
In the last 20 years electrochemical storage facilities have grown significantly (Figure 3) due to investments stimulated by decreasing costs and improved performance.
15 Figure 3: Global electrochemical storage installed power, 1996-2016 [10]
Massive investments in lithium-ion battery technology (also driven by the electric mobility market) have led to lower costs associated with greater experience and know-how in setting up ever-increasing scale projects. The current dominance of the market share on the electrochemical storage technology belongs to the lithium-ion technology. However, alternative electrochemical storage technologies offer advantages of great evolutionary potential. The two main flow battery technologies (vanadium redox flow and zinc bromine flow) offer valuable operational advantages, as they can operate at ambient temperatures, and their power and energy storage characteristics are independently scalable. [11]
The recent energy storage developments are driven by more favourable markets and regulation, increased access to financing and the aging energy grid infrastructure. Nevertheless, there is a long way to go for their uptake by the market and for them to achieve their full potential. Some issues still need to be addressed involving bankability and trust of traditional financiers; the need to develop codes, standards and regulations for novel battery types and the development of new commercial and industrial applications for the new storage technologies. [12]
The last years brought advances in enabling technologies, such as hardware and software to support the integration of renewable energy. These included management systems aimed to optimise performance and energy storage. In the last few years, new technological concepts have emerged, such as the Internet of Things (IoT), blockchain technology, smart grids, vehicles as non-stationary batteries - vehicle to grid (V2G), higher performance PV modules (PERC/PERL cells, heterojunction cells, rear contact cells), floating PV plants...
Solar energy is in constant state of innovation with energy storage capabilities under development that will enable renewable energy sources like solar to play a larger role on our electric grid. The excitement to discover new and forward-looking ways to think about the future in a sustainable way is the main driver behind this work.
16
1.2 Research questions
Solar energy is a very active field of research and development. This work intendeds to find answers to several questions not clearly solved by the state of the art. The work methodology of this thesis was to follow these questions, which, in turn, guided and also provided new interrogations.
o How to model and simulate the photovoltaic modules with limited data?
o How to model and simulate the PV module integrated with inverter and the grid? o How to experimentally characterize and rehearse different battery technologies? o How to model and develop an optimized energy management strategy for a BIPV and
grid integration, maximizing self-consumption?
o How to experimentally validate an effective energy management strategy for a microgrid with BIPV and energy storage? Is it possible to replicate it and implement it with different ESSs?
o How to plan and design a smart microgrid with energy storage, demonstrating with real conditions and real scale environment? How to install and commission these systems? How to manage the operation and maintenance of these two different microgrids? The results achieved lead to several papers with answers that, by no means are claimed to be neither definitive or complete, but can certainly be seen as an initial contribution.
1.3 Thesis structure
The work for this thesis began with an approach to the question related to the modelling and simulation of a photovoltaic conversion and inverter, injecting to the grid. How to accurately model and simulate the photovoltaic conversion with a similar I-V curve requiring only the usual limited data provided by the manufacturers? How to validate the simulation results? An initial model for the identification of the five key parameters of the one diode equivalent electric model is presented in the first two papers of Chapter 2. Also, a study about the usage of this model and its behaviour with a gradually shaded PV plant was done and presented in the second paper of this Chapter.
The model has then evolved to a more accurate one, presented and validated in the last three papers presented in Chapter 2. These papers also present the models, firstly for the two-level converter and secondly for three two-level inverters, developed and integrated with the previous PV model and injecting into the grid.
Chapter 3 presents the installation and commissioning of the UEvora microgrids within the scope of the PVCROPS project. It includes the technical specifications of the systems of the microgrids, details about their programming and communication scheme and the outcomes of these infrastructures as well as its current status. Chapter 3 was included in this thesis since the scientific papers cannot clearly express the majority of the work time spent for the experimental and validation results of this thesis. Chapter 3 contains and explains the substantial effort made to provide the Renewable Energies Chair with an important capacity for the study of the
17 interfaces in BIPV, including innovative electric storage solutions. Experimental work of this nature is, on one side, a quite time-consuming process, implying unforeseen technical issues and inflating research costs. On the other side, it provides a higher control level enabling to replicate natural settings at faster speeds and providing real validation results. The work in question offered a valuable in-depth knowledge and experience on smart microgrid challenges and on how to overcome them. This chapter also presents the commercial and scientific outcomes for the project partners such as new product designs.
Chapter 4 presents the results of the characterization and performance tests as well as the energy management strategy rehearsal and validation. The EMS was modelled and developed taking into account real characterization parameters from the VRFB and LIB initial tests. The objective of the EMS within the paper presented is to maximize the self-consumption of PV energy. Several merit factors are introduced and used to assess the EMS results. Additional performance tests for the VRFB and LIB and EMS validation results with the LIB are presented in three conference posters, included in the annexes.
Chapter 5 points overall conclusions synthesizing the various issues and pointing a general work assessment. Intermediate and specific conclusions are drawn in each paper presented.
Chapter 6 discuss briefly future research lines regarding photovoltaic solar energy, PV systems as well as the integration of new electrochemical energy storage. Research opportunities and technology challenges are discussed envisaging a future powered by photovoltaic energy.
Where appropriate the thesis has its main body incorporating directly the scientific papers produced with relevance to each chapter, keeping in full the citation and bibliographic styles of the journals. Additional published papers (previously indicated) were also published with blind peer review on topics related to this thesis, but for simplicity and clarity sake were not included here. The published conference posters were included in the annexes.
18
References
[1] Comprehensive Energy Systems, Vol. 1, Part A, Energy Fundamentals, Ibrahim Dincer, Elsevier 2018.
[2] Myhre, G., D. Shindell, F.-M. Bréon, W. Collins, J. Fuglestvedt, J. Huang, D. Koch, J.-F. Lamarque, D. Lee, B. Mendoza, T. Nakajima, A. Robock, G. Stephens, T. Takemura and H. Zhang (2013), Anthropogenic and Natural Radiative Forcing. In: Climate Change 2013: The Physical Science Basis. Contribution of Working Group I to the Fifth Assessment Report of the Intergovernmental Panel on Climate Change.
[3] IRENA, IEA and REN21 (2018), ‘Renewable Energy Policies in a Time of Transition’. IRENA, OECD/ IEA and REN21.
[4] International Energy Agency, Cédric Philibert (2005), The present and future use of solar thermal energy as a primary source of energy, Paris, France.
[5] IEA PVPS (2018), 2018 Snapshot of global photovoltaic markets.
[6] REN21 (2017), Renewables Global Futures Report: Great debates towards 100% renewable energy.
[7] US DOE/EPRI (2015), DOE/EPRI Electricity Storage Handbook 2015, Sandia National Laboratories.
[8] OECD/IEA (2017), Global EV Outlook 2017. Two million and counting, International Energy Agency [Online]. Available at
https://www.iea.org/publications/freepublications/publication/GlobalEVOutlook2017.pdf (Accessed 1 October 2017).
[9] Norwegian Ministry of Transport and Communications, 2016-2017, National Transport Plan 2018–2029 [Online]. Available at
https://www.regjeringen.no/contentassets/7c52fd2938ca42209e4286fe86bb28bd/en-gb/pdfs/stm201620170033000engpdfs.pdf (Accessed 14 May 2018).
[10] US DOE Global Energy Storage Database (2018) [Online]. Available at http://www.energystorageexchange.org/projects (Accessed 14 May 2018).
[11] IRENA (2017), Electricity Storage and Renewables: Costs and Markets to 2030, International Renewable Energy Agency, Abu Dhabi.
[12] Paul Robson and Davide Bonomi (2018), Growing The Battery Storage Market 2018: Exploring Four Key issues, DUFRESNE – ENERGY STORAGE WORLD FORUM.
19
CHAPTER 2.
PV conversion and Inverters – modelling,
simulation and validation
2.1 Introduction
This chapter presents the initial work done for this thesis. Five scientific published papers are presented in this chapter about the PV conversion modelling and obtaining the I-V and P-V curves with two different models with unknown parameters identification. These papers also show the modelling of the power electronic converters and injection to the grid. All the models are then validated and compared with experimental results. Partial shading is also simulated in the second paper (Section 2.3) within this chapter. Additional papers were also published on these topics but were not included in this thesis for clarity sake and improved readability. All the papers were published with blind peer review.
2.2 PV systems linked to the grid: parameter identification
with a heuristic procedure
L. Fialho1, R. Melício2,3, V.M.F. Mendes3,4, A. Estanqueiro5, M. Collares-Pereira1 In Journal Sustainable Energy Technologies and Assessments, Vol. 10, pp. 29-39, 2015.
http://dx.doi.org/10.1016/j.seta.2015.01.006.
Abstract
This paper focuses on a PV system linked to the electric grid by power electronic converters, identification of the five parameters modeling for photovoltaic systems and the assessment of the shading effect. Normally, the technical information for photovoltaic panels is too restricted to identify the five parameters. An undemanding heuristic method is used to find the five parameters for photovoltaic systems, requiring only the open circuit, maximum power, and short circuit data. The I-V and the P-V curves for a monocrystalline, polycrystalline and amorphous photovoltaic systems are computed from the parameters identification and validated by comparison with experimental ones. Also, the I-V and the P-V curves under the effect of partial shading are obtained from those parameters. The modeling for the converters emulates the association of a DC-DC boost with a two-level power inverter in order to follow the performance of a testing commercial inverter employed on an experimental system.
Keywords: PV system; Power electronics; Parameter identification; Shading effect; Modeling, Simulation and experimental results.
1 Renewable Energies Chair, Universidade de Évora, 7002-554 Évora, Portugal 2 IDMEC/LAETA, Instituto Superior Técnico, Universidade de Lisboa, Lisbon, Portugal
3 Department of Physics, Universidade de Évora, Largo dos Colegiais 2, 7004-516 Évora, Portugal 4 Department of Electrical Engineering and Automation, Instituto Superior de Engenharia de Lisboa, R. Conselheiro Emídio Navarro, 1950-062 Lisbon, Portugal
20
1. Introduction
The demand for sources of sustainable energy, the shortage of fossil fuels and the need for carbon footprint reduction have resulted in a global awareness of the importance of alternative energy sources and efficiency in the use of energy [1]. Renewable energy sources are likely to have a significant role in the world energy supply in the upcoming future. Among the renewable energy sources, solar energy has ubiquity and abundance [2,3]. Hence, if technology find is way through the development of cheaper converts of solar into electric energy and with better efficiency, solar energy will eventually be the most important source of sustainable energy for power supply, delivering energy in the neighborhood of where it is needed [4,5].
Apart from the solar thermal exploitation, the spreading of PV systems is being encouraged by delivering energy in the neighborhood of where it is needed tariffs and by the price drop in crystalline cells [6]. At present, significant photovoltaic (PV) deployment has occurred, particularly in Germany, Spain and Japan [7]. PV energy has exceptional conditions in Portugal to be exploited, because this European country has significant levels of solar radiation to go into exploitation. Sunshine hours in the mainland of Portugal vary between 1800 and 3100 hours per year [8]. Hence, the country has a huge potential for solar energy exploitation, the biggest PV system is in Moura, with an installed capacity of 46 MWp.
A PV system directly converts solar energy into direct electric current energy. Solar cells are made of several types of semiconductors using different manufacturing processes [9]. The energy converted by a solar cell depends on the substrate properties, on the temperature of the junction and on the incoming solar radiation [10], known as irradiation. The solar radiation is composed of photons with different levels of energy. But not all photons are useful in order to originate the photo current, the remainder energy passes by or is adsorbed as thermal agitation, contributing to the definition of the temperature on the solar cell [11].
A PV array may be either a panel or a set of panels connected to form large PV systems with or without tracking systems. But, even with tracking systems a correct consideration of the space for the operational neighborhood have to be assessed to avoid mutual shading.
Power-electronic converters are usually used to process the direct electric current coming from PV system, for instance, are used as inverters to deliver an alternate current and may be used to: regulate the voltage and current at the load, control the power flow in grid-connected systems and implement maximum power point tracking (MPPT) [12,13]. Generally, the energy conversation by a PV system is assumed to be in a tight neighborhood of the maximum power point due to the MPPT. Hence, the normal useful working portion on I-V characteristic is in the neighborhood of maximum power, so the tuned curve should have higher precision at this portion [13]. Hence, this is an important point to be considered in the identification of the equivalent parameters of a model for the I-V characteristic.
The shading on the PV panel, for instances, due to a passing cloud or neighboring buildings causes not only energy loss in the conversion, but also further non-linearity on the I-V characteristics [14,15]. A non-protected shaded panel of a non-uniform illuminated PV system can be submitted to a negative voltage. If there is no protection, cells breakdowns can happen during non-uniform illumination. Hence, normally in order to protect the cells an extra p-n junction is implemented as a bypass diode. For instance, one bypass diode connected in parallel with each set of 18 cells [16] or with a panel is common practice as a compromise between protection and increase on the cost due to the extra p-n junction.
21 Also shading pattern with hasty change is not easy for the tracking of the maximum power point (MPP), because with non-uniform illumination usually there will be multiple local MPPs and they will change as fast as does the illumination. Under shadowing conditions a PV system can have large energy losses and even small shadows can noticeably affect the energy yield [17]. Modeling is an important part of engineering design. The use of computers and powerful software has allowed to predict the performance of complex systems and to assist the almost near optimal design for better systems. Not only simulation is possible, but also performance can be predicted and monitored in real time. In what regards PV modeling, researchers have used equivalent electrical circuits to model the characteristics of a solar cell when subjected to environmental variations, i.e., irradiance and temperature. The equivalent electrical circuit of a solar cell with its parameters has been a tool to emulate the I-V characteristics of PV systems
[7,18–20]. The equivalent circuit parameters of solar cells are intimately related to the internal solid-state physics acting within the solar cell [21,22]. The equivalent circuit parameters accessing is an important aspect for PV system applications in what regards the design and the simulation of those modules in order to uncover their behavior.
A PV system linked or not to the utility grid consists not only on solar cells, but also on several other apparatus, for instance: storage elements; power converters; control blocks. Hence, to have a correct evaluation is necessary that all models have enough accuracy in what regards the real behavior influencing the overall system performance [23].
By far, the simplest equivalent electrical circuits approach for a PV system is a current source in parallel with a diode [24]. Some authors state as a fact that the solution with a single diode model, i.e., current source in parallel with only one diode, for modeling a PV system integrated into the electric grid is enough to obtain satisfactory results [25]. But it seems to be dependent on what one considers by satisfactory results and what one wants to uncover about the reality in order to take proper action and avoid malfunction problems with the PV systems integration into the electric grid. An improved version for equivalent circuits is the five parameter modeling of the photovoltaic system, with the additional inclusion of a shunt and a series resistance. The shunt resistance accounts for the cell linkage current losses. The series resistance accounts for the joule losses. This version is justified for better accuracy and is the object of analysis in this paper in order to find a simple as possible parameter identification.
Typically, the parameters provided by the PV manufacturers are the open circuit voltage, the short circuit current, the current and voltage at maximum power, the temperature coefficients at open circuit voltage, short circuit current and the NOCT [26–28], but these parameters provide limited operational data for the five parameters modeling.
Power electronic converters have been developed for integrating renewable energy sources with the electric grid. The use of power electronic converters, i.e., inverters are particularly indispensable in PV systems, the inverter is necessary for two accomplishments: the accomplishment of adjusting the low DC voltage of the PV module to the voltage level of the electric grid using a two power converter topology, a DC-DC topology and a DC-AC topology; the accomplishment of the Maximum Power Point (MPP) tracking due to the fact of the power delivered by the modules being very sensitive to the point of operation in the I-V curve, the inverter is able to comply with functionality to circumvent this fact [29,30].
This paper focuses on the five parameters identification for the modeling of photovoltaic systems, using three solar cell technologies as a case study for the simulation of the I-V, shading characteristics and PV system implemented with a DC-DC boost and a two-level inverter topology. Experimental results are considered in this paper to allow a comparison with the ones
22
given by the modeling. The paper is organized as follows. Section II presents the solar cell model, the iterative procedure for the identification of the five parameters, the PV system with a DC-DC boost and a two-level inverter topology and the main expressions used in the modeling.
Section III presents the control strategy, consisting in pulse width modulation (PWM) by space vector modulation (SVM) associated with sliding mode (SM) for controlling the converter.
Section IV presents the case studies respectively the simulation and the comparison with the experimental results of the PV system linked to the electric grid by a commercial inverter. Finally, the conclusions are drawn in Section V.
2. Modeling
2.1 PV module
An improved parameter identification procedure of a photovoltaic module in order to acquire the I-V characteristics with the usual data given by the PV system industry is presented by the authors in [31]. The equivalent circuit model for a solar module simulation consisting on a current controlled generator, single-diode D1, shunt and series resistances, bypass protection
diode D2 is shown in Fig. 1.
Fig. 1. Equivalent circuit model for a solar module.
Also the equivalent circuit model can be used to simulate an individual cell. But if all cells of a module, a panel or array are subjected to the same irradiance, then the equivalent circuit with the bypass protection diode is also the one shown in Fig. 1, where G is the common solar irradiance, Rp is the equivalent shunt resistance, Rs is the equivalent series resistance, I is the
output current, D2 is the bypass diode and V is the output voltage, IS is the photo generated
electric current, Id1 is the current at diode D1 and Ip is the leakage current.
The thermal voltage of the solar cell is given by:
(1) where q is the electron charge, k is the Boltzman’s constant and T is the cell p-n junction temperature in [K]. The I-V characteristic associated with the equivalent circuit model shown in
Fig. 1 is given by:
(2) where I0 is the diode reverse bias saturation current. Equation (2) is an implicit equation,
implying the use of an iterative method to determine for instance the output current in function
Rs Is Rp Ip I G V + -D1 Id1 . D2 q kT VT = p S mV R I V S R R I V e I I I T S + − − − = + ) 1 ( 0
23 of the output voltage, considering (2) at short-circuit conditions the expression for is given by:
(3) The second term of (3) is usually small in comparison with the first term [13,32]. So, the approximation considered for is given by:
(4) From (2), considering the open circuit conditions, is given by:
(5) Substituting (4) into (5) and due to the fact that the exponential is much greater than one, is given by:
(6) The MPP of a PV system varies with solar irradiance and temperature [33]. An I-V characteristic curve has a unique operating point at a particular solar irradiance and temperature where energy is delivered at maximum possible power, known as the MPP. At this point the PV system operates at highest efficiency [33,34]. At condition of MPP holds the necessary following condition given by:
(7) This condition is also sufficient to identify the MPP, if there is no shading. The derivative of the current in (2) in order to the output voltage at MPP is given by:
(8) Using (7) and (8), satisfy the implicit expression given by:
(9) Substituting (4) into (2) at MPP condition and due to the fact that the exponential term is much greater than one, is approximated by the expression given by:
(10) Substituting (10) into (9) [13,32] is approximated by implicit expression given by:
(11) S I
(
)
) 1 ( 0 − + + = T s sc mV R I p p s SC S I e R R R I I S I(
)
p p s SC S R R R I I + S I p oc mV V S R V e I I T oc + − = 0( 1) 0 I T oc mV V p oc p s SC 0 e R V ) R R ( I I − − + 0 = + = MP MP MP MP V I V I V P ) 1 ( 0 p T mV R I V MP s MP MP MP mV R e I V R I V V I T s MP MP + − − = + MP I ) 1 ( ) ( 0 p T mV R I V s MP MP MP R mV e I R I V I T s MP MP + − = + 0 I T s MP MP mV R I V p MP p s MP sc e R V R R I I I + − − + − ( )( ) 0 MP I p T T MP p s MP sc s MP MP MP R mV mV V R R I I R I V I ( − )( − )( + )− +24
Assuming (11) as a good approximation [32], is approximated by the expression given by:
(12) and from (6) of [32] is implicit given by:
(13) An initial value for is derived assuming in (13) that and has a significant greater value, then holds the approximation given by:
(14) Hence, from (13) and (14) the initial value for [13,32] is given by:
(15) The ideality factor can be evaluated from (2) at maximum power point, replacing given by (4), given by (6) and taking logarithms [32]. Hence m is given by:
(16) Three values are defined in order to determine the initial value for m. The first is derived from (16) on the following assumptions and . Hence the first value [32] is given by:
(17) Because RS > 0, (13) has to satisfy the following implicit relation given by:
(18) The second value is obtained from (18) assuming and (14). The second value is given by:
(19)
To assure that RP < ∞, then the denominator in (12) must be greater than zero [32]:
(20) Hence, a weighting factor less than one should be considered in the right side of (20) to set up an equality, the factor assumed [32] is given by:
p R s MP T MP sc s MP MP MP T MP s MP MP p R I mV I I R I V V mV V R I V R − − − − − − ) )( ( ) ( s R ]} 2 ) ( ) ( [ ln { 1 MP p s sc oc p s sc T s MP T MP T MP oc MP s V R R I V R R I mV R I mV V mV V V I R − + − + − + − − = s R VMP+mVT −IMPRs VMP Rp 1 2 ) ( ) ( − + − + MP p s sc oc p s sc V R R I V R R I s R ] ) ( ln [ 1 0 T MP T MP oc MP s mV V mV V V I R − − S I 0 I ] ) )( ( ) ( [ ln MP p s MP sc oc p s sc T s MP MP oc V R R I I V R R I V R I V V m − + − − + − − → P R IMPRS VT MP sc sc T T MP oc g I I I V V V V m − − − = ln 0 MP p s sc oc p s sc T s MP T MP T MP oc V R R I V R R I mV R I mV V V V V m 2 ) ( ) ( ln − + − + − + − MP s MP T MP mV I R V V + − ] [ ln 0 T MP T MP oc S V V V V V m = − T MP MP sc s MP MP V I I I R I V m( − )( − )
25 (21) Finally, in (20) is considered equal to to establish the last value [32] given by:
(22) The value for the initialization is considered to be the minimum of the above three values. 2.2 MPP algorithm
The data needed for the algorithm are: the MPP data, i.e., voltage and the current ; the open circuit voltage and the short circuit current at STC. The initial values , , , , are respectively given by (17), (19), (22), (15) and (12). The ideality factor value [32] is given by:
(23) The calculation sequence to obtain an initial value of m is (17), (19), and (22) and (23).
The goal of the algorithm is to find, for the five parameters model, the values of the parameters m, , , and in order to give an approximation of the I-V curve, using information of the I-V curve given by the: short circuit point, maximum power point and open circuit point. Meaningless negative series resistance and infinite shunt resistance are avoided from this approach [32]. After the initialization, the values for , , , , are respectively computed from (16), (18) and (20) assumed as an equality, (13) and (12). It is used the difference between consecutive values as a stopping criteria for the iterative process [32]. As soon as the difference between two consecutive values is below a certain tolerance , the cycle ends.
Plotting the I-V characteristic curves requires solving (2) for or , considering the impossibility of having an explicit formulation, i.e., is an implicit equation, numerical methods as for instance the Newton-Raphson have to be used to solve a set of equation of the form for a set of discrete values V included in . This method is known by having the ability to overcome undesired behaviors [26].
The algorithm to adjust and plot the I-V curve characteristic of the solar cell is shown in Fig. 2.
sc MP I I / s MPR I VT T sc MP sc T MP P V I I I V V m0 = ( − )( − ) MP V IMP oc V Isc m0g m0s m0p 0 s R R0p ) m , m , m min( m kp k s k g k = s R Rp I0 Is k g m msk mkp k s R Rkp s R s R Rs
Isc
I0, V
0,Voc
) , (V I f I = 0 ) , ( ) , (V I =I−f V I = g
o,Voc
26
Fig. 2. Algorithm to adjust the I-V output characteristics of the solar cell.
2.3 DC-DC boost converter
The configuration of DC-DC boost converter in the simulated PV system is shown in Fig. 3.
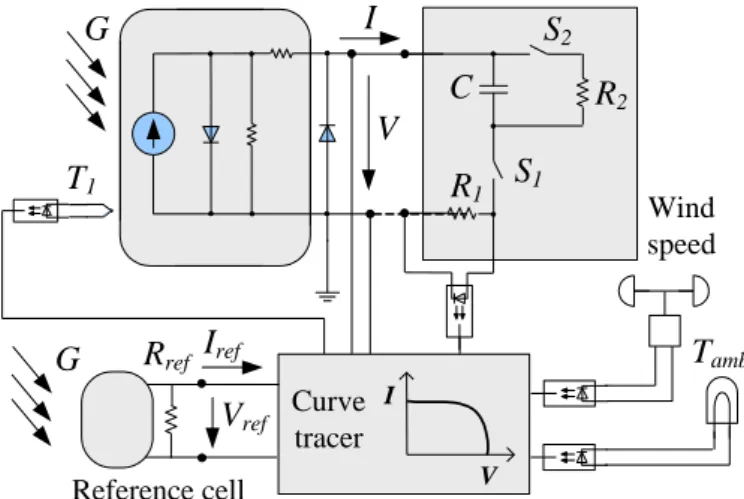
If Rsk – Rsk-1 < eRs mG0, ms0, mp0 m0 = min (mG0, ms0, mp0) Rs0, Rp0 Start VMP, IMP, Isc, Voc mGk, msk, mpk mk = min (mG k , ms k , mp k ) Rsk, Rpk m, Rs, Rp No Yes Io, Is Solve (2): Newton-Raphson Pmax, ePmax S0 D0 C Lf Rf Ln Rn Cf + -I LS vD0 iI V T G _ vdc iC vL
Boost converter Two-level inverter
PWM1 PWM2 G T Grid conditions MPPT Electric grid vdc* 0 1 SVM ← SM y=a,b,c Saa Sab Sac Sba Sbb Sbc y y y usy ufy ify iy uy PI PI h=a,b n=0,1
27
Fig. 3. PV system model with DC-DC boost and two-level inverter.
The DC-DC boost converter has one unidirectional commanded IGBT . The switching function of the DC-DC boost converter is described by the switching variables , used to identify the state of the IGBT and to identify the state of the diode D0 of the boost converter,
respectively. The constraints on the switching variable of the DC/DC boost converter [15] are given by:
(24) The array current is modeled by the state equation given by:
(25) where is the voltage at the PV array terminals, is the diode forward voltage at direct current, is the capacitor voltage.
The capacitor voltage is modeled by the state equation given by:
(26) where is the current injected at the inverter. At steady state the mean value of the voltage at the inductance terminals is null, given by:
(27) Hence, the DC-DC boost converter can be modeled by (24) to (27).
2.4 Two-level inverter
The two-level inverter is a DC-AC converter, with six unidirectional commanded IGBTs, has shown in Fig. 3. The inverter is connected between a capacitor bank and a second order filter, which in turn is connected to an electric grid. The groups of two IGBTs linked to the same phase constitute a leg of the converter. The two-level converter modeling assumes that: 1) the IGBTs are ideal and unidirectional and are never subject to reverse voltages, this is assured by the connection of an anti-parallel diode to each IGBT; 2) the diodes are ideal, i.e., in conduction state the voltage between their terminals is null, and in blockade the current that passes through diodes is null; 3) the voltage at the output of the boost converter is ; 4) each leg of the converter always has one IGBT on a conduction state. The switching function of each IGBT is described by the switching variable , identifying the state of the IGBT in the leg of the converter. The index with identifies the IGBT. The index with
identifies a leg of the inverter. The two conditions [35] for the switching variable of each leg are given by:
0 S 0 S = = = = = = = = ) 1 and 0 ( 1 and 0 ) 0 and 1 ( 0 and 1 0 0 0 0 D S D S S i ] ) v (v [v L 1 dt di dc D0 A s S = − + A v vD0 dc
v
dc v ) i ( 1 S I dc i C dt dv − = I i L v 0 ] dt ) v (v dt v [ T 1 v T T A dc T 0 A L=
+
− = hy S y 0 dc v y y h y h h { ba, } y y {a,b,c} y28
(28)
The topological restriction for the leg is given by:
(29)
Hence, each switching variable depends on the conduction and blockade states of the IGBTs. The current injected at the inverter is given by:
(30) where is the phase current at the output of the inverter.
2.5 Electric grid
The phase currents injected into the electric grid , considering the grid as an equivalent circuit given by a three-phase active symmetrical circuit as shown in Fig. 3, is given by:
(31)
Hence, the electric grid is modelled by (31).
3. Control strategy
A maximum power point tracking (MPPT) is used to extract the maximum power from a PV system which is under varying weather conditions [5]. The DC-DC Boost converter is used to implement maximum power operation of the PV system, controlling the voltage at the array terminals. The calculation of PV array output power requires solar irradiance and ambient temperature records, and therefore, records of these variables have been obtained for the adopted site [36]. The control of the boost converter includes the MPPT, using the algorithm to implement MPPT on the P-V curve of the array for each pair (G, T) [37]. The controllers used in the converters are classical PI controllers. PWM by SVM associated with SM control is used for controlling the converters. The SM control strategy presents attractive features such as robustness to parametric uncertainties of the PV array as well as to electric grid disturbances [34]. Sliding mode control is particularly interesting in systems with variable structure, such as power converters, guaranteeing the choice of the most appropriate space vectors. The aim of the sliding mode control is to let the system slide along a predefined sliding surface by changing the system structure. The control strategy of the PV system with DC-DC boost and two-level power converter topology using classical PI controllers has the diagram in box PWM1 and in box PWM2 shown in Fig. 3. The convenient vector selection to ensure stability for the converters, after being processed by the hysteresis comparator in the block of SM control and SVM are given in [35]. The SM control is a lower level of control as is normally implemented with the classical PI controller, for triggering the converters transistors is used PWM by SVM supplemented with SM. = = = = = ) 1 and 0 ( , 0 ) 0 and 1 ( , 1 by ay by ay y S S S S y {a,b,c} y
= = b a h hy S 1 y {a,b,c} I i
= = c a y y y I i i y i fki
) ( 1 y fy n fy n fy u i R u L dt di − − = y {a,b,c} V P 29 Power semiconductors have physical limitations to be considered during design phase and during simulation. Particularly, the switch frequency has to be a finite value, for instances, switching frequencies of 2 kHz, 5 kHz or 10 kHz are normally reported. The switch frequency finite value implying that an error has to be tolerated on the electric current, i.e., an error between the reference value and the control value of the current. The error trajectory in order to guarantee that the system follows the sliding surface , based on the Concordia transformation ( − ), has to be in a convenient neighboring of this sliding surface, implying the satisfaction of stability conditions [35] given by:
(32) The sliding surface in current practice is chosen in way to allow a small error for
has to be accepted due to power semiconductors switching only at finite frequency. Consequently, the switching strategy implemented by hysteresis comparators performing accordingly to the condition given by:
(33) The outputs of the hysteresis comparators are the integer variables for the two-level converter take the values [35] given by:
with (34)
The integer variables values indicate whether the error is within or outside the sliding surface. If the error is within the sliding surface, given by and , the converter IGBTs do not switch, maintaining the actual voltage vector, but if the error is outside of the sliding surface, the voltage vector that meets the coordinates is chosen, forcing the converter transistors to switch, in order to bring the error back into the sliding surface. For the two-level converter there are eight possible IGBTs combinations, which correspond to eight output voltage vectors and two voltage levels, lying between level and level , vector a0 and h0 are the vectors for level 0 and vectors from b1 trough h1 are the vectors for level1. The IGBTs switching state combinations with corresponding output voltage vectors and levels are shown in Table 1.
Table 1. IGBTs switching state combinations with corresponding output voltage vectors Vector Saa Sba Sab Sbb Sac Sbc a b c us/vdc us/vdc Level a0 0 1 0 1 0 1 0 0 0 0.0 0.0 0 b1 1 0 0 1 0 1 1 0 0 0.8164 0.0 1 c1 0 1 1 0 0 1 0 1 0 -0.4082 0.7071 1 d1 1 0 1 0 0 1 1 1 0 0.4082 0.7071 1 e1 0 1 0 1 1 0 0 0 1 -0.4082 -0.7071 1 f1 1 0 0 1 1 0 1 0 1 0.4082 -0.7071 1 g1 0 1 1 0 1 0 0 1 1 -0.8164 0.0 1 h0 1 0 1 0 1 0 1 1 1 0.0 0.0 0 e ) , (e t S 0 ) , ( ) , ( dt t e dS t e S 0 S(e,t) + − S(e ,t) ) , ( = ,
−1,0,1
0 = =0 0 = n n=130
The output voltage vectors in the plane for the two-level converter are shown in Fig. 4.
Fig. 4. Output voltage vectors for the two-level inverter.
The vector selection in order to ensure stability for the two-level converter is shown in Table 2.
Table 2. Output voltage vector selection for the two-level converter
-1 0 1
-1 e1 e1;f1 f1
0 g1 a0;h0 b1
1 c1 c1;d1 d1
Hence, the proposed control strategy for the power converters is given by (32) to (34).
4. Case studies
The mathematical modeling for the solar cell with single-diode, shunt and series resistances, for the MPPT algorithm and for the PV system with the DC-DC boost and the two-level power inverter topology is implemented in Matlab/Simulink. The simulation results were compared with experimental observation carried out for three different PV module technologies. The data measured from the PV modules were provided by [38], taken from a photovoltaic facility at the Laboratório Nacional de Energia e Geologia (LNEG) in Lisbon, Portugal. The coordinates for the PV modules site are: 38°46’18.50’’N, 9°10’38.50’’W. The tests were performed in clear sky days. Before experimental observation, the cover glass of each of the modules was cleaned in order to remove any residue that had been accumulated. Individual modules were unbolted and removed from the frame prior to testing. The module was then electrically disconnected from the remainder of the PV system and connected across the capacitive load test circuit in order to generate the I-V curve. To determine the module operating temperature, one thermocouple was attached to the back of the module near the center. The module was then replaced into the array frame and allowed to return to a steady-state temperature before the I-V curve was measured.