ELSEVIER
Agricultural Sysfems, Vol. 52, No. 2/3, pp. 3 17 329, I996 Copyright $; 1996 Elsevier Science Ltd Printed in Great Britain. All rights reserved
0308-521X196 %15.W+ 00 0308-521X(95)00077-1
Evaluation and Adoption of Irrigation Technologies. I.
Management-design Curves for Furrow and Level Basin
Systems
Francisco L. SantosDepartment of Rural Engineering, University of kvora, Apartado 94, 7001, Evora Codex, Portugal
(Received 12 March 1995; accepted 30 November 1995)
ABSTRACT
The eflect of average low-quarter requirement depth of irrigation and uni-
formity of applied water on the estimation of injlow rate and cutoff time of
furrows and level basins is evaluated, using the SRFR-surface irrigation
model and dtflerent intake rate soil characteristics. The optimum inflow
rate and cutofl time is dependent on the irrigation technology and injiltra-
tion characteristics. To assist in the task of on-farm water management of
furrows and level basin irrigation and the engineering design and planning
of these systems management, design charts are proposed that define the
optimum combination of injlow rate and cutof time, given values of
required depth and untformity of application. The charts are plots of aver-
age low-quarter requirement depth and untformity contours on axes oj
inflow rate and cutoff time. The general form of the curves shows that
technical trade-of between systems becomes evident as jlow rates and cut-
08 times decline as fields are levelled to zero slope and irrigated as basins.
The relative steepness and the dense nature of the level basin untformity
contour curves rejlect the importance of intense management and the
greater penalty for management errors with these systems as opposed to
furrows. Copyright 0 1996 Elsevier Science Ltd
INTRODUCTION
Studies concerning designing, improving or changing irrigation technolo- gies, and the associated economic feasibility have emphasized the impor- tance of water management and infiltration uniformity of water applied as important factors in supplying adequate water to meet crop demands.
Technical and economic evaluations of irrigation technologies indicate that some combination of water savings and yield increase is necessary to induce growers to adopt water conserving technologies (Daubert & Ayer, 1982; Wilson et aE., 1984; Coupal & Wilson, 1990). Research by Ayer & Hoyt (1981) also indicates that water savings are attainable with existing systems by improving water management practices. Profitability levels can be maintained, and in some cases increased, by reducing water use through improved infiltration uniformity.
The relationship between water application and the uniformity of infil- trated water over the field is described by Seginer (1978, 1983, 1987); Warrick dz Gardner (1983); Letey et al. (1984); Yitayew et al. (1985) and Warrick & Yates (1987). All have emphasized the importance of water management and infiltration uniformity as critical factors in meeting crop water demands. The quantity of infiltrated water is dependent on the technology, management decisions and soil infiltration characteristics. Water supply is subject to management decisions which control the rate, volume and timing of water applied, and hence the growth of the crop. Because crop water requirements are calculated based on crop evapo- transpiration (ET) and non-uniformity of infiltrated water increases water supplies, the important technical issue to consider when selecting an irri- gation system is the amount and timing of water applied and the impact of its spatial distribution on crop yields an’d nutrient percolation. Therefore, the uniformity of distribution of infiltrated depths becomes the critical input of the analysis.
The uniformity of the infiltrated water over the field is influenced by a large number of irrigation variables and parameters. For surface irrigation systems the important hydraulic variables are inflow rate, length of water run over the field, time of irrigation water cutoff, surface resistance to water flow, field slope, and soil infiltration rate characteristics of the soil. The combination of these variables may prove difficult to control making irrigation management very complex. According to Shatanawi & Strelkoff (1984) the opportunities afforded by dimensionless notation for presenting irrigation results in compact form has allowed the preparation of gen- eralized irrigation results for simple geometry and infiltration functions. However, selection of appropriate design and management parameters, i.e. inflow rate, cutoff time and required application depth, is not well- developed. They presented the concept of water requirement contours for an open-ended border irrigation.
The first objective of this paper is the development of generated man- agement-design charts to assist the task of on-farm water management and evaluation of furrows and level basin irrigation and the engineering design and planning of these systems. The charts define combinations of
Evaluation and adoption of irrigation technologies 319
the variables inflow rate and cutoff time for each required depth and uni- formity of application. The second objective is the management applica- tion of the charts for two selected irrigation regimes.
MATERIALS AND METHODS
To define the combinations of inflow rate and cutoff time for each required depth and uniformity condition and obtain the management- design charts, the SRFR model developed by Strelkoff (1990, 1991) was used to simulate the hydraulics of the surface irrigation. Input data for SRFR were developed by using the demonstration farm at the Maricopa Agriculture Center (MAC), a University of Arizona research and demonstration centre in central Arizona, USA. The principal crop is upland cotton. The field input values needed to simulate the hypothetical irrigation approximate the general conditions of the MAC’s fields under furrow and level basin irrigation with furrow lengths (L) of 240 m, furrow spacing of 10 m, field slopes (S,) of l/2000 and laser level- led basins of 180 m wide. The soil series are Trix, Casa Grande and Shontik, with different permeability and characteristics (Post et al., 1988; Soil Conservation Service, 1974). Trix is a deep, well-drained very slowly permeable soil whose upper horizons are formed in fine textured recently deposited alluvium. With total available soil water estimated as 015 cm/ cm and the SCS intake family as 045 overlies Casa-Grande soil material which is a deep, well-drained slowly permeable soil formed of old allu- vium. On the farm it is typically brown to reddish brown sandy loam or sandy clay loam, with increases in calcium carbonate content with depth. The total available soil water is estimated as 0158 cm/cm and the SCS intake family as 080. Contrasting with these two soils, Shontik is a deep, well-drained moderately to moderately rapid permeable soil found in sandy alluvium. It has a brown sandy loam surface horizon O-30 cm deep, and it is usually higher in sand content than the Casa-Grande surface horizon. The total available soil water is estimated as 02 cm/cm and the SCS intake family as 10.
Hydraulic model
The SRFR model used to simulate the hydraulics of the surface irrigation is based on numerical solution of volume- and time-integrated partial dif- ferential equations expressing the physical principles of conservation of mass and conservation of momentum, well established in mechanics. The assumption of a hydrostatic pressure distribution in the surface stream
leads to the Saint Venant equations governing unsteady, non-uniform flow in an open channel (Strelkoff, 1969). Comparisons of solutions of Saint Venant equations and the derived zero-inertia formulation, relied upon so heavily in SRFR, with border and furrow field measurements are reported in Katopodes & Strelkoff (1977) and Strelkoff & Souza (1984), respec- tively, and in the works of researchers cooperating with the US Water Conservation Laboratory in Phoenix, Arizona, USA (de Sousa et al.,
1993, 1995).
The model is a predictive tool to evaluate current surface systems, develop optimum management practices and improve design criteria. It assumes that the inflow of water is distributed evenly across the width of the strip of field to which water is introduced. Water is applied at a known volumetric rate, and the strip possesses known roughness and infiltration characteristics as well as known bottom configuration, length and down- stream-boundary conditions. The model outputs include infiltrated depths, volume of runoff and water application efficiency and various distribution indices. By varying inflow rates (qin) and cutoff times (t,,), SRFR generates hypothetical irrigation data for given field conditions. The model computes longitudinal variation of depth and discharge along the length of the surface at a sequence of times after the start of the irri- gation.
The duration of time water is on the soil surface with the opportunity to infiltrate calculated using the movement of the wave during stream advance and recession. With estimated values of wetted perimeter and opportunity time, the ultimate post-irrigation longitudinal distribution of infiltrated water depth is calculated.
SRFR model uses the Kostiakov infiltration equation to represent the intake characteristic of the soil at each irrigation. The equation has con- stants which define several soil parameters and is as follows:
Z = KtA + Bt + C
(1)
where
Z = cumulative intake (cm)
t = time that water is in contact with the soil (min)
K = constant (cm/hrA)
A = constant
B = constant (cm/hr)
C = constant (cm)
The constants may be defined using the Soil Conservation Service (USDA, 1979) intake families equation, described as follows:
Evaluation and adoption of irrigation technologies 321
(2) F=al++c
where
F = cumulative intake (mm)
T = time that water is in contact with the soil (min)
a = constant (mm/minb) b = constant
c = constant (mm)
Constants a, b and c are unique to each intake family and they also define several soil parameters. These constants are converted to fit the Kostiakov infiltration equation used by the SRFR model by the following:
SCS Kostiakov F/l0 Z (a/10)*60b K T t b A 0 B c/10 c
The soil intake families are related to infiltration parameters (Hart et al., 1980) that when converted to fit the SRFR result in Kostiakov infiltration equations yielding values of 2358, 3695 and 44436 cm/hr” for K, 0742, 0773 and 0785 for a, and 07 cm for c.
SRFR hydraulic calculations are based on the Manning equation (Kruse et al., 1983), which includes a coefficient (n) that expresses the flow retardance effects of different boundary conditions, variable with surface- altering management operations. Despite the likely variability, irrigated fields were simulated with the commonly used Manning flow retardance coefficient of 004 (Hart et al., 1980; de Sousa et al., 1995). The wetted peri-
meter of the furrows was computed with a power-law function of water depth in the channel, b = C * ym. Average values of 179 and 072 for C and m, respectively, were obtained from the MAC.
Management-design charts
The SRFR model was run for various levels of inflow rate (qjn) and cutoff time (t,,). Each system delivered enough water to the end of the field while not exceeding maximum non-erosive velocity. By varying qin and t,.,,, a grid of points of average low-quarter depths of water infiltrated (LQ), and the corresponding uniformity coefficients (UCC) were obtained. A griding algorithm, using kriging interpolation and search techniques (SURFER
Package), drew continuous lines through the points of equal uniformity and water depth, thereby producing a contour map. These two maps, when superimposed on one another, defined the combinations of inflow rate and cutoff time for each required depth and uniformity condition, and the management-design charts (Santos, 1990).
Figures l-3 present management-design charts for the three soils and irrigation systems considered. The general form of the curves shows that high uniformity is limited by the depth requirement and the quickness over which that requirement is met. For the three soils, the technical trade-off between systems becomes evident as flow rates and cutoff times need to fall as fields are levelled to zero slope and irrigated as basins. However, the increasing slope and density of the UCC reflect the impor- tance of timely management with level systems as opposed to furrow technologies.
Management-design charts: an application
An example set of calculations was performed to illustrate the procedure and the combined use of the charts and the SRFR model to provide management knowledge of surface irrigation systems use. The curves described are directly applicable to analysis, i.e. to determination of any set of irrigation inputs, qjn and t,,, given appropriate values of UCC and required depth of water to infiltrate (z,). Irrigation re-use systems are advisable to achieve high water application efficiencies with the higher chartered depths.
The irrigation application is given as an average low-quarter depth for each field and irrigation and defined by a desired management allowed deficiency (MAD) in the root zone (Hart et al., 1980). A value of 50% of the available water was used and corresponds to the general tendency to schedule surface irrigation to meet this root zone water depletion. This operating procedure minimizes the seasonal labour requirement and avoids wasting water. The allowable crop water stress assumption com- bined with the total available soil water estimated for the three soils and an average rooting depth of 120 cm for cotton suggests irrigation depths of 90, 95 and 120 cm, respectively, for the soils. Then, for each field irri- gation layout and soil type, two distinct and extreme management options, I and II, were selected from the charts with practice I repre- senting the highest possible uniformity and practice II the lowest possi- ble, while both satisfy the required depth. With this information and the relevant management-design levels of qin and t,, selected from the charts further simulations with the SRFR were performed to obtain the value of irrigation parameters. It is worth mentioning that these simulations
Evaluation and adoption of irrigation technologies 323
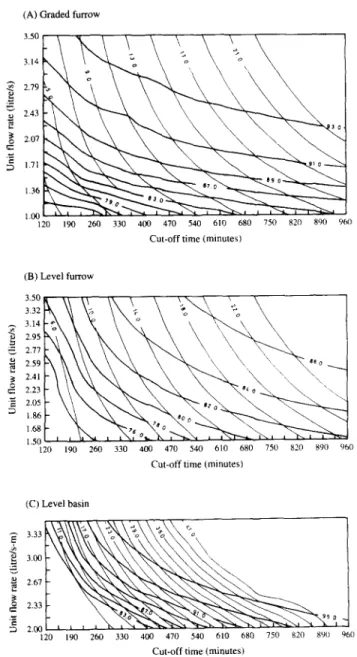
(A) Graded furrow
3 14 = P 2.79 s z 2.43 P g 2.07 c .-;: :: 1.71 1.36 1.00 120 190 260 330 400 470 540 610 680 750 820 890 960 Cut-off time (minutes)
(B) Level furrow
120 190 260 330 400 470 540 610 680 750 820 890 960 Cut-off time (minutes)
(C) Level basm
3 14
1 36 I.00
120 190 260 330 400 470 540 610 680 750 820 890 Cut-off time (mmutes)
Fig. 1. Management-design charts for Trix soil (intake family - 045). Uniformity UCC (thick line, percentage) and low-quarter depths (thin line, cm).
3.14 3 2.19 2 ; 2.43 z 2 2.07 E 3 1.71 1.36 1.00 120 190 260 330 400 470 540 610 680 750 820 X90 960
Cut-off time (minutes)
(B) Level furrow 3.14 zj 2.19 2 ; 2.43 e 5 2.07 c .Z ; I.71 1.36 IO0 120 190 260 330 400 470 540 610 680 750 820 890 960
Cut-off time (minutes)
CC) Level basin 3.35 ? 3.00 2 g 2.13 3 2.42 L 5 G 2.12 g 3 I.81 150 I20 I80 240 300 360 420 480 540 600 660 720 780 840
Cut-off time (minutes)
Fig. 2. Management-design charts for Casa-Grande soil (intake family - 080). Uniformity UCC (thick line, percentage) and low-quarter depths (thin line, cm).
Evaluation and adoption of irrigation technologies 325
were performed to irrigate a similar fraction of the cropland area ade- quately. Excess water that percolated below the required depth was con- sidered deep percolation and water that left the field, surface runoff.
Table 1 presents the selected design and performance variables for the three surface systems. Three measures of merit of irrigation are generated
(A) Graded furrow
2 2.19 2 ; 243 e g 207 r; .Z ; 1.71 I36 IM) 120 190 260 330 400 470 540 610 680 750 820 890 960
Cut-off time (mmutes)
(B) Level furrow 3 3.14 2 2.95 2 1 2.11 ; 259 3 2.41 2 2.23 z 2.05 3 1.86 1.68 1.50 120 190 260 330 400 470 540 610 680 750 820 890 960 Cut-off tmx (mmutes) (C) Level basin z 3.33 -k g 3.00 2 2 E 267 $ 2.33 .g 3 2.00 120 190 260 330 400 470 540 610 680 750 820 XYO 960
Cut-off time (minutes)
Fig. 3. Management-design charts for Shontik soil (intake family - IO). Uniformity UCC (thick line, percentage) and low-quarter depths (thin line, cm).
Soil and intake family Irrigation Irrigation Inflow rate Cutoff time Applied Infiltrated Runoff depth PELQ UCC LQDU Required technology option (Lb) (min) depth (cm) depth (cm) (cm) W) (%) (%) depth (cm) Trix (045) Graded furrow Level furrow Level basin
Casa- Grande (080) Graded furrow Level furrow Level basin
Shontik (1001 Graded furrow Level furrow Level basin
I 30 515 386 94 293 23 98 96 90 II 12 815 245 95 149 37 95 95 90 I 30 440 330 108 222 27 88 84 90 II 14 680 231 110 121 39 86 82 90 I 26 152 99 99 00 91 93 91 90 11 14 322 109 109 00 82 88 90 90 I 30 336 252 102 151 38 95 94 95 II 12 592 178 107 70 53 90 89 95 I 28 297 208 120 88 45 84 79 95 II 12 536 166 129 38 57 79 14 95 I 33 135 112 112 00 85 89 85 95 II 20 256 128 128 00 73 82 74 95 I 35 315 276 131 145 44 94 92 120 II 12 642 193 146 47 62 86 83 120 I 24 380 228 155 73 52 82 77 120 II 17 495 210 162 49 57 80 74 120 I 35 162 142 142 00 84 89 85 120 II 24 264 158 158 00 75 84 76 120 TABLE 1 Irrigation System Performance Under Alternative Management Schemes
Evaluation and adoption of irrigation technologies 321
by SRFR: the potential application efficiency of low quarter (PELQ), the Christiansen UCC and the low quarter distribution uniformity (LQDU). PELQ is the ratio of average LQ depth, when equal to MAD, to the average depth of water applied. It is a measure of how well the system can apply water if management is optimal (Merriam et al., 1980). UCC is the average depth infiltrated minus the average deviation from this depth, divided by the average depth infiltrated, and the LQDU coefficient is the ratio of the average LQ depth of irrigation water infiltrated to the average depth of irrigation water infiltrated.
Uniformity figures depend upon the required depth of application. Although other combinations of qin, t,, could have been obtained by decreasing the depth requirement, the management charts show that the selection of the appropriate surface irrigation method is mostly dependent upon the soil intake characteristic. This has a marked effect on the irriga- tion performance of the systems. The required depth is considered fixed rather than being a variable to conform with the available soil water and the customary farmer practice of scheduling irrigation at 50% soil deple- tion. The latter practice raises the soil water content of the root zone to its field capacity.
For the field conditions of low intake rate and irrigation by furrows, the charts of Fig. 1 show that the lowest contours lie very close to the 40 cm depth and still performs at high uniformity. This fact anticipates the effi- ciency figures reported in Table 1 and the need for irrigation practices of the cut-back type, return flow systems to recover the runoff or a conver- sion to level basin to improve irrigation efficiencies. Nevertheless, for all the intake family soils and required depths an optimal combination of potential water application efficiency and high uniformity can be obtained from the management-design charts by selecting the smaller flows. For level basins, optimal efficiency-uniformity combination are obtained from the management charts with larger flows which generate nearly instanta- neous water flooding over in the entire length of the field. Under these conditions, the duration of time water is on the soil surface is nearly uni- form so that the required depth of infiltration is obtained sooner and with a high uniformity.
CONCLUSIONS
The results obtained with the management-design charts and the SRFR model ensure their usefulness and future contribution to irrigation mod- elling and optimal on-farm water management of surface irrigation sys- tems. Concerning the design of irrigation systems, the predictive charts
can also help to determine, for the given set of conditions, the range of validity, the accuracy, and the maximum irrigation performance attain- able with the current USDA design charts (USDA, 1979; Hart et al.,
1980) based on empirical guidelines and improve design criteria.
Yet another critical contribution of the charts and the SRFR hydraulic model is their potential combined use to provide reliable yield estimate data for evaluation or for farm-level technology adoption decisions. With required uniformity and irrigation depth selected from the management- design charts, the quantity of water actually infiltrated in incremental parcels of the irrigated field can be generated and coupled with crop water functions to provide crop yield distributions and average seasonal crop yield estimates for the field.
REFERENCES
Ayer, H. & Hoyt, P. (1981). Crop-water production functions: economic impli- cations for Arizona. University of Arizona at Tucson, Agricultural Experi- ment Station, Technical Bulletin No. 242.
Coupal, R. H. & Wilson, P. N. (1990). Adoption water-conserving irrigation technology: the case of surge irrigation in Arizona. Agricultural Water
Management, 18, 15-28.
Daubert, J. & Ayer, H. (1982). Laser levelling and farm profits. University of Arizona at Tucson, Agricultural Experiment Station, Technical Bulletin No. 244.
de Sousa, P. L., Dedrick, A. R., Clemmens, A. J. and Pereira, L. S. (1993). Benefits and costs of laser-controlled leveling - A case study. In Water
Management in the Next Century, Trans. of the 15th Congress on Irrigation and Drainage, Vol. l-c, 444, R97: 1237-1247. ICID New Delhi, India.
de Sousa, P. L., Dedrick, A. R., Clemmens, A. J. & Pereira, L. S. (1995). Effect of furrow elevation differences on level-basin performance. Trans. of the ASAE,
38(l), 153-158.
Katopodes, N. D. & Strelkoff, T. S. (1977). Hydrodynamics of border irrigation - complete model. Journal of the Irrigation and Drainage Division (ASAE),
103, 309-324.
Kruse, E. G., Humpherys, A. S. & Pope, E. J. (1983). Design and operation of gravity or surface systems. In Design and Operation of Farm Irrigation
Systems, ASAE Mono. 3, ASAE, St. Joseph, MI, pp. 395443.
Hart, W. E., Collins, H. G., Woodward, G. & Humpherys, A. S. (1980). Design and operation of gravity or surface systems. In Design and Operation of Farm
Irrigation Systems, ASAE Mono. 3, ASAE, St. Joseph, MI, pp. 501-580.
Letey, J., Vaux, H. J., Jr. & Feinerman, E. (1984). Optimum crop water applica- tion as affected by uniformity of water infiltration. Agronomical Journal, 76,
435.
Merriam, J. L., Shearer, M. N. & Burt, M. C. (1980). Evaluating irrigation sys- tems and practices. In Design and Operation of Farm Irrigation Systems,
Evaluation and adoption of irrigation technologies 329
Post, D. F., Mack, C., Camp, D. P. & Suliman, A. S. (1988). Mapping and characterization of the soils on the University of Arizona Maricopa Agri- cultural Center. University of Arizona at Tucson, Hydrology and Water Resources in Arizona and the Southwest. Bulletin, 18.
Santos, F. L. (1990). Optimal Irrigation System Selection: A Multiperiod Quad- ratic Programming Approach. Ph.D. thesis, University of Arizona, Tucson, AZ, USA.
Seginer, I. (1978). A note on the economic significance of uniform water application. irrigation Science, 1, 19.
Seginer, I. (1983). Irrigation uniformity effect on land and water allocation.
Trans. of the ASAE, 26, 116.
Seginer, I. (1987). Spatial water distribution in sprinkler irrigation. Advances in Irrigation, 4, 119-167.
Shatanawi, M. R. & Strelkoff, T. (1984). Management contours for border irrigation. Journal of Irrigation and Drainage Engineering (ASCE), 110, 3933 399.
Strelkoff, T. S. (1969). The one-dimensional equations of open channel flow.
Journal of the Hydraulics Division (ASCE), 95, 861-876.
Strelkoff, T. S. & Souza, F. (1984). Modeling effect of depth on furrow infiltration. Journal of Irrigation and Drainage Engineering, 110, 3755387.
Strelkoff, T. S. (1990) SRFR - A Computer Program for Simulating Flow in Surface Irrigation. U.S. Water Conservation Lab., ARS-USDA, Phoenix. AZ, WCL Report 17.
Strelkoff, T. S. (1991) SRFR ~ a model of surface irrigation - version 20, Pro-
ceedings of the 1991 National Conference Sponsored by the Irrigation and
Drainage Division of the American Society of Civil Engineers and Hawaii
Section, ASCE. Honolulu, Hawaii. July 22-26, pp. 676682.
Soil Conservation Service (1974). Soil Survey of Eastern Maricopa and Northern
Pinal Counties. US Dept. of Agriculture, Washington, DC.
SURFER Package, Golden Software, Inc., P.O. Box 281, Golden, CO 80402, USA.
USDA (1979) Furrow irrigation. Ch. 5, Sect. 15 (Irrigation) Soil Conservation Service National Engineering Handbook.
Warrick, A. W. & Gardner, W. R. (1983). Crop yields as affected by spatial var- iations of soil and irrigation. Water Resources Research, 19, 18 1-186.
Warrick, A. W. & Yates, S. R. (1987). Crop yield as influenced by irrigation uniformity. Advances in Irrigation, 4, 169-l 80.
Wilson, P., Ayer, H. & Snider, G. (1984). Drip irrigation for cotton: implications for farm profits. Economic Research Service, U.S.D.A., Washington, DC, Agricultural Economic Report 5 17.
Yitayew, M., Letey, J., Vaux, H. J., Jr. & Feinerman, E. (1985). Factors affecting uniformity and optimal water management with furrow irrigation. Irrigation