R E S E A R C H A R T I C L E
Open Access
Longitudinal trajectory patterns of plasma
albumin and C-reactive protein levels
around diagnosis, relapse, bacteraemia, and
death of acute myeloid leukaemia patients
Kim Oren Gradel
1,2*, Pedro Póvoa
1,3, Olav Sivertsen Garvik
1, Pernille Just Vinholt
4, Stig Lønberg Nielsen
5,
Thøger Gorm Jensen
6, Ming Chen
7, Ram Benny Dessau
8, Jens Kjølseth Møller
9, John Eugenio Coia
10,
Pernille Sanberg Ljungdalh
11, Annmarie Touborg Lassen
12and Henrik Frederiksen
13Abstract
Background: No study has evaluated C-reactive protein (CRP) and plasma albumin (PA) levels longitudinally in patients with acute myeloid leukaemia (AML).
Methods: We studied defined events in 818 adult patients with AML in relation to 60,209 CRP and PA measures. We investigated correlations between CRP and PA levels and daily CRP and PA levels in relation to AML diagnosis, AML relapse, or bacteraemia (all ±30 days), and death (─30–0 days).
Results: On the AML diagnosis date (D0), CRP levels increased with higher WHO performance score (PS), e.g. patients with PS 3/4 had 68.1 mg/L higher CRP compared to patients with PS 0, adjusted for relevant covariates. On D0, the PA level declined with increasing PS, e.g. PS 3/4 had 7.54 g/L lower adjusted PA compared to PS 0. CRP and PA levels were inversely correlated for the PA interval 25–55 g/L (R = − 0.51, p < 10–5), but not for ≤24 g/L (R = 0.01, p = 0.57). CRP increases and PA decreases were seen prior to bacteraemia and death, whereas no changes occurred up to AML diagnosis or relapse. CRP increases and PA decreases were also found frequently in individuals,
unrelated to a pre-specified event.
Conclusions: PA decrease is an important biomarker for imminent bacteraemia in adult patients with AML. Keywords: Acute myeloid leukaemia, Plasma albumin, C-reactive protein, Infection, Inflammation
Background
The close monitoring of acute myeloid leukaemia (AML) patients in routine care includes an array of
biochemical specimens, amongst these C-reactive pro-tein (CRP) and plasma albumin (PA) that are performed repeatedly during the course of AML. Although AML comprises a group of heterogeneous diseases [1, 2], a common feature is the patient’s higher susceptibility to infectious complications, due to AML’s impact on the immune system or to treatments such as chemotherapy or stem cell transplantation [3]. Neutropenia-associated infection is thus the most common cause of death for patients with AML [1]. In real-life situations it may be difficult to assess the impact of inflammation on specific © The Author(s). 2020 Open Access This article is licensed under a Creative Commons Attribution 4.0 International License, which permits use, sharing, adaptation, distribution and reproduction in any medium or format, as long as you give appropriate credit to the original author(s) and the source, provide a link to the Creative Commons licence, and indicate if changes were made. The images or other third party material in this article are included in the article's Creative Commons licence, unless indicated otherwise in a credit line to the material. If material is not included in the article's Creative Commons licence and your intended use is not permitted by statutory regulation or exceeds the permitted use, you will need to obtain permission directly from the copyright holder. To view a copy of this licence, visithttp://creativecommons.org/licenses/by/4.0/. The Creative Commons Public Domain Dedication waiver (http://creativecommons.org/publicdomain/zero/1.0/) applies to the data made available in this article, unless otherwise stated in a credit line to the data.
1
* Correspondence:[email protected]
1Center for Clinical Epidemiology, Odense University Hospital, and Research
Unit of Clinical Epidemiology, Department of Clinical Research, University of Southern Denmark, Kløvervænget 30, Entrance 216, ground floor, 5000 Odense C, Denmark
2OPEN– Odense Patient Data Exploratory Network, Odense University
Hospital, J.B. Winsløws Vej 9 A, 5000 Odense C, Denmark Full list of author information is available at the end of the article
events (e.g. AML diagnosis or treatment). Studies that assess biomarker levels and their changes over time (lon-gitudinal studies) around well-defined events such as diagnosis, treatment, relapse, bacteraemia, or death may help elucidate this.
There is an abundant literature on CRP as a sepsis marker [4] whereas the literature on CRP in haemato-logical cancer patients is much sparser [5]. In leukaemia patients, we have only encountered few longitudinal stud-ies on CRP levels, all with 63 patients or less [6–10].
Numerous studies show that hypoalbuminemia is in-variably associated with a worse prognosis for a wide range of diseases [11, 12]. Hypoalbuminemia has trad-itionally been related to chronic conditions such as liver failure, malnutrition, or protein losing enteropathy [13,
14]. However, reviews [12,15–18] and studies in critic-ally ill patients [19–26] indicate that PA may be more important as an inflammatory biomarker, probably mainly related to PA extravasation as a result of capillary leakage. To our knowledge, no study has assessed the PA level as a biomarker of infectious episodes or other events in haematological cancer patients.
Longitudinal studies elucidate whether an abnormal level of the biomarker reflects an acute or a chronic ail-ment. We recently published longitudinal assessment studies of CRP and PA levels before and after community-acquired bacteraemia [27, 28]. Some of the main findings in these studies were the high inverse cor-relations between CRP and PA levels and changes. For CRP, changes over time are probably more valid as a mortality predictor than a single measurement [29], but whether this also applies to other outcomes than mortal-ity or to PA is unknown.
In this population-based retrospective study we were able to combine clinical, biochemical, microbiological, and vital status data for 818 AML patients with their 60, 209 specimens of CRP and PA. Using CRP as a gold standard inflammatory biomarker in these patients with AML, we determined three aims of the study: i) to relate CRP and PA levels to patient characteristics on the day of AML diagnosis; ii) to describe correlations between CRP and PA levels; and iii) to assess whether changes of daily CRP and PA levels were related to diagnosis, treat-ment, relapse, bacteraemia, and death.
Methods
Setting
In Denmark, the public health system is tax-financed and consequently free of charge for the individual pa-tient and the very few private hospitals are not engaged in management of haematological cancer. All adult (≥15 y) patients with AML are treated in highly specialized haematology departments in tertiary hospitals, which have geographically well-defined catchment areas.
Derivation of the study cohort
All Danish residents have a unique civil registration number used for all health contacts, which enables link-age between registries [30].
The Danish National Acute Leukemia Registry comprises patients with AML from January 2000, with prospectively recorded clinical and patient-related variables [31]. The AML diagnosis was veri-fied when patients were registered in the database and were based on WHO-defined criteria of blast percentage in bone marrow or blood as well as spe-cific cytogenetic and molecular aberrations [32, 33]. The day of diagnosis (D0) was defined as the day of retrieval of the bone marrow biopsy. The database covers 99.6% of all Danish adult patients with AML, with 90–100% positive predictive values and com-pleteness for almost all assessed variables [34]. From this registry, we retrieved all patients with AML who were followed at the Department of Haematology, Odense University Hospital (OUH), diagnosed from January 2000 through 17 May 2017 (last update at data retrieval). This department has the Region of Southern Denmark (~ 1,221,000 residents) [35] as its catchment area.
We linked data from these patients to the following registries: the Danish National Patient Registry (DNPR) [36], the Danish Civil Registration System (DCRS) [30], biochemistry laboratory information sys-tems (Netlab (Medasys S.A., Littau, Switzerland), BCC (www.cgi.dk/da), LABKA [37]), the OUH Patient Ad-ministrative System, and the microbiology laboratory information system MADS [38].
From the DNPR we retrieved comorbidity (excluding haematological cancers) from 1977 (first year of DNPR coverage) up to the patient’s AML diagnosis, as catego-rized by the Charlson Comorbidity Index [39].
We used the DCRS to retrieve the vital status as per 24 November 2017 (alive, dead, disappeared, or emi-grated, including dates of the latter three).
From biochemical specimens recorded in the labora-tory information systems we retrieved results for CRP and PA from January 2000 through 2017.
All blood cultures (BCs) were submitted to one of the four clinical microbiology departments (OUH, Hospital of Southern Jutland, Hospital Lillebaelt, Hospital of South West Jutland) in the Region of Southern Denmark. We had data on positive BCs covering 2000– 2016, though for 2000–2006 we only had data on BCs submitted to OUH. OUH recorded results in the OUH Patient Administrative System until 2005 and in MADS thereafter, whereas the other three clinical microbiology departments used MADS only.
We computed bacteraemic episodes from all positive BCs, using globally defined criteria [40].
Analyses of CRP and PA levels
CRP was measured with an immune-turbidimetric principle on modular P® (Roche, Mannheim, Germany). PA was measured on modular P® (Roche) by use of a bromocresol green dye-binding method. All specimen dates refer to date of draw of blood specimens.
Statistical analyses
The program Stata®, vs. 14, (StataCorp., College Station, TX, USA) was used for all analyses, except Fig. 1 for which R was used [41]. A two-sidedp < 0.05 was consid-ered statistically significant.
We only included dates of draw of blood specimens on which both CRP and PA were measured. If more than one measurement occurred on the same date we maintained the lowest level of PA and the highest of CRP, thus computing a specimen date as the analytical unit. A number of CRP results were recorded as < 10 mg/L (854/60,209 specimens [1.4%]) or < 5 mg/L (1842 specimens [3.1%]). We therefore randomly re-allocated all CRP levels < 10 mg/L to range from 0 through 9 mg/L, based on the distribution from 10 through 19 mg/L [27]. The same principle was used for CRP levels < 5 mg/L (range 0–4 mg/L, based on the 10–14 mg/L distribution).
Initially, we computed contingency tables of patient characteristics on D0. To assess whether these charac-teristics were associated with the CRP and PA levels on D0 we performed linear regression analyses, with CRP
and PA on D0 as outcomes. We included sex, age group (15–64, 65–80, + 80 y), body mass index (BMI) group in kg/m^2 (< 18.5, 18.5–24.9, 25–29.9, ≥30, unknown), Charlson comorbidity index (0, 1–2, > 2), WHO per-formance status (PS) (0, 1, 2, 3/4) [42], neutrophil granu-locytes in 10^9/L (< 0.5, 0.5–0.9, 1.0–1.4, ≥1.5, not measured), and percent blasts in the bone marrow (0– 19, 20–39, 40–59, 60–79, 80–100, not measured) on D0 as independent covariates in crude analyses and in ana-lyses adjusting for the same covariates.
To assess correlations between CRP and PA levels we com-puted a smoothed scatterplot with CRP for each PA level (in-tegers, ranging from 11 to 55 g/L, but 11–15 g/L merged with 16 g/L and 51–55 g/L merged with 50 g/L due to low num-bers) as a separate category. After visual inspection of the scat-terplot we computed Pearson’s correlation coefficients for all specimens and separately for 11–24 and 25–55 g/L.
For each patient, a time line was computed, with D0 and dates for the following events assigned a day in rela-tion to D0: first treatment after AML diagnosis, a bacter-aemic episode, first AML relapse, and death. For all patients we computed connected line plots with the CRP level in mg/L or the PA level in g/L on the y-axis and the time line (day in relation to D0) on the x-axis, with vertical lines for the above events. We truncated these connected line plots to only include results from 1 year before D0. Because the first treatment after diagnosis
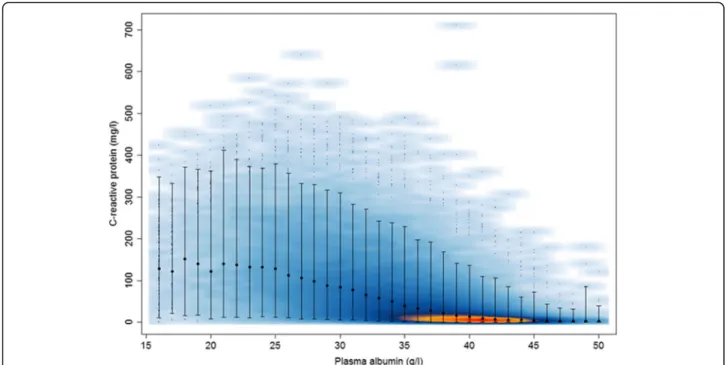
Fig. 1 Smoothed scatterplot of C-reactive protein and plasma albumin levels. A smoothed scatter plot of C-reactive protein levels (mg/L) in relation to plasma albumin levels (ranging from 11 to 55 g/L, but 11–15 g/L merged with 16 g/L and 51–55 g/L merged with 50 g/L), based on 818 patients with 60,209 specimens in which both CRP and PA were measured. The smoothed colour displays the density of overplotted points (red - > orange - > dark blue - > light blue represent decreasing density). The medians and 95% ranges of values are shown for each value of PA. 602 (1%) points from areas of lowest regional densities are plotted as small points
was generally very close to D0 we omitted this event in all subsequent analyses.
A clear inverse correlation between CRP and PA levels was observed, both overall and for most of the individual patients. This consistency enabled the merging of results into daily mean CRP and PA levels up to and after the de-fined events. PA levels were normally distributed, whereas CRP levels were right skewed. In accordance with a previ-ous study [27], longitudinal trajectories did not differ ac-cording to whether medians (interquartile ranges) or means (95% confidence intervals [CIs]) were used.
We therefore reported daily mean levels (95% CIs) of PA and CRP, computed from 30 days before through 30 days after the following events: AML diagnosis, first bac-teraemic episode after the AML diagnosis, and first AML relapse. For patients who died, we computed daily mean levels (95% CIs) of PA and CRP from 30 days be-fore through date of death.
Because we wished to assess PA and CRP trajectories around the selected events with as little impact as possible from the other events, we made some exclusions. For the AML diagnosis and relapse events, we excluded patients who had a bacteraemic episode within 30 days in relation to this event and death ≤30 days after the event. For the AML diagnosis event we further determined that the first bacteraemic episode should occur > 30 days after the AML diagnosis date. For the bacteraemic episodes, we ex-cluded patients if their bacteraemic episode occurred be-fore the AML diagnosis, ≤30 days after the AML diagnosis, within 30 days before or after the first AML re-lapse, or≤ 30 days before death. For death, we excluded patients for whom AML diagnosis, AML relapse, or bac-teraemia occurred≤30 days before death.
Because more severely diseased patients were likely to have more specimens taken, confounding by indication was an im-portant consideration. Hence, to evaluate the robustness of our results we did two things. Firstly, we computed the num-ber of specimens per day in the− 30/30 day interval. Secondly, to assess whether patients with more specimens contributed unequally to the results, we reiterated all plots of mean levels (95% CIs) by only including each patient’s first or last speci-men within the day intervals− 30/− 1, 0, and 1/30.
Results
Patient characteristics on D0
Table1shows patient characteristics on D0. A total of 818 pa-tients were diagnosed with AML between January 2000 and May 2017. Four-hundred and eight patients had 782 bacter-aemic episodes, 749 (95.8%) of which occurred on or after D0 and 583 of these (77.8%) occurred≤1 year after D0 (data not shown). Among the 491 bacteraemic episodes from 2007 through 2016, 452 (92.1%) were detected at the Department of Clinical Microbiology, OUH (data not shown).
Table 1 Characteristicsaof 818 patients with acute myeloid leukaemia (AML) Text Number (%)b Females 373 (45.6) Males 445 (54.4) Age, years Range 15.2–95.6
Median (interquartile range) 69.4 (59.3–76.8) Charlson comorbidity index
0 434 (53.1)
1–2 270 (33.0)
> 2 114 (13.9)
No. bacteraemic episodes
0 410 (50.1) 1 215 (26.3) 2 93 (11.4) 3 61 (7.5) 4 20 (2.4) 5–9 19 (2.3)
Microbiological isolates, first bacteraemic episode
Mono-microbial Gram-positive 349 (42.7) Staphylococcus aureus 27 (3.5) Coagulase-negative staphylococci 112 (14.3) Streptococcus pneumoniae 12 (1.5) Streptococci, other 10 (1.3) Enterococcus faecalis 134 (17.1) Other 54 (6.9) Mono-microbial Gram-negative 308 (37.7) Escherichia coli 127 (16.2) Klebsiella spp. 53 (6.8) Pseudomonas aeruginosa 30 (3.8) Other 98 (12.5) Mono-microbial fungi 18 (2.3) Poly-microbial 107 (13.7) Neutrophil granulocytes (10^9/L) < 0.5 182 (22.2) 0.5–0.9 78 (9.5) 1.0–1.4 44 (5.4) ≥ 1.5 215 (26.3) Not measured 299 (36.6)
Bone marrow biopsy blast percentage
0–19 14 (1.7)c
20–39 283 (34.6)
40–59 182 (22.3)
60–79 154 (18.8)
Linear regression analyses for CRP and PA on D0
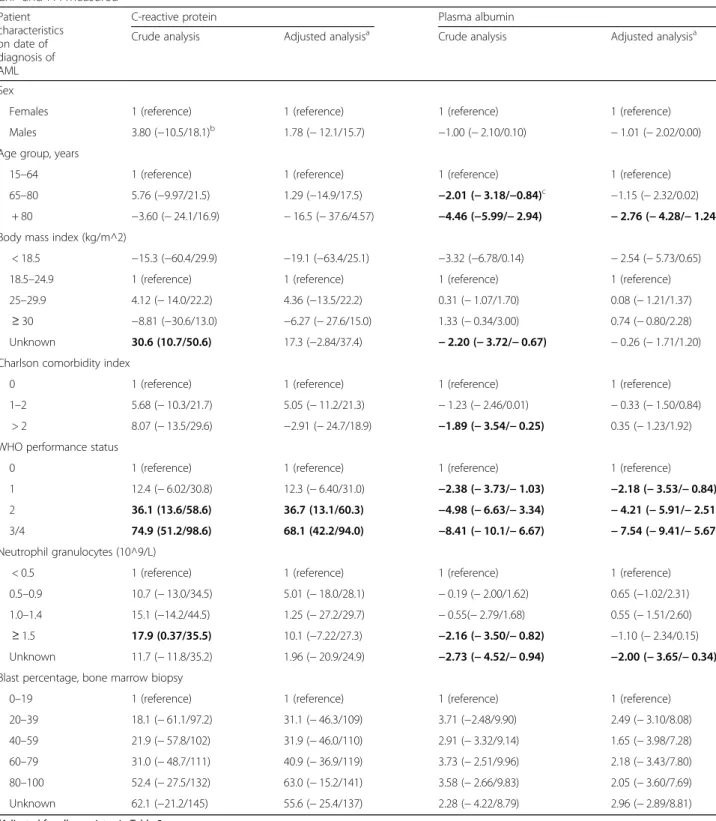
Results for the 491 patients (60.0%) with both CRP and PA measured on D0 are shown in Table2, which presents asso-ciations between patient characteristics, CRP, and PA at D0.
Regardless of significance, covariates with negative co-efficients for CRP had positive coco-efficients for PA and vice versa, except for age groups.
For CRP levels, results were similar in subgroups of sex, age, BMI, Charlson comorbidity index, neutrophil categories, and blast percentage categories, both in crude and adjusted analyses. A clear trend of increasing CRP on D0 was associated with increasing WHO PS, with im-material differences between the crude and adjusted co-efficients. Thus, patients with WHO PS 3/4 had an adjusted level of + 68.1 mg/L CRP in comparison to pa-tients with WHO PS 0.
PA levels were similar in the same subgroups as the CRP levels, except that it declined with increasing age group and WHO PS, with little differences between crude and adjusted analyses. Patients with WHO PS 3/4 had an adjusted PA level of− 7.54 g/L compared to pa-tients with WHO PS 0.
Correlations between CRP and PA levels
After merging PA levels of 11–15 g/L (n = 39) with 16 g/ L (n = 53) and PA levels of 51–55 g/L (n = 47) with 50 g/
L (n = 49) we computed Fig.1, which comprises 60,209 specimens. For these 60,209 specimens, the correlation coefficient R was − 0.54 (p < 10− 5), but as Fig. 1 shows, this inverse correlation was mainly seen in the range 25–55 g/L, for which R was similar (− 0.51, p < 10− 5,n =
56,796). For the remaining 3413 specimens, ranging from 11 through 24 g/L, no correlation was found be-tween the CRP and PA levels (R = 0.01,p = 0.57).
CRP and PA level trajectories for individual patients
Fig.2 shows CRP (left column) and PA level (right col-umn) trajectories for three patients randomly retrieved among patients with the following events: ≥1 bacter-aemic episode, AML relapse, and death. All trajectories were truncated to their earliest CRP/PA measurement ≤1 year before D0.
Patient 101 (upper row) had three bacteraemic epi-sodes on D74, D146, and D217 (vertical solid lines), an AML relapse on D217 (vertical dashed line), and died on D264 (vertical solid line on the right). Patient 127 (mid-dle row) had two bacteraemic episodes (D61, D258), an AML relapse on D231, and died on D270. Patient 170 (lower row) had three bacteraemic episodes (D15, D383, D674), an AML relapse on D650, and died on D1264.
CRP levels (left column) generally increased around bacteraemic episodes and prior to death, whereas fewer fluctuations were detected around AML-related events (diagnosis or relapse), although this may be difficult to detect visually for patient 170, because these events were close to two bacteraemic episodes. There were also CRP increases for which we were not able to determine an event that led to this, e.g. patient 101 around D30 and patient 170 around D100 and D1150. CRP was generally close to 0 mg/L in between its fluctuations.
PA (right column) fluctuated inversely to CRP, i.e. when CRP increased, PA declined and vice versa, both related and unrelated to the shown events.
Visual inspection of trajectory patterns for all 818 pa-tients (data not shown) generally showed the same pat-terns as described for the above three patients. This, together with the high inverse correlations between CRP and PA levels for PA levels≥25 g/L, enabled the feasibil-ity of computing CRP and PA level trajectories for the aggregated study population.
Trajectories around main events for aggregated data
Table S1 shows number of patients and specimens used for computing the trajectory curves for the aggregated data in the time span from 30 days before through 30 days after the event (except − 30/0 days for death). Fig-ure S1 shows number of specimens per day within the same time spans.
Table 1 Characteristicsaof 818 patients with acute myeloid leukaemia (AML) (Continued)
Text Number (%)b
Not measured 53 (6.5)
Intended treatment at AML diagnosis
Curative chemotherapy 501 (61.3) Palliative chemotherapy 91 (11.1) Best supportive care 218 (26.7)
Unknown 8 (1.0)
Vital status 1 y after the AML diagnosis date
Deceased 439 (53.7)
Alive 372 (45.5)
Unknownd 7 (0.9)
Vital status 2–5 y after the AML diagnosis date
Deceased 215 (57.8)e
Alive 96 (25.8)e
Unknownf 61 (17.5)e
a
On date of AML diagnosis, except for no. bacteraemic episodes and vital status data
b
Except for“Age, years”, cf. text c
These 14 patients had an extra-medullary AML location d
Less than 1 year between diagnosis date and latest vital status date (24 November 2017) on which they were alive
e
Denominator is the 372 patients who were alive 1 year after the AML diagnosis date
f
Less than 5 years between diagnosis date and latest vital status date (24 November 2017) on which they were alive
Table 2 Linear regression analyses of C-reactive protein and plasma albumin levels as dependent variables and patient
characteristics as explanatory variables on date of diagnosis of acute myeloid leukaemia (AML), based on 491 specimens with both CRP and PA measured Patient characteristics on date of diagnosis of AML
C-reactive protein Plasma albumin
Crude analysis Adjusted analysisa Crude analysis Adjusted analysisa
Sex
Females 1 (reference) 1 (reference) 1 (reference) 1 (reference) Males 3.80 (−10.5/18.1)b 1.78 (− 12.1/15.7) −1.00 (− 2.10/0.10) − 1.01 (− 2.02/0.00) Age group, years
15–64 1 (reference) 1 (reference) 1 (reference) 1 (reference) 65–80 5.76 (−9.97/21.5) 1.29 (−14.9/17.5) −2.01 (− 3.18/−0.84)c −1.15 (− 2.32/0.02)
+ 80 −3.60 (− 24.1/16.9) − 16.5 (− 37.6/4.57) −4.46 (−5.99/− 2.94) − 2.76 (− 4.28/− 1.24) Body mass index (kg/m^2)
< 18.5 −15.3 (−60.4/29.9) −19.1 (−63.4/25.1) −3.32 (−6.78/0.14) − 2.54 (− 5.73/0.65) 18.5–24.9 1 (reference) 1 (reference) 1 (reference) 1 (reference) 25–29.9 4.12 (− 14.0/22.2) 4.36 (−13.5/22.2) 0.31 (− 1.07/1.70) 0.08 (− 1.21/1.37)
≥ 30 −8.81 (−30.6/13.0) −6.27 (− 27.6/15.0) 1.33 (− 0.34/3.00) 0.74 (− 0.80/2.28) Unknown 30.6 (10.7/50.6) 17.3 (−2.84/37.4) − 2.20 (− 3.72/− 0.67) − 0.26 (− 1.71/1.20) Charlson comorbidity index
0 1 (reference) 1 (reference) 1 (reference) 1 (reference)
1–2 5.68 (− 10.3/21.7) 5.05 (− 11.2/21.3) − 1.23 (− 2.46/0.01) − 0.33 (− 1.50/0.84) > 2 8.07 (− 13.5/29.6) −2.91 (− 24.7/18.9) −1.89 (− 3.54/− 0.25) 0.35 (− 1.23/1.92) WHO performance status
0 1 (reference) 1 (reference) 1 (reference) 1 (reference)
1 12.4 (− 6.02/30.8) 12.3 (− 6.40/31.0) −2.38 (− 3.73/− 1.03) −2.18 (− 3.53/− 0.84) 2 36.1 (13.6/58.6) 36.7 (13.1/60.3) −4.98 (− 6.63/− 3.34) − 4.21 (− 5.91/− 2.51) 3/4 74.9 (51.2/98.6) 68.1 (42.2/94.0) −8.41 (− 10.1/− 6.67) − 7.54 (− 9.41/− 5.67) Neutrophil granulocytes (10^9/L)
< 0.5 1 (reference) 1 (reference) 1 (reference) 1 (reference) 0.5–0.9 10.7 (− 13.0/34.5) 5.01 (− 18.0/28.1) − 0.19 (− 2.00/1.62) 0.65 (−1.02/2.31) 1.0–1.4 15.1 (−14.2/44.5) 1.25 (− 27.2/29.7) − 0.55(− 2.79/1.68) 0.55 (− 1.51/2.60) ≥ 1.5 17.9 (0.37/35.5) 10.1 (−7.22/27.3) −2.16 (− 3.50/− 0.82) −1.10 (− 2.34/0.15) Unknown 11.7 (− 11.8/35.2) 1.96 (− 20.9/24.9) −2.73 (− 4.52/− 0.94) −2.00 (− 3.65/− 0.34) Blast percentage, bone marrow biopsy
0–19 1 (reference) 1 (reference) 1 (reference) 1 (reference) 20–39 18.1 (− 61.1/97.2) 31.1 (− 46.3/109) 3.71 (−2.48/9.90) 2.49 (− 3.10/8.08) 40–59 21.9 (− 57.8/102) 31.9 (− 46.0/110) 2.91 (− 3.32/9.14) 1.65 (− 3.98/7.28) 60–79 31.0 (− 48.7/111) 40.9 (− 36.9/119) 3.73 (− 2.51/9.96) 2.18 (− 3.43/7.80) 80–100 52.4 (− 27.5/132) 63.0 (− 15.2/141) 3.58 (− 2.66/9.83) 2.05 (− 3.60/7.69) Unknown 62.1 (−21.2/145) 55.6 (− 25.4/137) 2.28 (− 4.22/8.79) 2.96 (− 2.89/8.81) a
Adjusted for all covariates in Table 2 b
Coefficient (95% confidence interval) cBold types: statistically significant (p < 0.05)
CRP level trajectories for aggregated data around diagnosis, relapse, bacteraemia, and death
CRP levels showed no clear trend of increases or de-creases during the 30 days up to the diagnosis date (Fig. 3, upper row, left side). Most of the mean CRP
levels ranged from 55 to 95 mg/L in this period. There were no conspicuous changes in mean CRP levels when AML was diagnosed, but a minor increase started about 7 days thereafter, continuing to day 20 after which it de-clined again.
Fig. 2 Trajectories of C-reactive protein and plasma albumin levels for three patients. Trajectories of levels of C-reactive protein (CRP) in left column and plasma albumin (PA) in right column for three individual patients (designated patient 101, 127, and 170, using encrypted
identification numbers). Date of diagnosis of acute myeloid leukaemia (AML) is designated day 0 (D0) on the x-axis (with a solid vertical blue line) and all other days on the x-axis are depicted in relation to D0. The right-most solid vertical black line shows day of death. In between D0 and date of death, solid vertical green lines show day of diagnosis of a bacteraemic episode and the dashed blue line shows day of relapse of AML. All trajectories exclude specimens retrieved > 365 days before D0. For PA, the horizontal line of 35 g/L shows the threshold between
For AML relapses, trajectories before these events showed no clear changes (Fig. 3, second upper row, left side) where most of the mean CRP levels ranged from 40 to 80 mg/L. Approximately 15 days after the relapse, CRP levels started to increase, with a peak of ~ 100 mg/ L 30 days thereafter.
Mean CRP levels were steadily around 55 mg/L before a first-time bacteraemic episode (Fig. 3, second lower row, left side). On the bacteraemia date, it increased to ~ 100 mg/L, reaching a peak of ~ 160 mg/L 2 days later, after which it declined steadily, reaching a level of ~ 70 mg/L 30 days after the episode.
Mean CRP levels 30–14 days before death were rela-tively high (100–110 mg/L), but with no clear trend of in-creases or dein-creases (Fig. 3, lower row, left side). About 14 days before death, a clear increase commenced, termin-ating in mean levels of ~ 190 mg/L around death.
PA level trajectories for aggregated data around diagnosis, relapse, bacteraemia, and death
In the 30 days up to the diagnosis date, mean PA levels fluctuated around 35 g/L, with no clear trend of in-creases or dein-creases (Fig.3, upper row, right side). A de-cline commenced the day after diagnosis, continuing to a steady level of ~ 31 g/L about 20 days later.
The trajectories around AML relapses (Fig. 3, second upper row, right side) did not deviate materially from those described for the primary AML diagnosis.
Before the first bacteraemic episode, mean PA levels were steadily around 33–34 g/L (Fig.3, second lower row, right side). It declined on the bacteraemia date, reaching a nadir of ~ 31 g/L 2 days thereafter, after which a slow in-crease commenced, though pre-bacteraemic levels were not reached 30 days after the bacteraemia date.
Before death, the mean PA levels were steadily around 31 g/L until 14–17 days before, where a decline com-menced (Fig. 3, lower row, right side). On the date of death, a mean level of ~ 27 g/L was reached.
Comparisons between CRP and PA level trajectories for aggregated data
The inverse correlations between CRP and PA levels de-scribed above for cross-sectional data (Fig.1) and for in-dividual patients (Fig. 2) were in the longitudinal data descriptions also seen around bacteraemia and AML re-lapse, and before death, but were less consistent around AML diagnosis. Treatment data (Table 1) enabled the
computation of Figure S2, which shows a decline in PA levels after diagnosis/treatment, both for curative and palliative treatments, whereas no decline was seen if best supportive care was given. For CRP, we computed simi-lar figures in relation to treatment modality, but there were no conspicuous differences between these trajec-tories (data not shown).
Reiteration of trajectory plots with each patient’s first or last specimen
The inclusion of each patient’s first or last specimen within each of the three periods day− 30/− 1, day 0, and day 1/30 in relation to the event reduced the numbers of specimens considerably (Table S1). Due to this, many trajectory curves had very wide CIs (data not shown). There were, however, no conspicuous deviations from the trajectories depicted in Fig.3(data not shown).
Discussion
We found high inverse correlations between CRP and PA levels in 818 adult patients with AML. On D0, the linear regression analyses showed minor differences between the univariate and multivariate analyses, which corroborate our results. In cross-sectional analyses of all 60,209 speci-mens, R was− 0.54 (p < 10− 5), though a threshold of 24 g/ L PA was detected below which no correlation was found. In longitudinal analyses, increasing CRP levels and de-creasing PA levels were detected around bacteraemic epi-sodes and prior to death, but also frequently unrelated to events defined beforehand in our study population. In contrast, minor changes in CRP and PA levels were found in relation to AML events (diagnosis or relapse), with the exception that PA levels decreased after diagnosis.
We used the CRP level as a gold standard measure of the magnitude of inflammation. Moreover, a bacteraemic episode is an infection based on well-defined microbial and globally accepted criteria [40]. In order to more closely assess“pure” infection-related, AML-related, and death-related events in the longitudinal analyses we ex-cluded other events types occurring within 30 days.
Our main hypothesis was that PA is an inflammatory biomarker. This was indicated due to its inverse correl-ation with CRP levels and in relcorrel-ation to its rapid changes over a few days that cannot be explained by a change of the patient’s nutritional status or chronic ailments, also given PA’s long half-life of 20 days [43]. Moreover, PA was not correlated to BMI at diagnosis, which (See figure on previous page.)
Fig. 3 Daily mean levels of C-reactive protein and plasma albumin, aggregated data. Daily mean levels (95% confidence intervals) of C-reactive protein (CRP) in left column and plasma albumin (PA) in right column, in relation to an event (vertical solid line). Events are, from top to bottom: diagnosis of acute myeloid leukaemia (AML), relapse of AML, first bacteraemic episode, and death. Time spans covers from 30 days before to 30 days after the event, except for death that shows 30 days before death. Events occurring earlier than 30 days in relation to another event were excluded
corroborates that it is not a useful biomarker of nutri-tion [12,15–18]. Interestingly, the inverse correlations between CRP and PA levels were clearly depicted with increasing WHO PS. WHO PS is, regardless of disease entity, a strong prognostic predictor and fur-ther refinement by the incorporation of CRP and PA levels/changes deserves further attention. In recent years, indices based on CRP and PA levels, such as the Glasgow Prognostic Score [44] or the CRP/PA ra-tio [45], have shown high prognostic predictability for several cancer types. However, the numerous studies focused on solid cancers, they were cross-sectional, and revealed little about possible mechanisms related to the prognostic predictability [44, 45].
Although PA as an inflammatory biomarker was a main finding due to its inverse correlations with CRP levels and changes, other mechanisms were probably also involved in hypoalbuminemia: no correlations between PA and CRP levels were seen for PA < 24 g/L and PA levels decreased shortly after the diagnosis of AML, unparalleled by in-creasing CRP levels. The latter was explored for treatment subgroups (curative treatment, palliative treatment, best supportive care), indicating that fluid therapy given during treatment could explain this (Figure S2).
Already in 1863, Rudolf Virchow detected leukocytes in neoplastic tissues and thus found a connection be-tween cancer and inflammation [46]. In 1986, Dvorak described tumours as “wounds that do not heal” [47]. During the last two decades, the research field of cancer and inflammation has experienced a renaissance [46,48,
49]. A review concluded that cancer patients generally had higher CRP levels than controls [50], but as 81 of the 90 studies were cross-sectional we do not know whether the higher CRP levels occurred before the can-cer or vice versa.
Smaller studies of longitudinally measured CRP in leukae-mia patients (n = 20–63) found that CRP levels > 100 mg/L correlated temporally with infectious episodes [6–10]. Some of these studies also assessed CRP levels in leukaemia relapse episodes, which were generally much lower than 100 mg/L [6, 7, 9]. To our knowledge, no study has assessed PA as a biomarker of infectious or cancer episodes in haematological cancer patients, or in any other cancer patient group.
In the present study, the CRP and PA trajectories around the bacteraemic episodes did not deviate from what we have reported for 2472 adult community-acquired bacteraemia patients [27]. This indicates that the pathogenesis related to CRP and PA changes around a bacteraemic episode probably does not differ in rela-tion to the patient group or the degree of immunosup-pression. Moreover, much smaller or no CRP and PA changes were detected around AML-related events, which accordingly had little impact on changes around the bacteraemic episodes.
For the AML-related events, the interpretation of the longitudinal CRP and PA trajectories is less straightfor-ward than for the bacteraemic episodes. Firstly, due to low numbers of specimens, caution in interpretation is especially warranted up to the diagnosis and around the relapse. Secondly, although we excluded diagnosis or re-lapse events for which a bacteraemic episode occurred within 30 days we also found numerous CRP increases and PA decreases that were temporally unrelated to a bacteraemic episode (Fig.2). This is also found in studies with many non-bacteraemic infectious episodes detected from medical records [6–10]. Thus, other infections than bacteraemia occur close to AML-related events in our study. In spite of these caveats, there were little changes in CRP and PA levels around the AML-related events.
The inverse correlations between CRP and PA levels were also seen in the last 14 days up to death. Even before this 2-week period, mean CRP levels were above 100 mg/ L, indicating an ongoing inflammation, and mean PA levels were ~ 30 g/L (i.e. hypoalbuminemia). A recent Swedish study assessed CRP and PA levels up to the death of 155 incurable cancer patients [51]. Though numerous studies have assessed biomarkers of mortality in cancer patients [52], no other study has to their (and our) know-ledge assessed CRP and PA levels in the last 2 months be-fore patients’ death. In the Swedish patients, the median CRP and PA levels in the last month before death were 84 mg/L and 23 g/L, respectively. In our study, 654 pa-tients with 5739 CRP/PA specimens in the last month be-fore death had median CRP and PA levels of 108 mg/L and 29 g/L, respectively (data not shown), thus higher CRP and PA levels. Most of the Swedish patients had a broad spectrum of solid tumours, which may in part ex-plain these discrepancies. Unfortunately, the Swedish study did not report longitudinal trajectory patterns, which further hampers comparisons to our study.
In this hypothesis-generating study we have mainly ported descriptive results. We purportedly have not re-ported discriminatory measures (e.g. sensitivity or positive predictive values). This is mainly due to our def-initions, which are not globally defined, and the lack of accurate detection of non-bacteraemic infectious epi-sodes. We had data for all the patients’ hospital admis-sions as from 1977 and their outpatient visits as from 1995, each with all recorded diagnosis codes [36]. Al-though the validity of recorded infections may be satis-factory (high positive predictive values as reviewed by [36]) it is dubious whether all infections are recorded in the administrative registries. As only 32.3% of 58,139 bacteraemic episodes were recorded properly in the DNPR [53], milder, and less well-defined, infections were probably even recorded less.
The main strengths of this study are the population-based design (including virtually all adult patients with
AML from a geographically well-defined region), complete follow-up, and the high number of patients and specimens. Previous studies on longitudinal CRP analyses in leukaemia patients have included 20–63 pa-tients [6–10] and our study is the first to assess PA. The high number of patients and specimens enabled longitu-dinal analyses and a two-stage approach in which we first assessed all 818 patients individually and thereafter aggregated their data. Clinically relevant variables of high validity and with few missing values [34] were avail-able at the time of the AML diagnosis. We had valid data on bacteraemic episodes, representing well-defined and globally accepted criteria [40].
Our study also has important limitations. Firstly, most studies that evaluate biomarkers longitudinally are pro-spective, which enables the retrieval of the same num-bers of specimens from all patients, regardless of their current health status. In our retrospective study with its real-life data we expect more specimens from patients with complications, thus confounding by indication may be a concern. This was the main reason for reiterating analyses by the incorporation of each patient’s first or last specimen within pre-specified periods. This did not alter the trajectories materially (data not shown), which is also in accordance with our recent study focusing on this particular aspect [28]. Secondly, non-bacteraemic in-fectious episodes were not defined and as stipulated above we do not believe this can be done validly from administrative registries, such as the DNPR. Moreover, patients with AML frequently receive prophylactic anti-biotics and antimycotics, which will often result in culture-negative microbiological specimens although they clearly have an infection. Thirdly, though the gen-eral number of specimens was high, it was low before the AML diagnosis and around AML relapse. Prior to diagnosis of an acute disease, such as AML, it will prob-ably even to a higher degree than described above be the frailer patients from whom specimens are retrieved due to several other reasons than AML per se. Thus, trajec-tories before the AML diagnosis should be interpreted with extra caution, whereas they are probably more rep-resentative for the whole study population in the time period adjacent to and after the diagnosis. Fourthly, we had few clinical variables after the time of diagnosis, of which e.g. BMI and antibiotic/anti-fungal treatment could have been interesting to follow longitudinally. Fi-nally, from 2000 through 2006 we only had microbio-logical data from OUH, covering 291 bacteraemic episodes. As 452 of the 491 bacteraemic episodes (92.1%) in 2007–2016 were from OUH, we “missed” ~ 30 episodes given the same distribution between OUH and the other three clinical microbiological departments in 2000–2006. Moreover, 10 patients had AML diag-nosed in 2017 from which we had no BC results.
However, these estimated “missed” 35 bacteraemic epi-sodes (4.5%) will have very little impact on our results.
Conclusions
The PA level is an important inflammatory biomarker in adult patients with AML. The incorporation of the PA level, together with the CRP level, in mathematically well-founded prediction models deserves further atten-tion. Models that will be able to predict infections or death will be useful for clinicians, both for AML and other immunocompromised patients.
Supplementary information
Supplementary information accompanies this paper athttps://doi.org/10. 1186/s12885-020-06754-z.
Additional file 1 Table S1: Numbers of patients and specimens in the aggregated trajectory analyses.
Additional file 2 Figure S1. Daily numbers of specimens measuring both C-reactive protein and plasma albumin, from 30 days before through 30 days after diagnosis of acute myeloid leukaemia (AML), re-lapse of AML, and first-time bacteraemic episode after AML, and from 30 before through date of death. Only comprises specimens in relation to these events if other events occurring≤30 days were excluded. Figure S2. Daily mean levels (95% confidence intervals) of plasma albumin in re-lation to diagnosis of acute myeloid leukaemia (left column) or treatment (right column), stratified according to curative chemotherapy, palliative chemotherapy, or best supportive care). Time spans cover− 30/30 days in relation to diagnosis/treatment. Events occurring≤30 days in relation to another event were excluded.
Abbreviations
AML:Acute myeloid leukaemia; BC: Blood culture; BMI: Body mass index; CI: Confidence interval; CRP: C-reactive protein; D0: Day of diagnosis of acute myeloid leukaemia; DCRS: Danish Civil Registration System; DNPR: Danish National Patient Registry; OUH: Odense University Hospital; PA: Plasma albumin; WHO PS: WHO performance score
Acknowledgements Not applicable.
Authors’ contributions
KOG, PP and OSG initiated and designed the study. KOG, OSG and RBD analysed the data. TGJ, MC, RBD, JKM and JOC provided the microbiological data. All authors have revised the manuscript and approved the final manuscript.
Funding
There was no funding for this study.
Availability of data and materials
According to Danish law, national health data cannot be made publicly available. However, analytical schemes in the form of Stata do-files can be reviewed through reasonable request from the corresponding author.
Ethics approval and consent to participate
According to Danish legislation, no approval from an ethics committee or consent from participants is required for registry-based studies. Because biochemical and microbiological data were from legal medical record data, permission from the Da-nish Patient Safety Authority (rec. no. 3–3013-2019/1) was obtained.
Consent for publication Not applicable.
Competing interests
RBD: Participation in advisory board meeting, Roche Diagnostics 2018 (outside this work). The remaining authors declare that they have no competing interests.
Author details
1Center for Clinical Epidemiology, Odense University Hospital, and Research
Unit of Clinical Epidemiology, Department of Clinical Research, University of Southern Denmark, Kløvervænget 30, Entrance 216, ground floor, 5000 Odense C, Denmark.2OPEN– Odense Patient Data Exploratory Network,
Odense University Hospital, J.B. Winsløws Vej 9 A, 5000 Odense C, Denmark.
3
The Polyvalent Intensive Care Unit, Hospital de São Francisco Xavier, CHLO, Estrada do Forte do Alto do Duque, 1449-005 Lisbon, and NOVA Medical School, CEDOC, New University of Lisbon, Campo dos Mártires da Pátria, 1169-056 Lisbon, Portugal.4Department of Clinical Biochemistry and
Pharmacology, Odense University Hospital, Sdr. Boulevard 29, entrance 40, 5000 Odense C, Denmark.5Department of Infectious Diseases, Odense
University Hospital, J.B. Winsløws Vej 4, 5000 Odense, Denmark.6Department
of Clinical Microbiology, Odense University Hospital, J.B.Winsløws Vej 21, 2nd floor, 5000 Odense C, Denmark.7Department of Clinical Microbiology, Hospital of Southern Jutland, Sydvang 1, 6400 Sønderborg, Denmark.
8Department of Clinical Microbiology, Slagelse Hospital, Ingemannsvej 46,
4200 Slagelse, Denmark.9Department of Clinical Microbiology, Hospital
Lillebaelt, Beriderbakken 4, 7100 Vejle, Denmark.10Department of Clinical Microbiology, Hospital of South West Jutland, Finsensgade 35, 6700 Esbjerg, Denmark.11Department of Regional Health Research, University of Southern
Denmark, 5000 Odense C, Denmark.12Department of Emergency Medicine,
Odense University Hospital, Kløvervænget 25, entrance 63-65, 5000 Odense C, Denmark.13Department of Haematology, Odense University Hospital, and
Research Unit of Haematology, Department of Clinical Research, University of Southern Denmark, Kløvervænget 6, entrance 93, 12th floor, 5000 Odense C, Denmark.
Received: 13 December 2019 Accepted: 13 March 2020
References
1. Estey EH. Acute myeloid leukemia (AML). In: Estey EH, Appelbaum FR, editors. Leukemia and related disorders: integrated treatment approaches, vol. 1. 1st ed. New York: Springer Science+Business Media; 2012. p. 1–36. 2. Short NJ, Rytting ME, Cortes JE. Acute myeloid leukaemia. Lancet. 2018;
392(10147):593–606.
3. Stosor V, Zembower TR. Infectious complications in Cancer patients, vol. 1. 1st ed. Switzerland: Springer; 2014.
4. Vincent JL, Beumier M. Diagnostic and prognostic markers in sepsis. Expert Rev Anti-Infect Ther. 2013;11(3):265–75.
5. Wu CW, Wu JY, Chen CK, Huang SL, Hsu SC, Lee MT, et al. Does procalcitonin, C-reactive protein, or interleukin-6 test have a role in the diagnosis of severe infection in patients with febrile neutropenia? A systematic review and meta-analysis. Support Care Cancer. 2015;23(10):2863–72.
6. Mackie PH, Crockson RA, Stuart J. C-reactive protein for rapid diagnosis of infection in leukaemia. J Clin Pathol. 1979;32(12):1253–6.
7. Rose PE, Johnsdon SA, Meakin M, Mackie PH, Stuart J. Serial study of C-reactive protein during infection in leukaemia. J Clin Pathol. 1981;34(3):263–6. 8. Schofield KP, Voulgari F, Gozzard DI, Leyland MJ, Beeching NJ, Stuart J.
C-reactive protein concentration as a guide to antibiotic therapy in acute leukaemia. J Clin Pathol. 1982;35(8):866–9.
9. Timonen TT, Koistinen P. C-reactive protein for detection and follow-up of bacterial and fungal infections in severely neutropenic patients with acute leukaemia. Eur J Cancer Clin Oncol. 1985;21(5):557–62.
10. Vladimirova SG, Tarasova LN, Sokol'skaia O, Cherepanova VV. C-reactive protein as a marker of the severity of an infectious process in acute myeloid leukemia patients with neutropenia. Ter Arkh. 2013;85(11):34–40.
11. Vincent JL, Dubois MJ, Navickis RJ, Wilkes MM. Hypoalbuminemia in acute illness: is there a rationale for intervention? A meta-analysis of cohort studies and controlled trials. Ann Surg. 2003;237(3):319–34.
12. Levitt DG, Levitt MD. Human serum albumin homeostasis: a new look at the roles of synthesis, catabolism, renal and gastrointestinal excretion, and the clinical value of serum albumin measurements. Int J Gen Med. 2016;9:229–55. 13. Rothschild MA, Oratz M, Schreiber SS. Serum albumin. Hepatology. 1988;
8(2):385–401.
14. Doweiko JP, Nompleggi DJ. The role of albumin in human physiology and pathophysiology, part III: albumin and disease states. JPEN J Parenter Enteral Nutr. 1991;15(4):476–83.
15. Klein S. The myth of serum albumin as a measure of nutritional status. Gastroenterology. 1990;99(6):1845–6.
16. Fuhrman MP. The albumin-nutrition connection: separating myth from fact. Nutrition. 2002;18(2):199–200.
17. Lee JL, Oh ES, Lee RW, Finucane TE. Serum albumin and prealbumin in calorically restricted, nondiseased individuals: a systematic review. Am J Med. 2015;128(9):1023 e1021–2.
18. Soeters PB, Wolfe RR, Shenkin A. Hypoalbuminemia: pathogenesis and clinical significance. JPEN J Parenter Enteral Nutr. 2019;43:181–93. 19. Fleck A, Raines G, Hawker F, Trotter J, Wallace PI, Ledingham IM, et al.
Increased vascular permeability: a major cause of hypoalbuminaemia in disease and injury. Lancet. 1985;1(8432):781–4.
20. McCluskey A, Thomas AN, Bowles BJ, Kishen R. The prognostic value of serial measurements of serum albumin concentration in patients admitted to an intensive care unit. Anaesthesia. 1996;51(8):724–7.
21. Hansson LO, Hedlund JU, Ortqvist AB. Sequential changes of inflammatory and nutritional markers in patients with community-acquired pneumonia. Scand J Clin Lab Invest. 1997;57(2):111–8.
22. Blunt MC, Nicholson JP, Park GR. Serum albumin and colloid osmotic pressure in survivors and nonsurvivors of prolonged critical illness. Anaesthesia. 1998;53(8):755–61.
23. Danielski M, Ikizler TA, McMonagle E, Kane JC, Pupim L, Morrow J, et al. Linkage of hypoalbuminemia, inflammation, and oxidative stress in patients receiving maintenance hemodialysis therapy. Am J Kidney Dis. 2003;42(2):286–94. 24. Kaysen GA, Dubin JA, Muller HG, Rosales L, Levin NW, Mitch WE.
Inflammation and reduced albumin synthesis associated with stable decline in serum albumin in hemodialysis patients. Kidney Int. 2004;65(4):1408–15. 25. de Mutsert R, Grootendorst DC, Indemans F, Boeschoten EW, Krediet RT, Dekker FW.
Association between serum albumin and mortality in dialysis patients is partly explained by inflammation, and not by malnutrition. J Ren Nutr. 2009;19(2):127–35. 26. Zisman DA, Kawut SM, Lederer DJ, Belperio JA, Lynch JP III, Schwarz MI,
et al. Serum albumin concentration and waiting list mortality in idiopathic interstitial pneumonia. Chest. 2009;135(4):929–35.
27. Gradel KO, Vinholt PJ, Magnussen B, Pedersen C, Jensen TG, Kolmos HJ, et al. Hypoalbuminaemia as a marker of trans-capillary leakage in community-acquired bacteraemia patients. Epidemiol Infect. 2018;146(5):648–55. 28. Gradel KO, Póvoa P, Vinholt PJ, Magnussen B, Pedersen C, Jensen TG, et al.
Real-life data patterns of C-reactive protein and albumin level trajectories around bacteraemia. Biomark Med. 2018;12(11):1251–9.
29. Póvoa P. C-reactive protein: a valuable marker of sepsis. Intensive Care Med. 2002;28(3):235–43.
30. Schmidt M, Pedersen L, Sørensen HT. The Danish civil registration system as a tool in epidemiology. Eur J Epidemiol. 2014;29(8):541–9.
31. Østgard LS, Nørgaard JM, Raaschou-Jensen KK, Pedersen RS, Ronnov-Jessen D, Pedersen PT, et al. The Danish National Acute Leukemia Registry. Clin. Epidemiol. 2016;8:553–60. 32. Vardiman JW, Harris NL, Brunning RD. The World Health Organization
(WHO) classification of the myeloid neoplasms. Blood. 2002;100(7):2292–302. 33. Arber DA, Orazi A, Hasserjian R, Thiele J, Borowitz MJ, Le Beau MM, et al.
The 2016 revision to the World Health Organization classification of myeloid neoplasms and acute leukemia. Blood. 2016;127(20):2391–405.
34. Østgård LS, Nørgaard JM, Severinsen MT, Sengelov H, Friis L, Jensen MK, et al. Data quality in the Danish National Acute Leukemia Registry: a hematological data resource. Clin. Epidemiol. 2013;5:335–44. 35. Region of Southern Denmark [https://en.wikipedia.org/wiki/Region_of_
Southern_Denmark(Accessed 3 Apr 2019)].
36. Schmidt M, Schmidt SA, Sandegaard JL, Ehrenstein V, Pedersen L, Sørensen HT. The Danish National Patient Registry: a review of content, data quality, and research potential. Clin Epidemiol. 2015;7:449–90.
37. Christiansen JU, Maruard CD, Nielsen HC. LABKA. A real-time computer system for the clinical laboratory. Scand. J. Clin. Lab. Invest. Suppl. 1989;194:57–61. 38. Møller JK. A microcomputer-assisted bacteriology reporting and information
system. Acta Pathol Microbiol Immunol Scand B. 1984;92(2):119–26. 39. Charlson ME, Pompei P, Ales KL, MacKenzie CR. A new method of classifying
prognostic comorbidity in longitudinal studies: development and validation. J Chronic Dis. 1987;40(5):373–83.
40. Trick WE, Zagorski BM, Tokars JI, Vernon MO, Welbel SF, Wisniewski MF, et al. Computer algorithms to detect bloodstream infections. Emerg Infect Dis. 2004;10(9):1612–20.
41. Team RC. R: a language and environment for statistical computing. In. Vienna: R Foundation for Statistical Computing; 2019.
42. Oken MM, Creech RH, Tormey DC, Horton J, Davis TE, McFadden ET, et al. Toxicity and response criteria of the eastern cooperative oncology group. Am J Clin Oncol. 1982;5(6):649–55.
43. Franch-Arcas G. The meaning of hypoalbuminaemia in clinical practice. Clin Nutr. 2001;20(3):265–9.
44. McMillan DC. The systemic inflammation-based Glasgow prognostic score: a decade of experience in patients with cancer. Cancer Treat Rev. 2013;39(5): 534–40.
45. Xu HJ, Ma Y, Deng F, Ju WB, Sun XY, Wang H. The prognostic value of C-reactive protein/albumin ratio in human malignancies: an updated meta-analysis. Onco Targets Ther. 2017;10:3059–70.
46. Balkwill F, Mantovani A. Inflammation and cancer: back to Virchow? Lancet. 2001;357(9255):539–45.
47. Dvorak HF. Tumors: wounds that do not heal. Similarities between tumor stroma generation and wound healing. NEJM. 1986;315(26):1650–9. 48. Coussens LM, Werb Z. Inflammation and cancer. Nature. 2002;420(6917):
860–7.
49. Mantovani A, Allavena P, Sica A, Balkwill F. Cancer-related inflammation. Nature. 2008;454(7203):436–44.
50. Heikkila K, Ebrahim S, Lawlor DA. A systematic review of the association between circulating concentrations of C reactive protein and cancer. J Epidemiol Community Health. 2007;61(9):824–33.
51. Gray S, Axelsson B. The prevalence of deranged C-reactive protein and albumin in patients with incurable cancer approaching death. PLoS One. 2018;13(3):e0193693.
52. Reid VL, McDonald R, Nwosu AC, Mason SR, Probert C, Ellershaw JE, et al. A systematically structured review of biomarkers of dying in cancer patients in the last months of life; an exploration of the biology of dying. PLoS One. 2017;12(4):e0175123.
53. Gradel KO, Nielsen SL, Pedersen C, Knudsen JD, Østergaard C, Arpi M, et al. Low completeness of Bacteraemia registration in the Danish National Patient Registry. PLoS One. 2015;10(6):e0131682.
Publisher’s Note
Springer Nature remains neutral with regard to jurisdictional claims in published maps and institutional affiliations.