forests
ISSN 1999-4907www.mdpi.com/journal/forests Article
A Social Assessment of Forest Degradation in the
“Cacheu Mangroves Natural Park”, Guinea-Bissau
Margarida Lima de Faria 1,*, Pedro Moura Ferreira 2, Joana B. Melo 1,3 and Maria J. Vasconcelos 1,4
1 Tropical Research Institute (IICT), Rua da Junqueira 86, Lisbon 1300-344, Portugal;
E-Mails: [email protected] (J.B.M.); [email protected] (M.J.V.)
2 Institute of Social Sciences (ICS), Rua Professor Aníbal Bettencourt, Lisbon 1600-189, Portugal;
E-Mail: [email protected]
3 RSET Non-governmental Organization, Rua Fialho de Almeida, n. 14, 2 esq.,
Lisbon 1079-129, Portugal
4 Center for Forestry Studies (CEF, ISA), University of Lisbon, Lisbon 1300-344, Portugal * Author to whom correspondence should be addressed; E-Mail: margaridalf@iict;
Tel.: +351-91-477-6637; Fax: +351-21-363-1460. External Editor: Eric J. Jokela
Received: 17 November 2014; in revised form: 4 December 2014 / Accepted: 13 December 2014 / Published: 19 December 2014
Abstract: The Cacheu Mangroves Natural Park (PNTC) was established in the year 2000
with the objective of protecting the coastal forests of Northern Guinea-Bissau, which have been subject to deforestation and are at risk. Concomitantly, the need to find sustainable financial revenues to support forest conservation motivated the development of projects that explore avoidance of deforestation and forest degradation (REDD+) as a potential income possibility. The 886,150 ha of forest in the PNTC include a mosaic of different villages where communities with different cultural and socio-economic habits reside. In addition to the uncontrolled expansion of subsistence agriculture with the associated shortening of fallow periods, forests may have also been subject to degradation from selective logging, fuel wood collection, and charcoal production. To contribute to a forest degradation baseline forest uses for household fuel consumption (wood and charcoal) were surveyed using questionnaires, interviews and focus groups. The data were collected from a representative sample of circa 200 households within a 2 km buffer of the PNTC. These data are analyzed and the results are discussed according to a scenario of ethnic diversity,
i.e., a diversity of approaches relating to forest conservation. Even though the results indicate that fuel wood is the main (and almost sole) source of energy for cooking, they also show that the average daily fuel consumption per capita (1.21 kg) is well below the sub-Saharan average and that fuel is obtained from downed dead wood or dead trees. Therefore, it is concluded that reported forest degradation in PNTC cannot be attributed to fuel wood consumption by local populations.
Keywords: climate change; forest degradation; participatory rural appraisal; fuel
wood; Guinea-Bissau
1. Introduction
Deforestation and forest degradation account for some 17 percent of global greenhouse gas emissions [1]. Much of the debate about the Reduced Emissions from Deforestation and forest Degradation plus (REDD+) agreements has focused on the effects of deforestation. Under the Bali Action Plan [2] the United Nations Framework Convention on Climate Change (UNFCCC) agreed to broaden the original concept of Reduced Emissions from Deforestation (RED) to cover “policy approaches and positive incentives on issues relating to reducing emissions from deforestation and forest degradation in developing countries; and the role of conservation, sustainable management of forests and enhancement of forest carbon stocks in developing countries”. This broadening of the concept of RED—converted into REDD+—recognizes that forests are more than stocks of carbon and that the mechanism should be concerned not just with reducing the climate change effects, but also with creating socio-economic structures for the sustainable management of forests.
The data and results presented below are derived from work developed in two projects sponsored by the European Union (EU) (Gestão Sustentável dos Recursos Florestais no Parque Natural dos Tarrafes de Cacheu) and by the World Bank (Wetland Carbon Market Development for Funding Coastal Communities’ Adaptation to Climate Change in Sub-Saharan Africa), in partnership with the Institute for Biodiversity and Protected Areas (IBAP). The developed activities fall into the category of REDD+ projects referred to as: “activities in defined forest areas involving local communities and national or foreign non-governmental organizations, private companies and/or other types of intermediary, undertaken as part of voluntary carbon markets or in anticipation of the entry into force of regulatory cap-and-trade regimes in developed countries.” [3]. The work presented in this chapter corresponds, to the first steps required for the definition of a forest degradation baseline in the PNTC and is a complementary development to the deforestation baseline established for 2010 [4,5]. The latter provided estimates of the carbon stocks contained in the forests and of the CO2 emissions resulting from
the observed historical deforestation rates and contributes to the establishment of a deforestation baseline in the PNTC. However, and even though there are reports and field evidence of forest degradation spots in the protected area [6–8], there is not sufficient information available about the impact of fuel wood usage, its contribution to forest degradation and carbon stock removal in the park. Additionally, although remote sensing techniques play an important role in monitoring the change of tropical forests the ecological dimension of the problem can be better understood if a strong social dimension is included
in the analysis [9] and integrated into the theory and practice of conservation planning [10]. Using tools and techniques from social research, we summarize the main results of an assessment of the fuel wood collection and charcoal production of the communities living in the PNTC. This assessment will ultimately assist IBAP in the identification of the main forest degradation drivers and will contribute to a better understanding of the effects of conservation actions on forest sustainability.
Study Area: The PNTC
Guinea-Bissau occupies a territory of 36,125 km2 with a population of around 1.6 million [11]. The
economy is based primarily on farming and fishing activities, which represent about 46% of gross domestic product (GDP). Agriculture generates 80% of employment and 90% of exports (primarily through cashew nuts, the main export). The country has poor infrastructure and weak social indicators, and more than two-thirds of the population lives under the poverty line.” [12]. Life expectancy at birth (years) is 48.1 (data of 2011). It is, thus, one of the ten poorest countries in the world, with roughly 75 percent of the population living in rural areas directly depending on natural resources for their living. Forests cover 73.7% of total land area [13]. However, increasingly unsustainable land clearing for shifting cultivation, illegal logging activities, expansion of cashew plantations, and mining have been described as relevant deforestation and forest degradation factors in the country (MDRA, 2006; SEAT, 2014). Additionally, according to national statistics [14], around 80%) of Guinea-Bissau’s population relies on fuel wood for domestic energy needs, placing an extra burden on forest resources. A similar result was observed for Mali, a country in which biomass accounts for 78% of energy use [15]. In the early 2000s, five natural parks and protected areas, covering a total area of around 5000 km2, were
created in Guinea-Bissau, including the PNTC, which was established in 2000 (Decree 12/2000). The PNTC management is currently under the authority of a council, the Board of Park Management, composed of park leaders, local representatives, State and government representatives from the Institute for Biodiversity and Protected Areas (IBAP, created in 2004 as the national unit responsible for managing the protected areas network), as well as other stakeholders working in the field (NGOs, associations, etc.).
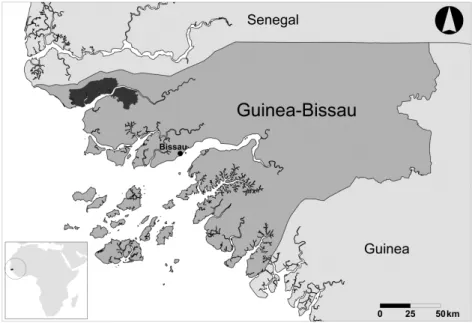
The PNTC is located at the extreme northwest of Guinea-Bissau in the Administrative Region of Cacheu (including the administrative sectors Cacheu and S. Domingos) at 12°10′ and 12°25′ latitude north and 15°55′ and 16°32′ longitude west (Figure 1). It is bordered: to the north by the road Suzana/S. Domingos, to the east by the Antoninho and Djopa rivers, to the south by the river Cabói, and to the west by the rivers Bolor and Defenamen.
Figure 1. The study area, the Tarrafes-de-Cacheu Natural Park in Guinea-Bissau, is shown
in dark grey close to the shoreline in Northern Guinea-Bissau.
The Park was created for the protection of the mangroves prevalent in the northern part of Guinea-Bissau, and which are particularly abundant and well developed around the Cacheu River estuary.
The other predominant vegetation types in this region are open forests and palm groves. The protected area corresponds to a total of 74,700 ha, of which approximately 55,000 ha are forests, and 35,467 ha are mangrove [5]. The PNTC is composed of three major areas (Decree 12/2000): a Preservation Area (covering 57% of the surface of the park); a Tampon Area (28%); and a Sustainable Development Area (for local activities) (15%). It encompasses 31 villages/tabancas [16]. The NPTC has 192,508 inhabitants2 (2009 population census) [17] and it is ethnically diverse. According to
INPE/INEC data, Felupe is the dominant ethnic group with 9003 inhabitants (32.1%) closely followed by the Manjaco, with 7830 inhabitants (27.9%). The third ethnic group is the Balanta with 5915 inhabitants (21.1%). More than 62.7% are animist [14].
2. Data and Methods
Two principles of project design formed the basis of the approach. The project set out to apply Participatory Research methodologies (Participatory Rural Appraisal—PRA) by involving local agents in a process of information gathering and by providing them with the tools to proceed with their own research [18]. In addition, the study design aimed at anchoring the project’s main planning structure in a holistic framework—Sustainable Livelihoods Framework (SLF)—to develop a realistic view of PNTC peoples’ livelihoods and of how they can be improved [19]. SLF draws on the main factors that affect poor people’s livelihoods and the typical relationships between these factors. It can be used for the planning of new development activities and for assessing the contribution that existing activities have made to sustaining livelihoods.
Quantitative methodologies were applied to measure the wood burned daily per household for cooking purposes. Qualitative methodologies, based on semi-structured interviews with community
leaders and on focus groups with local community members, helped determine how a combination of livelihood assets (cultural, social, financial, physical, natural) affects local people’s daily lives and economic strategies, while taking into account their specific contexts of vulnerability and sustainability perspectives. Ten focus groups were created in 10 of the 14 villages surveyed, each focus group being composed of six to 10 persons (men and women, adults). The focus groups’ discussions followed a defined checklist. For a detailed overview of the socio-economic and cultural situation of the local communities living in the PNTC, 10 semi-structured interviews with village leaders were conducted in most of the villages. The qualitative data collection methodologies allowed the livelihood strategies of similar households in each village/region to be understood. The variables used to describe the overall socio-economic profile were: ethnicity; value assigned to the forest; power structure; traditional vs. post-colonial order; local economic resources, land tenure; land uses/markets; risks and vulnerabilities and individual well-being/perspective for the future.
2.1. Sample Design and Data Collection Protocols
The main goal of the study was the quantification of fuel wood consumption for domestic use. Questionnaires were applied to a representative sample (described below) of the PNTC population. The target population was that residing within the limits of the Park and within its buffer area (a 2 km outer ring lying outside the Park limits). There are three fundamental reasons for including the population living in the buffer area of the Park: (I) its shared uses of the PNTC forest resources; (II) its participation in actions promoted by the Park—as their economic and forestry activities have a major impact on the preservation/degradation of its resources; (III) while not formally belonging to the Park, the inhabitants of this area benefit from PNTC activities and are subject to its rules.
According to the only detailed study available on PNTC population [18], covering the NPTC and buffer area population, the target population, including that living in the buffer area was composed of 31 148 individuals. Taking this census data into account, two factors were defined in the data collection protocols for sample definition:
• The geographical region that includes villages located within and outside the PNTC boundaries
under three administrative divisions—Cacheu, S. Domingos and Bigene;
• The village size according to four categories: 150 or less inhabitants; 151–300 inhabitants;
301–600 inhabitants; larger than 600 inhabitants.
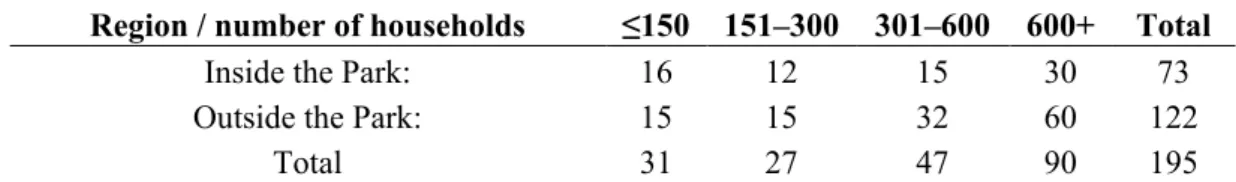
Predicting an average of eight persons per household (fogão), 3894 households were considered according to the villages’ size and geographical region. It should be clarified that the household in this study does not necessarily coincide with a single housing unit. In Guinea-Bissau the household is defined as fogão (the “stove”), i.e., people who share the same meals. Thus, the term fogão, “stove”, is more frequently used than “household”. Additionally, the same housing unit (called “morança”) may integrate more than one fogão and it is also possible that people eating from the same fogão do not live under the same roof. Thus, more than the “house” or “dwelling”, it is the “stove” that should be understood as the term that best resembles the “household” unit. Taking into account all 3894 households and relying on the available data, the final sample size covered 5% of the households, the equivalent of 195 households. The households sample was then stratified according to village size and
geographical region (Table 1). Based on this stratification, 14 villages were randomly selected to include the target 195 households.
Table 1. Distribution of households in the sample according to size and geographical region.
Region / number of households ≤150 151–300 301–600 600+ Total
Inside the Park: 16 12 15 30 73 Outside the Park: 15 15 32 60 122
Total 31 27 47 90 195
The number of questionnaires actually applied and the characterization of the respective households shows a slight deviation from the initial design shown in Table 1. Some of the initially selected villages could not be reached due to non-accessibility, and thus, to overcome this problem, the questionnaires were applied in adjacent strata. According to the inside/outside criteria the actually applied questionnaires are almost evenly distributed (105 inside vs. 109 outside); while in the case of the village dimension criterion there is a smaller number of interviews in small and medium size villages (103), which was compensated by applying a higher number of questionnaires in larger villages (111). Therefore, the final number of households surveyed (214) exceeded the expected number.
2.2. Data Collection
In each village, the households were randomly selected and a questionnaire was put to the head of the household (normally an older woman) or to someone that might replace her. The firewood used for cooking (per day) was also weighted (Figure 2).
Figure 2. (a) and (b) weighting the wood collected for one day.
The survey carried out in these villages allowed for the compilation of information in accordance with the main topics:
(1) Fuel wood and charcoal consumption: Total amount of fuel wood used daily and average daily consumption per capita; identification of the wood species used for burning and of the wood condition at time of collection (dead vs. live trees); cooking practices (types of stoves found in the household) and according to ethnic differences (affecting the use of wood or charcoal for cooking). The quantification of the daily consumption of the fuel wood, per household, (for cooking) was done in three steps: (I) the amount of wood to be burned in the household during one day was first assembled by the interviewee; (II) the wood was classified by species and size class and; (III) then weighed by the interviewers (total weight and weight per tree species). (2) Forest degradation pressure: Forest penetration distances from the village were considered as a
measure of fuel wood accessibility. The interviewees were asked to indicate the distances travelled daily to collect fuel wood taking their respective homes as a reference. The frequency of collection practices was also registered.
(3) Community awareness of Park regulations as a measure of forest sustainability: The inhabitants’ awareness of living inside or outside the PNTC boundaries and their knowledge of the PNTC rules were assessed by means of the questionnaires and using PRA approaches (focus groups and interviews).
(4) Forest use by immigrants: The proportion of immigrants (internal vs. foreign), their land tenure, forest uses (wood collection condition) and relation with the PNTC rules were determined.
3. Results and Discussion
3.1. Fuel Wood and Charcoal Consumption
The number of persons served by each of the “fogões” (corresponding to each household) averages 10 individuals (a number slightly above the one estimated and in the sample design). However, the most common size is between five and nine individuals (50% of “fogões”). Based on the almost 200 measurements following the sampling design described above, it was found that the average daily consumption of fuel wood per capita is 1.21 kg. This can be considered a rather small amount of wood and is consistent with the region’s poverty profile. A recent study on household energy use from nearly 3000 households across 10 villages of Sub-Saharan Africa [20] refers to an average of 2.2 kg of wood per capita per day. In the focus groups discussions the villagers stated that the amount of wood collected was similar throughout the year, with a difference only in the amount collected in each travel, i.e. in the wet season the wood is collected more seldom and in bigger quantities and stored under shelters). Other studies have demonstrated that income is an important factor in terms of the levels of fuel wood use. Although there are great variations between countries, consumption of both fuelwood and charcoal usually decrease with an increase in income [21] as consumers switch to higher-quality fuels, such as kerosene gas. However, the opposite has also been observed, i.e., that fuel wood consumption may increase with rising incomes given that people tend to cook more [22].This seems to be the case of the survey described above, as compared to the NPTC results presented here. Fuel wood is collected by women on foot. Only 30.4% of the households referred the use of charcoal combined
with fuel wood (i.e., when using an iron craft charcoal grill—fogareiro). However, slight differences may occur when taking into account the village size and geographical position within the PNTC. It is important to note that the discrepancies found among different villages within the same stratum are considerable, which may be a consequence of the reduced number of enquiries per village. In order to reduce these discrepancies in the quantification of fuel wood consumption, the data referring to smaller size villages within the same stratum were aggregated, resulting in greater homogeneity.
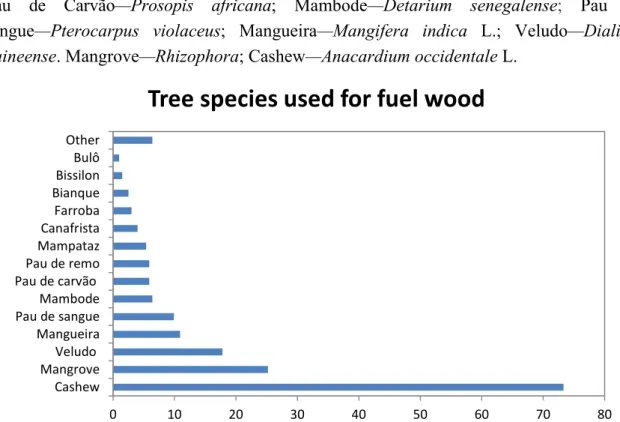
As shown in Figure 3, when asked about the type of trees used for fuel, 73.3% of respondents indicated cashew trees (Anacardium occidentale) due to their availability. They can be found almost everywhere since cashew nuts have become the principal basis of the Guinea-Bissau economy.
Mangrove species, which consist of mainly three different tree species (Rhizophora racemosa, Avicennia africana and Laguncularia racemosa), come second after cashew stands and are referenced by a quarter of respondents, although the weight of mangrove branches consumed was comparatively low (25%) as compared to cashew (73%) as mangrove wood usage is limited to the vicinities of sea arms while cashew consumption is quite widespread in the NPTC. This preference for mangrove species has a source of fuel wood was also observed in similar studies using a combination of interviews and questionnaires and satellite imagery analysis, [23,24]. The latter study [24] showed an inferior use of mangrove (14.2%) than the percentage usage reported here for PNTC (~25%).
Three other species are also significantly referenced (veludo: Dialium guineense 17.8%, mangueira: Mangifera indica L. 10.9%, and pau-de-sangue: Pterocarpus violaceus 9.9%). None of the other species identified reached 7%.
Figure 3. Tree species used for fuel wood: Bulô—Setara pumila; Bissilon—Khaya senegalensis; Bianque—Alstonia boonei; Farroba—Albizzia gummifera;
Canafistra-Peltophorum dubium; Mampataz—Parinari excelsa; Pau de remo—Sapotaceae; Pau de Carvão—Prosopis africana; Mambode—Detarium senegalense; Pau de sangue—Pterocarpus violaceus; Mangueira—Mangifera indica L.; Veludo—Dialium guineense. Mangrove—Rhizophora; Cashew—Anacardium occidentale L.
0 10 20 30 40 50 60 70 80
Cashew MangroveVeludo Mangueira Pau de sangueMambode Pau de carvãoPau de remo MampatazCanafrista Farroba BianqueBissilon Bulô Other
The vast majority of households mostly use fuel wood for cooking (97.2%). This typical use of wood for domestic fuelwood consumption has been reported in many worldwide study areas [25,26]. However, in the PNTC, various different factors affect the amount of wood consumed. For example, the alternative use of wood or charcoal, or a combination of both, or the type of stove available can greatly influence consumption. The vast majority of households use the “three stones” traditional stove but there are also cases where “improved stoves” and the “iron cast charcoal grills” are employed, implying different levels of fuel consumption.
The combination of fuel wood with charcoal in cooking practices slightly reduces fuel wood consumption. If we take per capita consumption of fuel wood, the difference between charcoal consumers and non-consumers is less than 0.2 kg. The average of fuel wood consumption in the former group is 1.051 kg (charcoal consumers) and in the later 1.225 kg (non-charcoal consumers). The reason for this small difference (yet statistically relevant (t(210) = 1.847, p < 0,05), derives mainly from charcoal not having a key role in cooking practices since it is usually used in addition to fuel wood and, in most cases, only occasionally.
The majority of respondents (93.8%) indicated that fuel wood is collected from the ground (Table 2) or from standing dead trees. This high percentage, supported by participant observation, allows for the assumption that fuel wood consumption in the PNTC follows the sustainable management practices and conservation regulations supervised by IBAP, and therefore the biomass and carbon stocks of the PNTC forests are very likely not decreasing due to this activity. This result is consistent with the findings reported by [5], where remotely sensed data showed that there had been a net increase in mangrove vegetation cover in the PNTC.
Table 2. Fuel wood condition.
Source of fuel wood % N
Total 100 214 Dead tree/collected from the ground 93.8 196 Live tree 5.6 2
Both 0.5 1
Maintenance of stand productivity and nut quality, as well as the compliance with international cashew nut marketing standards, induce seasonal pruning of cashew trees. The wood resulting from these pruning practices and that obtained from the remains of clearings for upland rice plantation (in a shifting cultivation model) generate important quantities of fuel wood easily accessible to rural populations. The use of charcoal is more prevalent in larger villages (over 600 inhabitants) than in smaller or medium-sized ones. These villages, especially the larger ones, located near urban areas, such as S. Domingos, show a higher population density. Their households, located further from forest resources, show a higher propensity for buying charcoal. The greater purchasing power of urban areas also contributes to a higher consumption of charcoal. Due to the positive association between charcoal consumption and household size, regions with larger households show higher levels of charcoal consumption. The two regions with the highest consumption of charcoal are the southern region outside the park (PNTC buffer area) (37.9%) and the northern region inside the PNTC (37.8%)
and—which coincide with the two major population centers: S. Domingos in the north; and Cacheu in the south.
Ethnicity also affects charcoal consumption (Table 3). There seems to be a predisposition for a more intensive use of charcoal by the Fula (88.9%) and the Balanta (52.9%). Other ethnic groups show a less marked association with charcoal consumption. Fieldwork observations confirmed distinct cultural traditions with regard to food habits that may explain the differences in charcoal domestic uses.
Table 3. Fuel wood and charcoal consumption/production per ethnic group/nationality. Ethnic group/nationality Sample Size (%) Consumption Fuel Wood Consumption Charcoal Production Charcoal
Average (Kg) % % Total 1.21 30.7 14.2 Balanta 8.4 1.26 52.9 22.2 Boiote 1.9 1.32 0.0 0.0 Capeverdian 0.5 0.69 100.0 0.0 Djola 3.3 1.48 0.0 0.0 Felupe 36.9 1.31 24.1 11.5 Fula 4.2 0.65 88.9 55.6 Gambiam 0.5 0.62 0.0 0.0 Mancanha 1.9 1.04 75.0 0.0 Mandinga 2.3 0.61 60.0 20.0 Manjaco 34.6 1.15 20.5 15.3 Nalu 0.5 1.00 100.0 0.0 Nhominca 0.5 0.00 100.0 0.0 Papel 4.2 1.67 44.4 0.0 Senelagese 0.5 1.45 100.0 0.0
As for charcoal production, the data collected show that only 14.2% of households produce charcoal . The existing production is typically done in a domestic manner and there is no evidence of any industrial processing in the regions surveyed. As shown in Table 3 some ethnic groups are traditional charcoal producers. According to information reported in focus groups discussions, charcoal is either exchanged or sold to neighbors within the same villages or to neighboring villages. It is also sold in local markets in small quantities.
Charcoal is produced from a limited set of tree species. The most commonly referred are pau de carvão (Prosopis african) 51.2%, pau de sangue (Pterocarpus violaceu), 22%, and cashew (Anacardium occidentale), 15%. Other tree species such as bissilon (Khaya senegalensis) and pau de incenso 4.9%, followed by pau de conta (Swietenia mahegoni) and pau mangueira (Mangífera indica) 2.4% were seldom referred. The selection of trees for charcoal production does not seem to depend on their availability, but also of the intrinsic value (density) of the wood.
Although mangrove species have a high wood density and other properties that make it attractive for charcoal production [27–29], in the PNTC villages surveyed they were not among the tree species used to make charcoal. This may be due to the PNTC rules (Decree 12/2000 article 9that forbid “cutting or harvesting of any botanical species of shrub or tree size, particularly the mangrove in non-agricultural areas”.
3.2. Forest Penetration: Accessibility and Distance
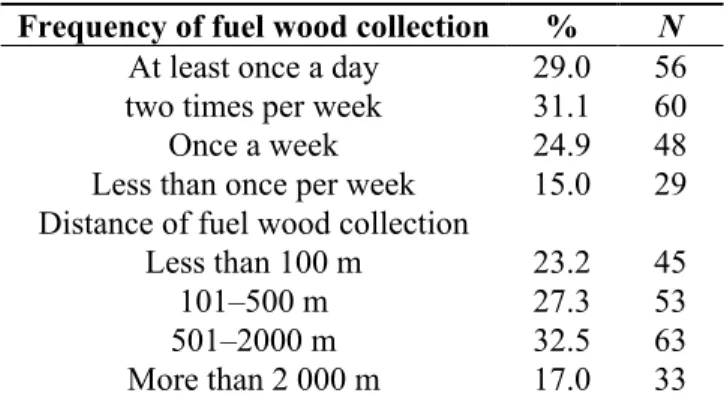
The estimate of the depth of penetration in order to get a measure of degradation pressure was defined by means of the distance travelled to collect fuel wood and the frequency of collection activities. One-third of the population collects fuel wood daily and half the population collects it at least once a week (Table 4). Only 15% do so less frequently, which is probably related to its availability from cashew pruning activities or land clearing for upland rice plantations. These two activities occur only once a year and last for a few weeks; the period during which wood is collected and stored for long term use.
The prevailing high frequency of fuel wood collection indicates that this is not done far from the households. Indeed, a quarter of the population picks up fuel wood close to the village; another quarter has to walk as far as 500 m and only about 30% travels a distance of 2 km. Therefore, 83% of households collect fuel wood within 2 km and only 17% go further.
Table 4. Frequency and distance of fuel wood collection.
Frequency of fuel wood collection % N
At least once a day 29.0 56 two times per week 31.1 60 Once a week 24.9 48 Less than once per week 15.0 29 Distance of fuel wood collection
Less than 100 m 23.2 45 101–500 m 27.3 53 501–2000 m 32.5 63 More than 2 000 m 17.0 33
These relatively short distances indicate that the PNTC may be characterized by high fuel wood availability, since most villages are surrounded by cashew plantations and mangroves (northern region). They also suggest that these sources of fuel wood are sustainable; otherwise their depletion would have caused deforestation around the villages, forcing villagers to walk greater distances. This also explains why the distance traveled to collect fuel wood is short, or relatively short, for most of the PNTC population and, therefore, forest penetration pressure remains relatively low. The predominance of cashew plantations and mangrove areas in the PNTC forest landscape contributes to the sustainability of this specific source of energy used for household consumption.
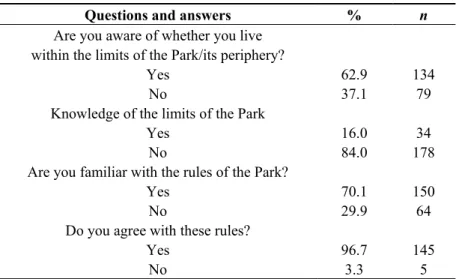
3.3. Communities’ Awareness of the Park Regulations
When assessing forest degradation, within the limits of a protected area, such as the PNTC, it was considered important to interview the communities living inside and surrounding the project area, to determine whether they are aware of living within or near the Park limits, and whether they are familiar with the Park rules, in order to determine the potential for illegal extraction.
A consistent importance was given by interviewees to preventing forest degradation, whether or not it is actually translated into practice. This awareness is noticeable in the people’s understanding of the Park (Table 5). The greater portion of interviewees (62.9%) was aware of whether or not they resided inside the Park or in its surrounding area. On the other hand, only a minority (16%) claimed to know,
with some precision, the location of the borders of the Park. This is to say, most are unaware of the PNTC’s geographical limits. Despite this fact, seven out of 10 respondents are familiar with the Park’s regulations. They offer examples such as restrictions in the cutting of the mangrove trees, rules against the use of certain kinds of fishing nets or the interdiction of burning. Virtually all participants who are familiar with these regulations stated that they agree with them. Only five out of all interviewees revealed their opposition to these rules, affirming that they believe these regulations interfere with their activities. The interviewees’ widespread acceptance of the Park’s regulations is directly connected to the preservation and sustainability of natural resources. This relationship is well documented in some of the topics discussed in the focus groups sessions that were held during the research:
• The focus group participants agree in recognizing the NPTC advantages. Yet, they claim more
organization with regard to the relation between the villagers and the Park so that they can make better use of the Park resources. Focus group in Banhinda: 10 Feburary 2013.
• The focus group participants are acquainted with the NPTC rules since they were implemented in 2000. They identify some advantages in NPTC rules, they used to fish faraway but now they fish closer to their village (there are no more fishermen invading their fishing areas). They have an improved well and a rice husking machine. They also see advantages in what they call “the change of mentalities”. Focus group in Bufá: 18 Feburary 2013.
• The focus group participants give high priority to following the Park’s rules. If the mangrove is
not protected, there will be no fish and there will be more erosion of the bolanha. Focus group in Djeden: 20 Feburary 2013.
NPTC villagers use cashew branches for fuel wood, collected from the ground or during cashew pruning. They depend economically on cashew nuts production so they have a high sense of these particular trees’ preservation. The same with mangrove, their description of the importance of the mangrove ecosystem for their own survival, became apparent during focus groups’ discussions. It is likely that this “environmental” awareness influences people’s conduct in the forest. The fact that the vast majority of fuel wood collected is dead or renewable wood shows that there is—at any rate in terms of domestic fuel wood usage—a strong correlation between preservation practices and environmental consciousness.
Table 5. Relation between the population and the PNTC.
Questions and answers % n
Are you aware of whether you live within the limits of the Park/its periphery?
Yes 62.9 134
No 37.1 79
Knowledge of the limits of the Park
Yes 16.0 34
No 84.0 178
Are you familiar with the rules of the Park?
Yes 70.1 150
No 29.9 64
Do you agree with these rules?
Yes 96.7 145
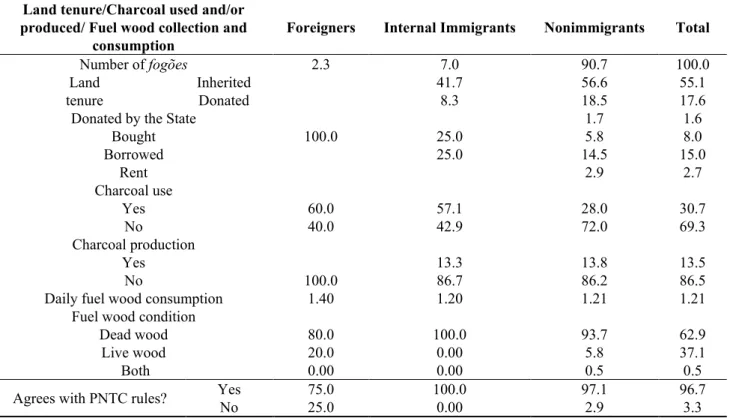
3.4. Immigrants’ Forest Uses
For the purpose of this study, the immigrant population was defined as “people living in the village for less than five years”. Immigrants can be considered to be the main agents of frontier forest degradation, therefore in this study the proportion of immigrant populations and their geographical origin (internal or foreign) was determined. The survey also sought to calculate the proportion of immigrants (and of internal immigrants vs. foreigners) and their forest uses (fuel wood and if collected dead or live vs. charcoal); also their relation with the PNTC rules.
Our data show that approximately one out of 10 interviewees (9.3%) has lived for less than five years in the village. However, only five of these immigrants came from foreign countries (2.3%). This data was reinforced by evidence from participant observation. The main reason for foreign immigration is the Casamance conflict. The Casamance region is a southern region of Senegal which, although connected in the east to Senegal, is separated from the rest of Senegal by the Gambia. The Casamance Conflict is a civil war that has been waged between the Senegal government and a rebel movement, i.e., the Movement of Democratic Forces of Casamance (MFDC), fighting for independence since 1982. The internal immigrants came either in search of security or better living conditions.
The question addressed here is if the behavior of these immigrants concerning the use of forest resources is different from the rest of the population. To evaluate the possible differences, the following indicators were selected: access to land property, fuel wood consumption, use and production of charcoal and agreement and compliance with the PNTC rules (Table 6). Since we were dealing with a small group of immigrants, the results are purely exploratory and should therefore be interpreted with caution.
Table 6. Immigrants vs. nonimmigrants and land use. Land tenure/Charcoal used and/or
produced/ Fuel wood collection and
consumption Foreigners Internal Immigrants Nonimmigrants Total
Number of fogões 2.3 7.0 90.7 100.0
Land Inherited 41.7 56.6 55.1
tenure Donated 8.3 18.5 17.6
Donated by the State 1.7 1.6
Bought 100.0 25.0 5.8 8.0 Borrowed 25.0 14.5 15.0 Rent 2.9 2.7 Charcoal use Yes 60.0 57.1 28.0 30.7 No 40.0 42.9 72.0 69.3 Charcoal production Yes 13.3 13.8 13.5 No 100.0 86.7 86.2 86.5
Daily fuel wood consumption 1.40 1.20 1.21 1.21 Fuel wood condition
Dead wood 80.0 100.0 93.7 62.9
Live wood 20.0 0.00 5.8 37.1
Both 0.00 0.00 0.5 0.5
Internal immigrants display a behavior similar to the nonimmigrant population yet different from foreigners. Indeed, foreigners generally do not inherit land; they tend to have access to land through purchase, whilst the other two groups tend to have immediate access to land through heritage or donation. According to the survey results, foreigners as compared to internal immigrants consume greater quantities of fuel wood; they use more charcoal; they tend to collect live wood for cooking; they do not produce charcoal and more frequently express their disagreement with most of the Park rules.
Since immigrants make less use of land, as a source of income, they have a more limited access to cashew plantations. Without access (or with less access) to these renewable sources of energy, a more intensive use of natural forest may be expected. This higher pressure is consistent with their greater harvesting of live wood for fuel wood and their relative noncompliance with the PNTC rules (in what concerns forest conservation). The importance of the forests sustainability as related to the sustainability of local people livelihood was broadly discussed, in focus groups interviews. Through these interviews it became apparent the degree to which local villagers recognized the importance of forest preservation for their own ways of living sustainability. Not just their agreement with the Park rules but their knowledge of the Park rules was quantitatively determined; there was quantitative evidence of the different behaviours displayed by immigrants versus native people. Although the data collected show different practices displayed by the foreign population both in comparison to internal immigrants and to the non-immigrants, given that foreigners are a small minority (2.3%) they cannot be expected to cause significant damage to forest resources, especially because no evidence was found of an association between this specific group of immigrants and charcoal production within the park boundaries.
4. Conclusions
The PNTC inhabitants main source of energy for cooking is fuel wood. However, as shown by the data collected and analyzed in this study, the average fuel consumption per capita is well below the sub-Saharan average and fuel is mostly obtained from downed dead wood or dead trees. These observations, together with the evidence of low degradation pressure as defined by distance traveled and frequency of collection activities, lead to the conclusion that the reported forest degradation in PNTC cannot be attributed to fuel wood consumption.
One important finding of this study is that most of the fuel wood originates from either the remains of seasonal pruning activities in cashew plantations or dead/burned wood in mangrove stands and forest clearings. The use of live trees for fuel is comparatively very low and is mostly confined to foreigner immigrant communities living in, or in the vicinity, of PNTC. Despite their non-compliance with the PNTC rules and comparatively higher fuel consumption, there was no evidence of any association between foreign immigrants and charcoal production.
Far from being homogenous and stable, due to ethnic diversity and high economic and social vulnerability, the livelihoods of the PNTC populations seem to be relatively in tune with the PNTC structure. The populations surveyed displayed a generalized environmental awareness, while using the forest resources mostly for self-subsistence. They seem to be aware that they are the main drivers of forest degradation; they also seem to know that they are the main Park beneficiaries.
Considering all that has been described above, the PNTC forests may be considered as sustainable as far as degradation practices are concerned. Furthermore, this assessment successfully demonstrates how social research can assist in understanding the impact of IBAP’s conservation actions, namely its capacity to engage the communities living in the PNTC. Together with remote sensing techniques, ecology, and carbon accounting, social methods are fundamental to assess and monitor the impact of forest related activities and initiatives in the park, namely those to be implemented by the Community Based Avoided Deforestation Project currently under validation to ensure compliance with Verified Carbon Standard requirements.
Acknowledgments
The work presented in this paper was made possible with funding and data from two sources: (1) the Community Based Avoided Deforestation Project preparation, funded by the Wetland Carbon Market Development for Funding Coastal Communities’ Adaptation to Climate Change in Sub-Saharan Africa (World Bank); and (2) the “Gestão Sustentável dos Recursos Florestais no Parque Natural dos Tarrafes de Cacheu” project (EuropeAid/128320/C/ACT/Multi), through a grant allocated by DEVCO to the Portuguese non-governmental Organization MONTE, ACE, and a subcontract to the Portuguese non-governmental Organization RSET. The authors gratefully acknowledge the support and hospitality of the populations residing in the PNTC area and of IBAP; its director Alfredo Simão da Silva; the Director of the PNTC, Fernando Biag; and IBAP’s park rangers and associated personnel.
Author Contributions
MJV and JBM identified the need and the opportunity and facilitated the development of the work. MLF, PMF and JBM carried out the field work and collected the data. MLF and PMF did the sample design, designed all tools (e.g., datasheets, questionnaires), analyzed all data and commented on data analysis. MLF, PMF, JBM and MJV conceived and designed the study, and wrote the manuscript.
Conflicts of Interest
The authors declare no conflict of interest.
References and Notes
1. Cotula, L.; Mayers, J. Tenure in REDD—Start-Point or Afterthought? Natural Resource Issues 15; International Institute for Environment and Development: London, UK, 2009.
2. UNFCCC. Report of the Conference of the Parties on its thirteenth session, Part Two: Action taken by the Conference of the Parties at its thirteenth session. In Proceedings of the Bali Climate Change Conference, Bali, Indonesia, 3–15 December 2007. Available on line: http://unfccc.int/ resource/docs/2007/cop13/eng/06a01.pdf (accessed on 13 January 2014)
3. UN 2003. UN—Economic and Social Council—Permanent Forum on Indigenous Issues Twelfth S Session New York, 20–31 May 2013; p. 5.
4. Assessment of REDD Baseline Scenarios in Guinea Bissau Final Report; Winrock International: Washington, DC, USA, 2011.
5. Vasconcelos, M.J.P.; Cabral, A.I.R.; Melo, J.B.; Pearson, T.R.H.; Pereira, H.; Yundelman, T.; Cassamá, V.; Yudelman, T. Can Blue Carbon Contribute for Clean Development in West-Africa? The Case of Guinea-Bissau. Mitig. Adapt. Strateg. Global Chang. 2014, doi: 10.1007/s11027-014-9551-x.
6. IBAP. Estratégia Nacional para as Áreas Protegidas e a Conservação da Biodiversidade na Guiné-Bissau 2007–2011; Institute of Biodiversity and Protected Areas: Bissau, Guinea-Bissau, 2007.
7. SEAT. Guinea-Bissau National Report for Rio+2; Secretary of State for the Environment and Tourism: Bissau, Republic of Guinea-Bissau, 2012.
8. SEAT. Fifth National Report to the Convention on Biological Diversity; Secretary of State for the Environment and Tourism: Bissau, Republic of Guinea-Bissau, 2014.
9. Danielsen, F.; Skutsch, M.; Burgess, N.D.; Jensen, P.M.; Andrianandrasana, H.; Karky, B.; Lewis, R.; Lovett, J.C.; Massao, J.; Ngaga, Y. At the heart of REDD: A role for local people in monitoring forests? Conserv. Lett. 2011, 4, 158–167.
10. Raymond, C.M.; Knight, A.T. Applying social research techniques to improve the effectiveness of conservation planning. Bioscience 2013, 63, 320–321.
11. World Bank. Guinea-Bissau profile. 2012. Available online: http://www.worldbank.org/en/country/ guineabissau (accessed on 13 January 2014).
12. World Bank. Guinea-Bissau Overview. 2012. Available online: http://www.worldbank.org/en/ country/guineabissau/overview (accessed on 13 January 2014)
13. Mongabay. Tropical Rainforests: Deforestation rates tables and charts. Deforestation data for Guinea-Bissau, 1990–2005. Guinea-Bissau’s data is derived from the FAO. Available online: http://rainforests.mongabay.com/deforestation/guinea-bissau.html (accessed on 20 January 2014). 14. Rodrigues, D.; Mendes da Costa, C. Recenseamento e Estudo Socio-Económico e Ambiental das
Zonas Protegidas e Limítrofes; INEP: Bissau, Guinea-Bissau, 2007.
15. Johnson, N.; Bryden, K. Energy supply and use in a rural West African village. Energy 2012, 43, 283–292.
16. SEAT. National Biodiversity Strategy and Action Plan; Secretary of State for the Environment and Tourism: Bissau, Republic of Guinea-Bissau, 2006.
17. INEC. Arquivo de Dados do Instituto Nacional de Estatística da Guiné-Bissau . Available online. http://www.stat-guinebissau.com/nada41/index.php/catalog/10 (accessed on 2 December 2014). 18. Chambers, R. Sharing and co-generating knowledges: Reflections on experiences with PRA and
CLTS. IDS Bull. 2012, 43, 71–87.
19. Carney, D. Sustainable Livelihoods Approaches: Progress and Possibilities of Change; DFID: Toronto, Canada, 2003.
20. Adkins, E.; Oppelstrup, K.; Modi, V. Rural household energy consumption in the millennium villages in Sub-Saharan Africa. Energy Sustain. Dev. 2012, 16, 249–259.
21. Arnold, M.; Kolin, G.; Person, R.; Shepherd, G. Fuel Wood Revisited: What Has Changed in the Last Decade? CIFOR Occasional Paper No. 39; Centre for International Forestry Research: Bogor, Indonesia, 2003.
22. Woodwell, J. Fuelwood and Land Use in West Africa: Understanding the Past to Prepare for the Future; International Resources Group: Washington, DC, USA, 2002.
23. Hernández Cornejo, R.; Koedam, N.A.; Ruiz L.; Troell M.; Dahdouh-Guebas, F. Remote sensing and ethnobotanical assessment of the mangrove forest changes in the Navachiste-San Ignacio-Macapule lagoon complex, Sinaloa, Mexico. Ecol. Soc. 2005, 10, 16.
24. Hussain, S.A.; Badola, R. Valuing mangrove benefits: contribution of mangrove forests to local livelihoods in Bhitarkanika Conservation Area, east coast of India. Wetl. Ecol. Manag. 2010, 18, 321–331.
25. Walters, B.B.; Rönnbäck, P.; Kovacs, J.M.; Crona, B.; Hussain, S. A Ethnobiology, socio-economics and management of mangrove forests: A review. Aquat. Bot. 2008, 89, 220–236. 26. Badola, B.; Barthwal, S.; Hussain, S. Attitudes of local communities towards conservation of
mangrove forests: A case study from the east coast of India. Estuar. Coast. Shelf. Sci. 2012, 96, 188–196.
27. Walters, B.B.; Burt, M. Integrated management of common property fuel-wood resources from natural and plantation forests. Presented at the IDRC Workshop on Common Property Resources, Winnipeg, Canada, September 1991.
28. Bandaranayake, W.M. Traditional and medicinal uses of mangrove. Mang. Salt Marsh. 1998, 2, 133–148.
29. Kridiborworn, P.C.A.; Yuttitham, M.; Tripetchkul, S. Carbon sequestration by mangrove forest planted specifically for charcoal production in Yeesarn, Samut Songkram. J. Sustain. Energy Environ. 2012, 3, 87–92.
© 2014 by the authors; licensee MDPI, Basel, Switzerland. This article is an open access article distributed under the terms and conditions of the Creative Commons Attribution license (http://creativecommons.org/licenses/by/4.0/).