Página | 2150
https://periodicos.utfpr.edu.br/rbta
Application of sensory analyses in the
development of a new apple cider
RESUMO
Paulo Ricardo Los
[email protected] orcid.org/0000-0001-8841-0570
Universidade Estadual de Ponta Grossa, Ponta Grossa, Paraná, Brasil. Cintia Maia Braga
[email protected] orcid.org/0000-0002-4596-0377
Universidade Estadual de Ponta Grossa, Ponta Grossa, Paraná, Brasil. Jose Ricardo Ferreira de Carvalho
[email protected] orcid.org/0000-0001-8270-6143
Universidade Estadual de Ponta Grossa, Ponta Grossa, Paraná, Brasil. Deise Rosana Silva Simões
[email protected] orcid.org/0000-0001-7430-1234
Universidade Estadual de Ponta Grossa, Ponta Grossa, Paraná, Brasil. Alessandro Nogueira
[email protected] orcid.org/0000-0001-7671-3056
Universidade Estadual de Ponta Grossa, Ponta Grossa, Paraná, Brasil.
The development of a sparkling apple cider based on French technology and quality and desirable characteristics for Brazilian consumer may be a stratagem to development of a new beverage. The objective of this work was to develop and to characterize this beverage through physical-chemical and sensory analysis. The ranking and acceptability test and quantitative descriptive analysis (QDA) were performed in this work. The QDA was performed with 13 selected and trained assessors. 16 aspects of product were evaluated: color, foam, turbidity, brightness, bubbles, the fruity, alcoholic, acetic, and fermented aromas, sweetness, astringency, acidity, alcohol, apple flavor and viscosity. The alcoholic degree was standardized in 4.5 oGL. The ranking test showed 50.0 g L-1 and 0.75 g 100 mL-1
of residual sugar and acidity, respectively. The foam characteristics were obtained with 4.0 g hL-1 of propylene glycol alginate. The residual sugar was standardized with
cryoconcentrated apple juice, which provided striking fruity aroma. The product was classified as sweet, low viscosity, cloudy however yellow as beer, with pleasant and persistent foam and bubbles. The acceptability rate was 81.6%, with purchase intent of approximately 85.0%. The results indicate a high quality sparkling beverage with good marketing perspectives.
Página | 2151
INTRODUCTION
Apple cider, sparking or not, was known in Europe for more than 2000 years ago. According to ancient documents, cider was already consumed by the Celts before the Roman arrival. At that time (100 B.C.) the beverage was spread by the soldiers throughout all Europe (JARVIS et al., 1995).
During centuries, apples were not selected for processing. The industrial apples comprise crab apples selected based on their chemical composition (sweet/acid/sharp/astringency) to obtain an apple cider with desired characteristics (DRILLEAU, 1991). Thus the consumption habit and quality characteristics of apple cider were established in a unique form in each producing country. In some European countries such as France, England, Spain, Germany and Switzerland, fermented apple or apple cider, has distinct sensory characteristics. Even with the advances of science and technology, there are many industrial units where the processing is conducted to reach a final product with features defined by local tradition. It influences directly the genetic improvement of industrial varieties, their mixtures to standardization of taste or brand differentiation and processing technology.
The commercial apples were introduced in Brazil along the 1950's and nowadays the potential production reaches 1,000,000 ton/year. Apple processing industries use unqualified fruits (20-30% of total production) for commercial purposes. Fuji and Gala varieties (circa of 95% of total production) show low content of phenolic compounds and acidity. Therefore, there is not a good contribution to the viscosity of the juices and fermented beverages (WOSIACKI; NOGUEIRA, 2010; FERREIRA, 2009; WOSIACKI et al., 2008).
The consumption of cider is decreasing due to quality and market trends. The Brazilian ciders have color and turbidity similar as sparkling white wine stored in a bottle trying to imitate champagne. In order to remove the color, sulfite is powdered in the apple during milling operation. It affects directly the aromas formation by oxidative yeasts present on the apple epicarp. The fast alcoholic fermentation promotes aromas production with notes of “yeasts” (NOGUEIRA et al., 2007). The correction with sugar reaching the limit of 120.0 g.L-1 regulated by
Página | 2152
Decree no. 6871 of 06.04.2009, which regulates Law no. 8918 of 14/07/1994, that provides for the standardization, classification, registration, inspection, the production and the supervision of beverages and allows that Brazilian cider can be made with the addition of water .The cider should be a quality product, and the raw material with levels of tannins that confer astringency to product and with acidity that makes it refreshing. The normal color should vary from light yellow to dark orange similar to apple juice clarified (NOGUEIRA; WOSIACKI, 2012).
Quantitative descriptive analysis (QDA) (STONE; SIDEL, 1998; ABNT:NBR 14140, 1998) is a method that provides a description of the sensory properties of the product, representing one of the most complete and sophisticated methods for sensory characterization of important sensory attributes in foods, including cider (HUSSON et al., 2004; PICINELLI LOBO et al., 2005). According to Stone and Sidel (1993) QDA, has the following advantages over other methods of evaluation:
a) Confidence in the trial of a team of 10 to 12 trained tasters, instead of a few specialists;
b) The development of an objective descriptive language, closer to the language of the consumer;
c) The development of consensual descriptive terminology to be used that implies more agreement in the judgments of the tasters and the products are analyzed with replications for all judges in blind taste tests and the results statistically analyzed;
d) When it is associated with the study affective of consumer, to reach conclusions is extremely important as knowing what the sensory intensity that are present in more products or less, accepted by consumers, and yet;
e) To verify how competitor products differ sensory among themselves. Thus, if desirable, it is possible to know exactly which sensory attributes must be lowered, intensified, removed or placed on the product to possibility overcome its competitors (ABNT, 1998).
Thus, this work aims to develop, identify and define the quality attributes of a new sparkling apple cider according to the QDA and verify the beverage’s acceptability and purchase intent.
Página | 2153
MATERIALS AND METHODS APPLE JUICE
The fruits were selected and cleaned and then fragmented in a microprocessor (Metvisa, Brusque SC, Brazil). The grated mass was wrapped in shredded plastic screens that overlapped, and was subjected to a pressure of 3 kgf cm-2 for 5 minutes (Eureka Hydraulic press, Hoppe Ind. Ltd., Brazil). The juice was
treated with pectinase (Pectinex® Ultra Clear, Novozymes, Brazil) at a rate of 3 mL hL-1 (45 °C, 2 h) (Wosiacki et al., 1989) to pectin sedimentation.
CRYOCONCENTRATED APPLE JUICE
The depectinized apple juice (13 oBrix) was distributed in aluminum containers
(40 x 20 x 6 cm), overlapping, interspersed with a polypropylene sheet of 1.0 cm and conditioned in a horizontal freezer at -18 °C. After 24 hours, the frozen product was transferred to recipient tissue (cheese cloth) and centrifuged at 2800 rpm during 3 min (WAMKE, Centrifuge Consul). The procedure was repeated until cryoconcentrated reach approximately 50 °Brix (CARVALHO et al., 2010).
APPLE FERMENTED
Apple juice was transferred to fermenter of 25.0 L. It was used a commercial dry active yeast Saccharomyces cerevisiae rf cerevisiae Fermol ® Bouquet (AEB Group) with a population of 2.0 x 10⁶cels mL-1. The alcoholic fermentation has
occurred at room temperature until complete sugar consumption. This apple cider was the base used in all experiments.
THE NEW APPLE CIDER
The apple cider was diluted with fresh water to 4.5 °GL to standardize the alcohol degree, and blended with cryoconcentrated apple juice (40 oBrix) to reach
30.00, 50.00 or 70.00 g L-1 of residual sugar. For each mixture, the acidity was
adjusted with 30% citric acid (18427-Biotec) to 0.95, 0.75, 0.60 and 0.45 g 100 mL-1. The mixtures were used to determinate the preferred combination according
Página | 2154
The propylene glycol alginate (Kelcoloid) was tested at concentrations 0.03; 0.04 e 0.05 g L-1. This foam stabilizer was dissolved in water (30 °C), and heated
with shaking until 65 oC. After cooling to room temperature (25 oC) the stabilizer
was added to the beverage. The samples were carbonated (0 °C and 2.0 Bar) with carbon dioxide (CO2) with purity between 98 and 99% (White Martins). The tests
were done in triplicate in glass graduate cylinder (190 mL volume). Gasified sample (10 °C) was added at the same rate until the foam reaches the edge of the glass graduate cylinder to determine the foam persistence time and visual characteristics (CARVALHO et al., 2010).
PHYSICAL-CHEMICAL ANALYSIS
The levels of glucose were determined by enzymatic method and reducing sugars by the classical method of Somogyi-Nelson (TANNER; BRUNNER, 1985), expressed in g 100 mL-1. Fructose was calculated by difference. The total acidity
and volatile acidity were calculated with the factor of malic acid and acetic acid, respectively (IAL, 2008). The ethyl alcohol content was determined by Ebulliometry and total nitrogen content was analyzed by the method of Kjeldahl, according to IAL (2008). The phenolic compounds were determined by Folin-Ciocalteu (SINGLETON and ROSSI, 1965).
DETERMINATION OF ANTIOXIDANT ACTIVITY
To determine the antioxidant activity was used the method of FRAP (Ferric Reducing Antioxidant Power), as described by Benzie and Strain (1996) and Pulido, Bravo and Saura-Calixto (2000). The result was expressed as mmol of iron reduction / antioxidant power (FRAP value).
PREFERENCE EVALUATION BY RANKING TEST
50 consumers among undergraduate and graduate students, professors and officials of the State University of Ponta Grossa– UEPG attended of the preference evaluation of apple cider. This test ISO 8587:2006 was applied in “Samples Group A”; “Samples Group B” and “Samples Group C” containing 30; 50 and 70 g L-1 of
Página | 2155
concentration, respectively. These values were determined after laboratory tests. Samples were served (7 oC) to tasters in transparent tulip shape bowls made with
polyvinyl chloride (PVC) consisted of around 55 mL of capacity. Assessors informed their preference placing them in descending order (FERREIRA et al., 2000). The results were evaluated according to the table of Christensen through critical differences among the sums of total orders (DUTCOSKY, 2013; QUEIROZ, 2006). After examining the results of preference for each group, the preferred samples were subjected to a new evaluation of preference.
QUANTITATIVE DESCRIPTIVE ANALYSIS (QDA)
The method of quantitative descriptive analysis (STONE; SIDEL, 1993) was applied in order to describe and to quantify the sensory characteristics of the product.
Selection of assessors
Tasters were selected by discriminative power and results reproducibility as method proposed by Damasio and Costell (1991). 13 trained assessors (7 male and 6 female) with knowledge in sparkling beverages of low alcoholic content (beer) facilitated the operationalization of QDA. They were trained to evaluate apple cider. The assessors were submitted to the triangular test of recognition of smells with samples in the same pattern presents in the beverage. Trials to identify taste were done in order to verify the sensitivity of the tasters of the product characteristics (acid, bitter, salt, sweet and taste unidentified or other) (STONE and SIDEL, 1998). All the 13 assessorss answered correctly 80% of tests and were selected (FERREIRA et al., 2000).
Descriptive terms of the beverage
At this stage of sensory analysis each evaluator received a sample of the beverage in order to identify each parameter related to appearance, aroma, flavor and texture, according to NBR 14140 (ABNT, 1998).
Página | 2156
Discussion and standardization of the extremes of descriptive terms
The assessors discussed at a round table the terms chosen to eliminate redundancies and similar terms, selecting the terms that best describe the product characteristics. In this moment, the assessors group determined the definitions and suggested reference samples in maximum and minimum of the scales for each attribute.
Training of assessors
The beverage itself was used in the training of assessors, but with different concentrations (weak to strong) for evaluation of the attributes (color, foam, turbidity, brightness, bubbles, fruity, alcoholic and acetic). Each taster was individually evaluated with three replications for each attribute. Data were evaluated by ANOVA, using Microsoft Excel 2007 software, for information about the power of description and repeatability of the assessors (POWERS et al., 1984).
Final evaluation of the beverage
Sixteen parameters in triplicate were evaluated to the characterization of the beverage. The sample was evaluated on a scale of 9 cm with a scale of less and greater intensity anchored at its ends.
Sensory acceptability test of sparkling apple cider
The method proposed by Meilgaard et al. (1991) was used to evaluate the acceptability of beverage, 168 assessors participated in the test, including graduation and postgraduate students, professors and officials of the State University of Ponta Grossa. The test of acceptability and purchase intent were conducted in hedonic scale of 7 and 5 points, respectively. Samples were served to consumers in clear plastic cups with 50 mL of capacity at 10 oC (FERREIRA et al.,
Página | 2157
RESULTS AND DISCUSSION
CHEMICAL COMPOSITION OF PRODUCTS
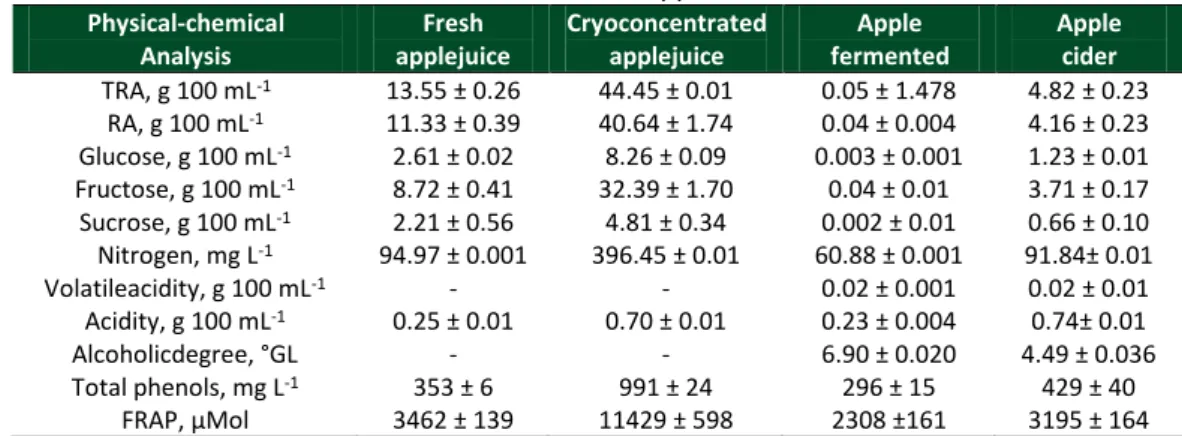
The analysis’ results of the products (juice, cryoconcentrated juice and apple fermented that were utilized in the preparation of apple cider and the apple cider ready) are showed on Table 1.
The apple juice and the apple fermented from Gala cultivar present similar values to those found in the literature (WOSIACKI et al., 2008; NOGUEIRA; WOSIACKI, 2012). The physical-chemical values of cryoconcentrated apple juice, based on sugars, indicate a concentration of approximately 3.3 times. However, nitrogen content of the cryoconcentrated juice increased approximately four (4) times (Table 1).
The alcoholic fermentation was conducted until exhaustion of fermentable sugars (10 days) at room temperature (20-27 oC). The alcohol content was of 6.9 oGL, and it corresponds to the sugar consumed by the yeast. The acidity of apple
cider was similar to the acidity of apple juice (Table 1). The phenols content decreased 16% with the alcoholic fermentation, similar of what (12%) Zardo et al. (2008) found for the same cultivar. Furthermore the antioxidant activity decreased 33% compared to the juice.
The diluted apple cider was corrected with cryoconcentrated apple juice in order to increase the sugar content, fruity aroma, total phenols and antioxidant activity.
Table 1 - Physical-chemical composition of apple juice, cryoconcentrated apple juice, dry apple cider and corrected apple cider
Physical-chemical Analysis Fresh applejuice Cryoconcentrated applejuice Apple fermented Apple cider TRA, g 100 mL-1 13.55 ± 0.26 44.45 ± 0.01 0.05 ± 1.478 4.82 ± 0.23 RA, g 100 mL-1 11.33 ± 0.39 40.64 ± 1.74 0.04 ± 0.004 4.16 ± 0.23 Glucose, g 100 mL-1 2.61 ± 0.02 8.26 ± 0.09 0.003 ± 0.001 1.23 ± 0.01 Fructose, g 100 mL-1 8.72 ± 0.41 32.39 ± 1.70 0.04 ± 0.01 3.71 ± 0.17 Sucrose, g 100 mL-1 2.21 ± 0.56 4.81 ± 0.34 0.002 ± 0.01 0.66 ± 0.10 Nitrogen, mg L-1 94.97 ± 0.001 396.45 ± 0.01 60.88 ± 0.001 91.84± 0.01 Volatileacidity, g 100 mL-1 - - 0.02 ± 0.001 0.02 ± 0.01 Acidity, g 100 mL-1 0.25 ± 0.01 0.70 ± 0.01 0.23 ± 0.004 0.74± 0.01 Alcoholicdegree, °GL - - 6.90 ± 0.020 4.49 ± 0.036 Total phenols, mg L-1 353 ± 6 991 ± 24 296 ± 15 429 ± 40 FRAP, μMol 3462 ± 139 11429 ± 598 2308 ±161 3195 ± 164
Note : (TRA) total reducing sugar; (RA) reducing sugar; (FRAP) Ferric Reducing Antioxidant Power; (-not determined
Página | 2158
PREFERENCE EVALUATION OF SPARKLING APPLE CIDER
The sugar concentrations measured to evaluate the preference were 30 (A), 50 (B) and 70 (C) g L-1 and the acidity concentrations were 0.90, 0.75; 0.60 and 0.45
g 100 mL-1. The 50 assessors consisted of young people (53% were women and 47%
men) with more than 90% younger than 35 years old.
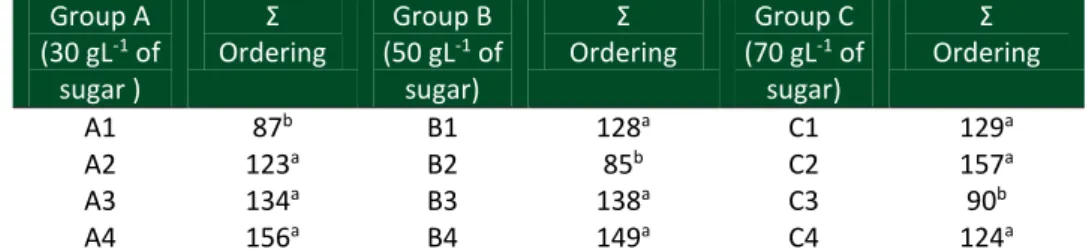
In Table 2, it is showed a summary of the sum of the orders obtained from the ranking test for preference. According to the results obtained, it can be observed that for the sugar content of 30 g L-1 (Samples Group A) the acidity of beverage
with 0.90 g 100 mL-1 was more preferred. In Samples Group B, the values of B1, B3
and B4 were very close and did not show significant difference at the 5% probability. The favorite beverage in sugar concentration of 50 g L-1, was with
correction of acidity to 0.75 g 100 mL-1. In the group C, the sample C3 with 70 g.L
and 0.60 g 100 mL-1 of sugar and acidity respectively, was the more preferred and
the sample C2 the less preferred. No significant differences were detected (level of probability 5%) among other samples fermented based on the Christensen table (Dutcosky, 2013). It is observed in Table 2 that among groups of samples, as far as the concentration of sugar increases, there is a preference for samples with lower concentration of acid, due the general preference of the Brazilian consumers by sweet beverages.
Tabela 2 -Ranking-preference test results for apple cider samples standardized with sugar in 30 (A), 50 (B) e 70 g L-1 (C) and acidity in 0.90 (1); 0.75 (2); 0.60 (3) e 0.45 g100 mL-1 (4).
Group A (30 gL-1 of sugar ) Σ Ordering Group B (50 gL-1 of sugar) Σ Ordering Group C (70 gL-1 of sugar) Σ Ordering A1 87b B1 128a C1 129a A2 123a B2 85b C2 157a A3 134a B3 138a C3 90b A4 156a B4 149a C4 124a
Note: LSD = least significant difference = 34 by Christensen table; total ranking with same letter in column do not differ significantly(5%).
Fonte: Elaborado pelo autor (2015).
The ranking-preference results between preferred combination of sugar and acidity (A1, B2 and C3) are showed in Table 3. The sample B2 had the lowest sum of order, being the more preferred (50 g L-1 of sugar and 0.75 g 100 mL-1 of acidity).
The Brazilian culture is to consume soft drinks (gasified) with high concentrations of sugars (11% m/m) and pH 2.7-3.5 in order to create a refreshing harmony (BARNABÉ; VENTURINI-FILHO, 2010). This is an important fact that must be taken
Página | 2159
into account because it might represent the acceptation or not of this new beverage.
Table 3 – Ranking-preference test to apple cider with three sugar and acidity combination
Sample A1 (Sugar: 30.00 gL -1and acidity: 0.90 g100mL-1) B2 (Sugar: 50.00 gL-1 and acidity: 0.75 g100mL-1) C3 (Sugar: 70.00 gL-1 and acidity: 0.60 g100mL -1) Total 193ª 136b 171a
Note: LSD = least significant difference = 34 by Christensen table; total ranking with same letter in column do not differ significantly (5%).
Fonte: Elaborado pelo autor (2015).
In Table 1, it is possible to observe the physicochemical values of the corrected apple cider with cryoconcentrated apple juice, for values of 50 g L-1 of sugars. This
residual sugar classifies the French cider (> 42 g L-1) and Brazilian cider (> 20 g L-1)
in sweet (NOGUEIRA; WOSIACKI, 2012; LEA; DRILLEAU, 2003), but it is well known that the Brazilian’s preference is for sweetened beverages and Europeans’ preference is for beverage with low sweetness and more sour. This correction with cryoconcentrated apple juice, increase the values of total nitrogen, total phenols and antioxidant activity compared to the dry apple cider (Table 1). In addition, it enriches the aromatic sensation with fruity notes and a slight apple aroma perception. The French cider is recognized for its aromas with floral and fruity notes (LEA; DRILLEAU, 2003). Cryoconcentrated apple juice with 40 oBrix increased
the phenolic compounds content in 45% and antioxidant activity in 38% compared to apple juice (CARVALHO et al., 2010).
The acidity was corrected to 0.75 g 100 mL-1 with citric acid, which promotes
a freshness feeling in the mouth. According to Drilleau (1991) apple must that has about 0.45 g 100 mL-1 of acidity and tannin content greater than 200 mg L-1 are
classified as sharp-bitter. Thus, the final formulation provided a balance between sugar and acidity based on the results of sensory tests performed by setting the "body" of apple cider. In the French situation, it is necessary to mix cultivars to obtain a proper balance of sugar, acidity and tannins, significant parameters to obtain a quality product, rarely found in a single cultivar (LEA; DRILLEAU, 2003), and the residual sugar is normally used between <28 g L-1 (dry) and 28-42 g L-1
Página | 2160
FOAM OF THE SPARKLING APPLE CIDER
A little foam formation that quickly disintegrated was observed in the fermented sparkling apple cider during previous tests. Test with different additions of propylene glycol alginate stabilizer in order to keep longer the natural foam product were performed. The concentration of 5.0 g hL-1 of the stabilizer on the
product presented high and thick foam persistently > 1.5 minutes. At a concentration of 3.0 g hL-1 (used in brewing) the foam was brittle, with persistence
less than 40 seconds. With a 4.0 g hL-1 foam was similar to the natural foam, but
with good stability, with persistence from 1.20 to 1.30 minutes, which is the concentration chosen to be added to the product. The gasification process was done artificially with the pressure of 2.0 bar.
QUANTITATIVE DESCRIPTIVE ANALYSIS OF SPARKLING APPLE CIDER
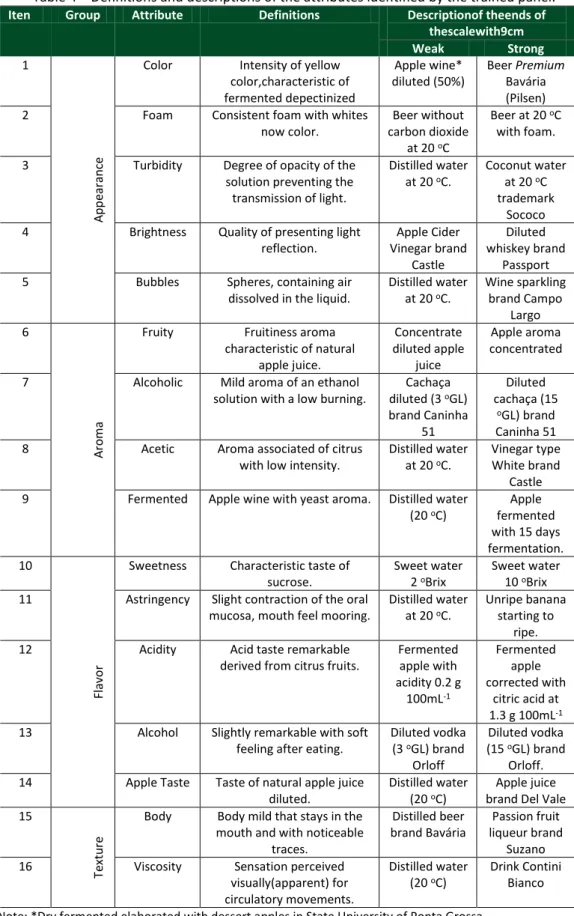
The evaluation form developed by consensus by the sensory panel (Table 4) consisted of 16 descriptive terms relating to appearance (color, foam, turbidity, brightness and bubbles), aroma (fruity, alcoholic, acetic, fermentation), flavor (sweetness, astringency, acidity, alcohol and apple taste) and texture (body and viscosity). The Table 4 presents descriptive terms with reference samples defined by the assessors.
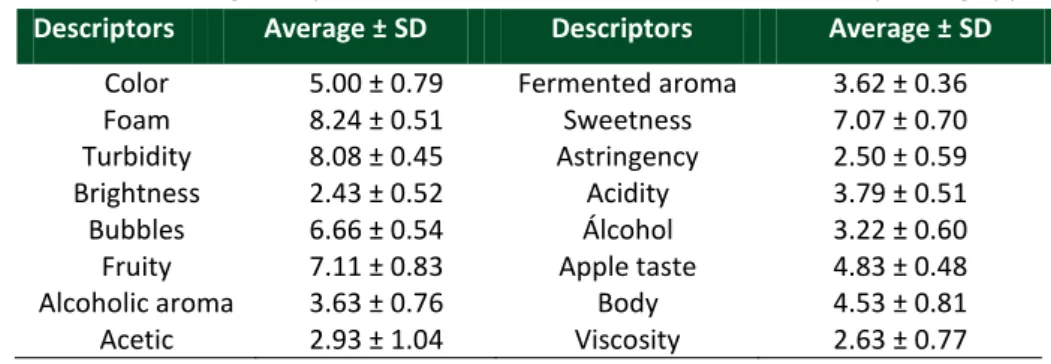
It might be observed the values of standard deviation obtained by the assessors in table 5. The low values reflected a good performance of the group in the evaluation of sparkling apple cider. Once this is a new product, there are not data to compare results.
It was observed that the sparkling apple cider presents quality attributes related to appearance, which are important in consumer choice. The product color was measured with a score five (5) in a scale from zero to nine, being closer to the color of beer than of apple cider. However, the color of apple cider is non-existent in Brazil due processing technology which makes this feature a new remark to the consumer.
Página | 2161
Table 4 – Definitions and descriptions of the attributes identified by the trained panel. Iten Group Attribute Definitions Descriptionof theends of
thescalewith9cm Weak Strong 1 A p p earan ce
Color Intensity of yellow
color,characteristic of fermented depectinized Apple wine* diluted (50%) Beer Premium Bavária (Pilsen)
2 Foam Consistent foam with whites
now color. Beer without carbon dioxide at 20 oC Beer at 20 oC with foam.
3 Turbidity Degree of opacity of the
solution preventing the transmission of light. Distilled water at 20 oC. Coconut water at 20 oC trademark Sococo
4 Brightness Quality of presenting light
reflection. Apple Cider Vinegar brand Castle Diluted whiskey brand Passport
5 Bubbles Spheres, containing air
dissolved in the liquid.
Distilled water at 20 oC. Wine sparkling brand Campo Largo 6 A ro ma
Fruity Fruitiness aroma
characteristic of natural apple juice. Concentrate diluted apple juice Apple aroma concentrated
7 Alcoholic Mild aroma of an ethanol
solution with a low burning.
Cachaça diluted (3 oGL) brand Caninha 51 Diluted cachaça (15 oGL) brand Caninha 51
8 Acetic Aroma associated of citrus
with low intensity.
Distilled water at 20 oC.
Vinegar type White brand
Castle
9 Fermented Apple wine with yeast aroma. Distilled water
(20 oC) Apple fermented with 15 days fermentation. 10 Fl avo r
Sweetness Characteristic taste of sucrose.
Sweet water 2 oBrix
Sweet water 10 oBrix
11 Astringency Slight contraction of the oral
mucosa, mouth feel mooring.
Distilled water at 20 oC.
Unripe banana starting to
ripe.
12 Acidity Acid taste remarkable
derived from citrus fruits.
Fermented apple with acidity 0.2 g 100mL-1 Fermented apple corrected with citric acid at 1.3 g 100mL-1
13 Alcohol Slightly remarkable with soft
feeling after eating.
Diluted vodka (3 oGL) brand Orloff Diluted vodka (15 oGL) brand Orloff.
14 Apple Taste Taste of natural apple juice
diluted.
Distilled water (20 oC)
Apple juice brand Del Vale 15
Te
xtu
re
Body Body mild that stays in the mouth and with noticeable
traces. Distilled beer brand Bavária Passion fruit liqueur brand Suzano
16 Viscosity Sensation perceived
visually(apparent) for circulatory movements. Distilled water (20 oC) Drink Contini Bianco Note: *Dry fermented elaborated with dessert apples in State University of Ponta Grossa.
Página | 2162
Despite of the color to be close of beer color, the sparkling apple cider has been processed with high turbidity and low brightness, different of the appearance of beer. Furthermore, the filtering operation of beverage would reduce the phenolic content and antioxidant activity of the product (CARVALHO et al., 2011). The attributes of foam and bubbles showed high mean, fundamental characteristics for a sparkling drink, since these are the first attributes noticed by consumers (LIGER-BELAIR et al., 1999).
Table 5 – Values assigned by assessors about attribute to the fermented sparkling apple Descriptors Average ± SD Descriptors Average ± SD
Color 5.00 ± 0.79 Fermented aroma 3.62 ± 0.36
Foam 8.24 ± 0.51 Sweetness 7.07 ± 0.70
Turbidity 8.08 ± 0.45 Astringency 2.50 ± 0.59
Brightness 2.43 ± 0.52 Acidity 3.79 ± 0.51
Bubbles 6.66 ± 0.54 Álcohol 3.22 ± 0.60
Fruity 7.11 ± 0.83 Apple taste 4.83 ± 0.48
Alcoholic aroma 3.63 ± 0.76 Body 4.53 ± 0.81
Acetic 2.93 ± 1.04 Viscosity 2.63 ± 0.77
Note: SD = Standard deviation
Fonte: Elaborado pelo autor (2015).
The product was defined as fruity, slightly alcoholic and with a slight aroma of fermentation. These characteristics are appreciated and constitute some of the features of quality of French cider (LEA; DRILLEAU, 2003). The addition of cryoconcentrate apple juice enriches the aroma of fermentation and promotes a product with perception of apple and fruity aroma.
In the flavor group the attribute of sweetness showed a high average. This information is very important in the acceptability by the Brazilian consumers. The astringency showed low values, the opposite of the French cider which has astringency as one of the main attributes of quality (NOGUEIRA; WOSIACKI, 2012). The acidity was barely noticeable however provided a refreshing drink. The taste or aroma of alcohol had lower values and the predominantly aroma was the fruity. The taste of apple confirms the identity of the product. The texture of the product showed low viscosity due to the depectinization process of fresh apple juice and products used in the formulation of the beverage (cryoconcentrated juice and apple fermented).
Página | 2163
EVALUATION OF THE ACCEPTABILITY OF SPARKLING APPLE CIDER
One hundred sixty eight evaluators participated of the sensory evaluation (52% and 48% men and women, respectively). 62% of the evaluators were young (< 25 years) featuring a young audience.
From the 168 results, the average acceptability obtained for the sparkling apple cider was 5.72 on a scale from one (I disliked very much) to seven (I liked very much). It is observed in the histogram in Figure 3A that the greater frequency of notes is in the positive part of the range, i.e. this value represents the hedonic scale applied between the categories ”I liked, I really liked and I liked very much” for a total of 92.3% between these groups (Figure 3A), which is very satisfying because it is a new product on the market, with different characteristics.
Figure 1 - Distribution of percentages of values attributed to sparkling apple cider for acceptability (A) and frequency of categories of purchase intent for the developed
product (B).
Fonte: Elaborado pelo autor (2015).
According to the results that correspond to consumer assessors, the beverage presents low alcohol content, attractive color and presence of foam to
0 15 30 45 % o f acce p ta b ili ty Hedonic Levels
A
0 15 30 45 I definetly would no buy I probably would not buy Indiferent May be I would buy I probably would buy % o f an sw ers Purchase intentB
Página | 2164
improve the appearance. These characteristics were the most frequently cited in the place intended for comments on the evaluation form of the sample.
Referring to the average acceptability rate, the apple cider had 81.6% of acceptability, which is considered very good and with large market prospects. Only a small proportion (< 5%) gave scores related to the categories corresponding to “dislike” the product.
The analysis of the results are presented in the form of histogram in Figure 3B, which relates to consumer attitudes towards the product, indicate a purchase intent by approximately 68% of the consumers, considering the sum of the last two categories and about 23.0% of the consumers were undecided and only less than 9.0 % of consumers would not buy the product.
CONCLUSION
The sparkling apple cider with 4.5 oGL, 50 g L-1 of residual sugars; 0.75 g 100
mL-1 of acidity, antioxidant activity very similar to that features found in apple juice.
Beverage description by ADQ allowed to visualize the sensory profile. Attributes as fruity aroma, sweetness and foam close to the natural however more persistent with the presence of bubbles were indicated by assessors.
This beverage consist in a new apple cider protocol may be elaborated with dessert apples, with stable quality standard, sensorially approved by consumers and high market potential.
ACKNOWLEDGEMENTS
The authors are deeply grateful for the scholar ships from CNPq and Araucaria Foundation.
Página | 2165
Aplicação de análise sensorial no
desenvolvimento de um novo fermentado
frisante de maçã
RESUMO
A elaboração de um fermentado frisante de maçã com base na tecnologia francesa aliada à aceitação do consumidor pode ser uma estratégia para o desenvolvimento de uma nova bebida. O objetivo deste trabalho foi desenvolver e caracterizar este novo produto por meio de análises físico-químicas e sensoriais. Foram utilizados os testes de ordenação, aceitabilidade e perfil sensorial descritivo para a caracterização sensorial do produto. O perfil sensorial foi realizado com 13 avaliadores treinados. Foram avaliados 16 aspectos: cor, espuma, turbidez, brilho, bolhas, sabor frutado, alcoólico, ácido acético, aromas fermentados, doçura, adstringência, acidez, álcool, sabor de maçã e viscosidade. O grau alcoólico foi padronizado em 4,5 OGL. O teste de ordenação indicou 50,0 g L-1 de açúcar
residual e 7,5 g L-1 de acidez. As características ideais de espuma foram obtidas com 0,04 g
L-1 de alginato de propilenoglicol. A correção do açúcar com suco crioconcentrado
proporcionou aroma frutado marcante. O produto foi classificado como suave, com baixa viscosidade, turvo, cor amarela semelhante ao da cerveja, com uma sutil e persistente espuma e liberação de bolhas. A porcentagem de aceitabilidade do produto final foi de 81,6%, com uma intenção de compra de 85,0%. Desta forma, foi desenvolvida uma bebida de alta qualidade com boas perspectivas de mercado
Página | 2166
REFERÊNCIAS
ABNT. ASSOCIAÇÃO BRASILEIRA DE NORMAS TÉCNICAS. Alimentos e Bebidas - Análise Sensorial - Teste de análise descritiva quantitativa (ADQ). NBR 14.140, Rio de Janeiro, julho, 1998.
ALBERTI, A.; WOSIACKI, G.; NOGUEIRA, A. Apple wine processing with nitrogen contents. Brazilian Archives of Biology and Technology, Curitiba, v. 54, n. 1, p. 10-18, 2011.https://doi.org/10.1590/s1516-89132011000300017
BENZIE, I. F. F.; STRAIN, J. J. The ferric reducing ability of plasma (FRAP) as a measure of “antioxidant power”: the FRAP assay. Analytical Biochemistry, New York, v. 239, n. 1, p. 70-76, 1996.https://doi.org/10.1006/abio.1996.0292
BARNABÉ, D.; VENTURINI FILHO, W. G. Refrigerantes. Bebidas não alcoólicas: ciência e tecnologia. São Paulo, 2010. v. 2, p. 177-196.
CARVALHO, J. R.; SILVA, K. M.; BRAGA, C. M.; ALBERTI, A.; WOSIACKI, G.;
NOGUEIRA, A. Efeito da clarificação com gelatina no teor de compostos fenólicos e na atividade antioxidante de fermentados de maçãs. Brazilian Journal of Food Technology, Campinas, v. 14, n. 1, p. 41-49,
2011.https://doi.org/10.4260/BJFT2011140100006
CARVALHO, J. R.; SILVA, K. M.; SIMÕES, D. R. S.; WOSIACKI, G.; NOGUEIRA, A. Elaboração de fermentado frisante de maçã com características semelhantes à sidra francesa. Boletim do Centro de Pesquisa de Processamento de Alimentos, Curitiba, v. 28, n. 1, p. 97-114, 2010.https://doi.org/10.5380/cep.v28i1.17901
DAMASIO, M. H.; COSTELL, E. Análisis sensorial descriptivo: generación de descriptores y selección de catadores. Revista Agroquímica y Tecnologia de Alimentos, Logroño, v. 31, n. 2, p. 165-178, 1991.
DRILLEAU, J.F. Consolider les connaissances et maîtriser la qualité du produit fini. Pomme, Paris, v. 23, p.23-25, 1991.
DUTCOSKY, S. D. Análise Sensorial de Alimentos. 4 ed. rev e ampl. Curitiba: Champagnat, 2013. 531 p.
FERREIRA, V. L.; ALMEIDA, T. C. A.; PETTINELLI, M. L. C. V.; DA SILVA, M. A. A. P.; CHAVES, J. B. P.; BARBOSA, E. M. M. Testes afetivos. Análise Sensorial Testes Discriminativos e Afetivos. Campinas: Profíqua, 1 ed., 2000, p. 54-71. FERREIRA, P. Yes, nós temos maçãs. Inovação em Pauta, Rio de Janeiro, n. 5, p.43-47, 2009.
HUSSON, F.; BOCQUET, V.; PAGÈS, J. Use of confidence ellipses in a PCA applied to sensory analysis application to the comparison of monovarietal ciders. Journal of Sensory Studies, Wesport, v. 19, n. 6, p. 510-518, 2004.
Página | 2167
IAL. Instituto Adolfo Lutz. Métodos físico-químicos para análises de alimentos, 4 ed., São Paulo, 2008.
INTERNATIONAL ORGANIZATION FOR STANDARIZATION. ISO 8587: sensory analysis - methodology - ranking. Switzerland:ISO, 2006.
JARVIS, B.; FORSTER, M. J.; KINSELLA, W. P. Factors affecting the development of cider flavour. Journal of Applied Bacteriology Symposium Supplement, London, v. 79, p. 5–18, 1995.
LEA, A.; DRILLEAU, J. F. Cider-making. In: LEA, A. G. H.; PIGGOT, J. R. Fermented Beverage Production, London: Blackie Academic & Professional, 2003, p. 59-87. LIGER-BELAIR, G.; MARCHAL, R.; ROBILLARD, B.; VIGNES-ADLER, M.; MAUJEAN, A.; JEANDET, P. Study of effervescence in a glass of champagne: frequencies of bubble formation, growth rates, and velocities of rising bubbles. American Journal of Enology and Viticulture, Davis, v. 50, n. 3, 1999, p. 317-323.
QUEIROZ, M. I.; TREPTOW, R. O. Análise sensorial para a avaliação da qualidade dos alimentos. Rio Grande: Ed. FURG, 2006.
MEILGAARD, M.; CIVILLE, G. V.; CARR, B. T. Sensory evaluation techniques, 2.ed. Boca Raton: CRC Press, 1991.
NOGUEIRA, A.; WOSIACKI, G. Apple cider fermentation. In: HUI, Y. H.; EVRANUZ, E. Ö. Handbook of Plant-Based Fermented Food and Beverage Technology, 2 ed., Boca Raton: CRC Press, 2012, p. 209-235.
NOGUEIRA, A.; MONGRUEL, C.; SIMÕES, D. R.; WASZCZYNSKYJ, N.; WOSIACKI, G. Effect of biomass reduction on the fermentation of cider. Brazilian Archives of Biology and Technology, Curitiba, v. 50, p. 1089-1098,
2007.https://doi.org/10.1590/s1516-89132007000700019
PICINELLI LOBO, A.; RODRÍGUEZ MADRERA, R.; MANGAS ALONSO, J. J. A study of cider distillates using sensory and chromatographic data and chemometric analysis. Journal of Food Science, Malden, v. 70, n. 3, p. 204–207,
2005.https://doi.org/10.1111/j.1365-2621.2005.tb07158.x
POWERS, J. J.; CENCIARELLI, S.; SHINHOLSER, K. El uso de programas estadísticos generales em la evaluación de los resultados sensoriales. Revista de Agroquímica y Tecnología de Alimentos, Logroño, v. 24, p. 469-84, 1984.
PULIDO, R.; BRAVO, L.; SAURA-CALIXTO, F. Antioxidant activity of dietary polyphenols as determined by a modified ferric reducing/antioxidant power assay. Journal of Agricultural and Food Chemistry, Easton, v. 48, n. 8, p. 3396-3402, 2000.https://doi.org/10.1021/jf9913458
SINGLETON, V. L.; ROSSI, J. A. Colorimetry of total phenolic with phosphomolibdic acid reagent. American Journal of Enology and Viticulture, Davis, v. 16, n.3, p.144-158, 1965.
Página | 2168
STONE, H.; SIDEL, J. L. Sensory evaluation practices, 2 ed., London: Academic Press, 1993. p. 337.
STONE, H.; SIDEL, J. L. Quantitative descriptive analysis: developments, applications, and the future. Food Technology, Chicago, v. 52, n. 8, p. 48-52. 1998.
TANNER, H., BRUNNER, H.R. GetränkeAnlytik - Untersuchungsmethodefürdia Labor- und Betriebspraxis. Wädesnwill: VerlagHelles, 1985.
WOSIACKI, G.; NOGUEIRA. Suco de maçã. In: FILHO, W. G. V. (Ed.). Bebidas não alcoólicas; Ciência e Tecnologia. São Paulo: Editora Blucher, 2010, v. 2, p. 269-302.
WOSIACKI, G.; NOGUEIRA, A.; SILVA, N. C. C.; DENARDI, F. Quality profile of samples of 139 apples cultivars harvested in Brazil from 1982 to 2006. Acta Alimentaria, Budapest, v. 37, n. 1, p. 9-22,
2008.https://doi.org/10.1556/AAlim.37.2008.1.2
ZARDO, D. M.; ALBERTI, A.; DANTAS, A. P. C.; GUYOT, S.; WOSIACKI, G.; NOGUEIRA, A. Efeito do processamento no teor de compostos fenólicos e na atividade antioxidante em fermentados de maçã. Semina: Ciências Agrárias, Londrina, v. 29, n. 4, p. 829-838, 2008. https://doi.org/10.5433/1679-0359.2008v29n4p829 Recebido:06 nov. 2015. Aprovado:04 abr. 2017. Publicado:22 mai. 2017. DOI:10.3895/rbta.v11n1.3301 Como citar:
LOS, P. R. et al. Application of sensory analyses in the development of a new apple cider. R. bras. Tecnol. Agroindustr.,Ponta Grossa, v. 11, n. 1, p. 2150-2168, jan./jun. 2017. Disponível em:
<https://periodicos.utfpr.edu.br/rbta>. Acesso em: XXX. Correspondência:
Paulo Ricardo Los
Av. Carlos Cavalcanti, n. 4748, Uvaranas, CEP 84030-900, Ponta Grossa, Paraná, Brasil
Direito autoral: Este artigo está licenciado sob os termos da Licença CreativeCommons-Atribuição 4.0 Internacional.