USABILITY EVALUATION OF THE TOUCH SCREEN
AND MOUSE AS INPUT DEVICES BY PEOPLE WITH
INTELLECTUAL DISABILITIES
Tânia Rocha, Diana Carvalho, Ramiro Gonçalves, José Martins,Frederico Branco and Maximino Bessa
University of Trás-os-Montes e Alto Douro and INESC-TEC
Quinta de Prados, 5000 Vila Real, Portugal and Rua Dr. Roberto Frias, 4200 Porto, Portugal
ABSTRACT
With this study we aim to assess if the touch screen input device can be a more usable option for digital interaction by people with intellectual disabilities, when compared to a traditional mouse input. In previous studies, we observed that many users with intellectual disabilities struggle to interact with digital content when using traditional input devices, such as the keyboard or mouse. This can lead to a decrease in their motivation to access digital content. Therefore, it is important to evaluate other options, such as touch screens, in order to present a more usable option of interaction for this specific group. For that, we present a case study where the participants were invited to perform primitive selection tasks in a colouring activity, using a painting Web application. The results showed that this group presented a better performance and made less errors when interacting with the touch screen, rather than when compared with the traditional mouse input. We also registered an increase regarding their motivation and satisfaction, when using the touch screen as the input device.
KEYWORDS
Usability Evaluation, Intellectual Disability, Touch Screens, User Tests, e-Inclusion.
1. INTRODUCTION
The
e-digital gap between people, by providing all individuals equal access to information technologies (IT) and by teaching them the needed skills to use modern technological systems. Also it highlights the importance of promoting the use of Information and communication technologies (ICT) not only to help overcome exclusion, but also to improve economic performance, employment opportunities, quality of life and social participation and cohesion (Riga Ministerial Declaration 2006).
In order to improve e-Inclusion, digital environments must be accessible regardless of any special condition and/or human (in)capacities. However, there are several factors constraining this access to some specific groups of people. One of them is the user interfaces used by people with intellectual disabilities, being the usual input devices (mouse and keyboard). They require a steeper learning curve and are not
- ct
with digital environments (Mayer & Moreno 2003) (Blake 2012). Previous studies showed that people with intellectual disabilities, without major motor impairments, could interact with keyboards (not autonomously because they need help on the character recognition) and mouse (with some autonomy), but none of them provided actual ease of use regarding this group of users (Rocha 2014).
Also, it is important to understand what may be the most elemental tasks that a user can learn to perform different digital activities. In a virtual environment, the most basic tasks a user can perform are data selection, insertion and manipulation (Foley 1984). That is why we elected a primitive selection task to carry out the experiment.
In this paper we explore the usage of a touch screen as input device for a selection task. Touch interfaces have shown great potential regarding interaction mainly due to their ease of use, efficiency and intuitive
nature, as well as the possibility to increase productivity rates as far as information use (Kin 2009). Even considering different groups of users with distinctive ages, touch proves to be the fastest mode of interaction and the most consistent, with little variations when it comes to usability evaluation (Carvalho 2014). Indeed, for simple selection tasks, touch appears to be more efficient amongst different groups (children, adults and older-adults) in terms of mean time. In this regard, it was an evident option to compare the use of the mouse and the touch screen as input devices, in a first approach. We observed and assessed how a group of people with intellectual disabilities interact with the two different input devices (touch screen and mouse) by asking them to perform selection tasks and measuring their performance and satisfaction.
This paper is structured as follows: the background, where the main concepts are exposed (intellectual disabilities, digital accessibility and usability, and other studies are analysed); and the case study and its description (methods, participants, experimental design, apparatus, procedures, results and discussion). Finally, we present our conclusions and future work.
2. BACKGROUND
According to the Diagnostic and Statistical Manual of Mental Disorders (DSM), published by the American significantly below average, accompanied by significant limitations in adaptive functioning at least on two of the following skill areas: communication, self-care, domestic life, social skills, interpersonal relationships, use of community resources, self-containment, academic skills, APA 2013). In other words, an intellectual disability affects cognitive functions and their development over time. Its origin may result from genetic factors, environmental conditions, disease or injury during childhood, and circumstances occurring during and after pregnancy, as well as during the first years after birth (APA 2013). Moreover, this disability is closely associated with several pathologies regarding the intellectual development, dementia, or mental and intellectual retardation (WHO 2009).
Frequently, this group of people sees the access to digital environments constrained because tools and even contents are created without any concern for accessibility or usability (Rocha 2014). Being this access condi
Thus, digital accessibility and usability topics gain significance.
disability or special need, regarding to the navigation mechanism and presentation of page, operation of
software, hardware, and adaptation of e .
Another concept intrinsically linked with digital accessibility is digital usability. Usability is the level of effectiveness, efficiency and satisfaction a certain group of users, of a product or environment, accomplishes for a specific propose in a certain context of use (ISO 1997). Usability evaluation depends on the register and usability of a system, design or software, related to a specific group of users for a particular activity in a Preece et al. 1994). Also, a usability problem is "something that interferes with the user's ability to complete the task efficiently and effectively."(Karat 1992). The most used methods of usability assessment are: expert-based assessment (reviews and/or tests carried out by experts in usability: as heuristic evaluation), and evaluation with users (usability evaluation techniques with representative samples: user tests) (Hix & Hartson 1999)( Steed & Tromp 1998) (Karoulis et al. 2006). Specifically, user tests (also called usability tests) involve a group of potential users of the system, tending to have more accurate and objective results than the heuristic evaluation (Law & Hvannberg 2002). These tests are based on tasks and are performed on controlled environments (Prates & Barbosa 2003).
Regarding former studies, they highlighted problems in interaction, such as: text entry (the most problematic difficulties register); selection of multi-options (Harrysson et al. 2004), hyperlinks recognition and selection (Roh 2004)(Rocha et al. 2012), typing and reading of instructions (Roh 2004). Others even questioned the possibility of finding a guiding principle when planning digital tools and contents (as websites) for people with intellectual disabilities (Harrysson et al. 2004), due to difficulties resulting from the wide range of disabilities among this group of people. Furthermore, two studies notice that W3C guidelines for accessibility are insufficient to ensure access for people with intellectual disabilities (Small et al.
2005)(Opitz 2003). However, our own studies point to an increase in motivation by this group regarding the use of digital environments, but also show us that there are still several barriers to overcome in order to turn it into a truthfully autonomous, satisfactory, valuable user experience (Rocha 2014)( Rocha et al. 2012) ( Small et al. 2005).
3. CASE STUDY
With this case study, we pretend to assess if the touch screen, as an input device, can be a more usable option for digital interaction by people with intellectual disabilities, when compared with the traditional mouse input.
Before starting the experiment, users had a previous training phase. Thereunto, during two weeks (approximately thirty-five hours in total, and about two and a half hours per participant) the group was provided with basic training on handling touch screens concerning elemental selection tasks. Regarding the mouse input device, training was not needed because they had daily experience with this input device when performing these same elemental selection tasks aforementioned
3.1 Methods
In this study, the case study and ethnography are allied with the usability evaluation (user tests). The methods of data collection used are directly related to the research methods adopted and include: logbooks; document analysis, interviews, direct observation (used in the case study and ethnography); user tests, register of efficiency, effectiveness, and satisfaction variables (for usability evaluation.
3.2 Participants
From thirty-five, twenty were invited to partook in the pilot study (eight women and twelve men), whose ages ranged from 19 to 46 years old. These participants were selected by a special education teacher and a psychologist, according to the average rate of literacy and primary education (coincident with the third grade). Furthermore, within the group: seven users could read and write but the others expressed difficulties in this respect. However, for the proposed tasks described below (colouring drawings with a primitive selection task resorting to the mouse and touch screen), these capabilities were not considered to be relevant. After seven years of being part of a previous project of digital integration, we can say that the group presented the same level of experience in interacting with digital environments, i.e., using the computer with the traditional input devices (mouse and keyboard) and the Internet (Rocha 2014). Regarding their intellectual disabilities, the individuals were not associated to only one pathology, but a group of pathologies (for example, fetal alcohol syndrome with dysgraphia). According to DSM V, these pathologies can be classified according to severity levels, between mild to moderate, but only one of the participants presented a high level of disability (APA 2013). Also within the group, fourteen participants had normal vision and six have corrected to normal vision.
All participants were volunteers and had permission of their parents or tutors to perform the tests.
3.3 Experimental Design
In order to assess the usability of the two input devices (touch screen and mouse), we observed the participants performing two painting tasks using the selection movement. They had to (1) select the intended colour and (2) select the area of the drawing they wanted to tint, resorting to only two touches or clicks, depending on the input device used. We tested this selection task because it is one of the most important interaction activities used in a digital environment: like selecting and activating links and buttons. With a normal website it would be difficult to observe and analyse the different errors made by the users, possibly due to potential inaccessible contents and not because of the interaction mode. In this regard, we chose a favourite activity.
Thus, the group was asked to perform two tasks:
- T1: selecting a colour and respective area of the drawing to paint by using the mouse. - T2: selecting a colour and respective area of the drawing to paint by using the touch screen.
They had to select the desired colours and select the drawing area they wanted to tint. The drawings were very similar in what concerns the size of the areas to tint and the number of clicks/touches necessary to complete the task. To correctly complete the activity all users had to make exactly 10 clicks or touch movements to paint all of the white drawing spaces.
Regarding the assessment criteria, we followed the variables of usability evaluation (effectiveness, efficiency and satisfaction) to assess user performance and experience. As for effectiveness, we registered how many participants performed the tasks without giving up. In efficiency, we registered resources spent to achieve effectiveness: time to perform the task; errors made during the interaction with the Web application or with the input devices (specifically: clicking in other hyperlinks besides the ones required to perform the task; continuously pressing a specific area, as the background or the colours area; and confusing mouse buttons as clicking on the left button to correctly control the mouse, instead of clicking on the right one); and difficulties observed, such as low precision when clicking on small drawing areas, the comprehension of the tasks, and touch screen/mouse handling. To record satisfaction, we observed if the participants showed comfort when performing the tasks or if they accepted the task, and if they asked to repeat the tasks.
3.4 Apparatus
The following material resources were used: a computer (Asus X552C), a touch screen Dell Multi Touch Monitor 54.6cm (21.5'' inches display), and a Logitech M100 optical mouse. Note that the user was seated at a distance not superior to one meter of the touch screen. For the tasks we used the Windows 8 app
Softonic 2015).
To ensure that the only difference of the tests was the interaction device, a portable computer was linked to the screen, having this equipment only the duty of running the application and display it on the same screen for both tasks. The user interaction movements necessary for these painting tasks were: touch the intended colour and then the respective drawing area using the touch screen; or click the intended colour using the left mouse button, move the mouse to the area of the drawing they wanted to tint and then click the left mouse button again. To successfully conclude the two tasks, users had to colour the drawings. All observations were registered on video.
3.5 Procedures
Participants were seated correctly in front of the screen in a controlled environment. After we explained the applicatio
and how to delete them) they started the activity. The order of both input devices used and the two displayed drawings was randomly assigned. After explaining the task (in order to paint one must select the colour and then click/touch the intended drawing area), the evaluator/observer did not further help the participant.
3.6 Results and Discussion
In this section the results regarding effectiveness, efficiency and satisfaction are presented and analyzed accordingly.
Regarding effectiveness (performing the tasks without giving up) all participants completed the tasks with both input devices. However we noticed that when using the touch screen input device, they never left blank spaces. On the other hand, sixteen users left two or three blank spaces (80%) when using the mouse and only four users painted all spaces of the drawing (20%).
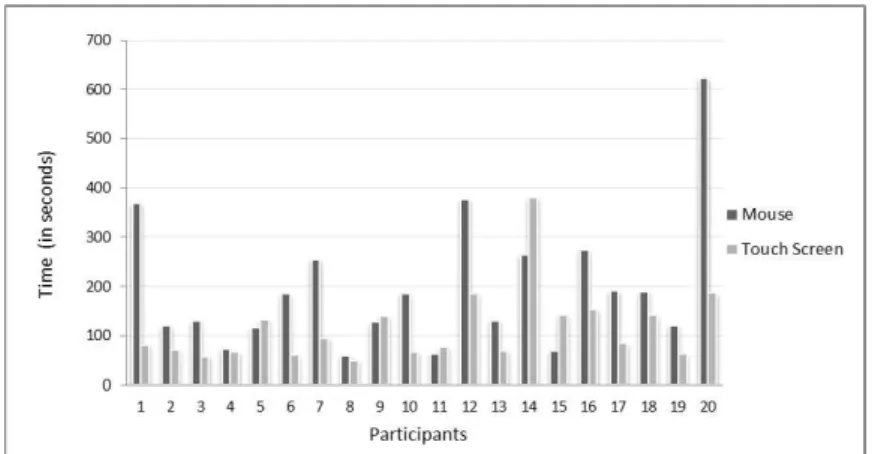
Secondly, we analysed efficiency (resources spent: time to conclude the task, errors made and difficulties observed). We detected the presence of an outlier per input device on the values regarding time spent to complete the tasks and thus these results were removed in order to prevent distortion of estimates in the statistical analysis. We followed the outlier labeling rule for this analysis (Beyer &Tukey 1981). In figure 1, we present time spent by users in the execution of the tasks with the two input devices, including the values referent to the outliers so that the visualization of the data is more coherent. The IDs numbered in this figure do not represent the real order of the participant tasks performance.
Figure 1. Time spent by users in the execution of the tasks with the two input device
Fifteen users spent more time completing the task with the mouse device and only five (ID 5, 9, 11, 14 and 15) took more time with the touch screen. Specifically, the fastest participant spent 50 seconds with the touch screen and 60 with the mouse. The slowest spent approximately 187 seconds with the touch screen and 623 seconds with the mouse (436 seconds). The mean and standard deviation of the time spent to perform the task is presented in figure 2.
Figure 2. Boxplot with mean of the time spent to perform the task
Here we can see that for the mouse device the mean time taken to finish the task was 196 seconds with a standard deviation of 137 seconds. Regarding the touch screen, the mean has 115 seconds with a standard deviation of 76 seconds. As our sample data was small, we assessed the normality of data with the Shapiro-Wilk Test in order to understand if the data was normally distributed. Indeed, the data was not normally distributed across the participants (p = .000) and we thus performed a non-parametric Wilcoxon Signed-Rank test to understand if the devices present significantly different results in terms of time spent.
There was a statistically significant difference between the use of each device. In this regard, this group revealed less time spent using the touch screen, with a median efficiency rating of 81.00, while the mouse had a median efficiency rating of 130.00, being this difference significant (Z = -2.766, p = .006). We also observed that 14 participants had a higher efficiency levels when using the touch screen (with a mean rank of 10.64), as opposed to only 4 participants that showed less time spent using the mouse as the input device to complete the tasks (with a mean rank of 5.50).
Despite the obtained results being somehow expected, we did not foresee that differences in performance were so unlike (because users work with the mouse input device in a daily basis). Specifically, by analysing figure 1 and 2 regarding time spent by the participants to conclude the task with both input devices, we can undoubtedly see that participants took less time using the touch screen when compared with the mouse, and we noticed only five participants spent more time concluding the tasks with the touch screen. This happened interaction paradigm and application.
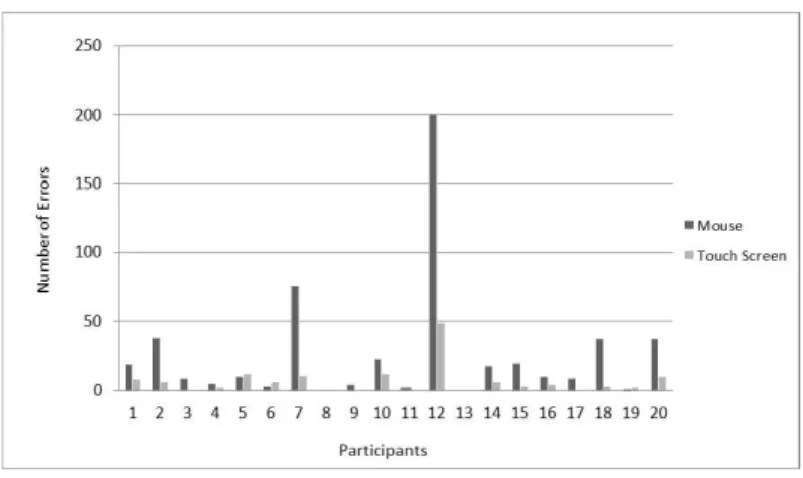
Figure 3. Number observed errors per participant
Figure 3 presents the errors registered during the experiment. In total, we registered 134 errors with the touch screen input device and 521 with the mouse.
Globally, two participants managed to execute the two tasks, with both devices, without presenting any errors. Three users made errors with the mouse device but not with the touch screen. Fifteen users presented more errors with the mouse input device and only three made more errors with the touch screen than with mouse. Regarding these three users, it was register through observation notes and video analysis that errors unrelated to the task.
Specifically, for the three types of errors registered: the first type of error (clicking in other hyperlinks besides the ones required to perform the task) was made by six participants with the touch screen and seven with mouse; the second (continuously pressing a specific area, such as: background or colours area) was made by thirteen participants with the mouse and no one with the touch screen; and the third (confusing mouse buttons, i.e. instead clicking on the left button to correctly control the mouse, they clicked on the right one), nine participants who confused the mouse buttons.
Next we present the mean of the errors made per device (figure 4).
Figure 4. Boxplot with the mean of error per device
On average, 26 errors were made when using the mouse input device and on the other hand, with the touch screen input device were made approximately 7 (6.7) errors.
In order to understand if the number of errors significantly differed from both the devices, we performed the Wilcoxon Signed-Rank test. There was, indeed, a statistically significant difference between the errors committed with each device (Z = -3.333, p = .001). Median error rating was 10.00 for the mouse input device and 3.50 for the touch screen.
Regarding
daily experience with this input device). They clicked several times on both buttons or frequently clicked on right button to select colours (they had to use only the left one), and thus increasing the conclusion time of the task. Another observation registered was on mouse handling: when they moved the mouse very rapidly or
very slowly, the cursor disappeared from the monitor, causing confusion and frustration (they did a lot of comments about this fact). This control and handling difficulties decreased their motivation to correctly complete the task and even increased their frustration. As such, sixteen participants did not paint all blank spaces of the drawing. Also it was observed that one participant had low precision when clicking on small drawing areas with both devices.
Finally, regarding satisfaction (comfort and acceptance of the work within the system) we observed that users liked to interact more with the touch screen device: they frequently smiled during interaction and no one finished the task with blank drawing spaces. At the end of the experiment eighteen users asked if they could repeat the task with the touch screen: they performed a second drawing with the touch screen and even experimented other tools of the software that we did not present in the beginning of the activity, like: experimenting with different crayons, using the rubber, and painting with the dragging movement instead of a single selection. None of the participants asked to perform another task using the mouse. It is worth noting that tasks were performed randomly, yet participants asked to interact with the touch screen regardless of the order of the task.
4. CONCLUSION
In terms of effectiveness, efficiency and user satisfaction, the results obtained suggest that the touch screen is more indicated for this group of people with intellectual disabilities. It was registered through observation notes and video, and also verified through statistical analysis, that users required less time to complete the task, made fewer errors and expressed more satisfaction when using the touch screen device. In general, users presented a worse performance when using the mouse input device (i.e. take more time to conclude the task), made more errors and showed more difficulties in controlling and handling t
daily experience with this input device), when compared with the touch screen. The results showed that indeed the difference between efficiency and error rate of both devices is statistically significant. All these facts may have actually decreased their satisfaction with the mouse device, as supported by the acknowledgement that no users asked to repeat the task with the mouse.
On the other hand, the fact that some participants, when using the touch screen, asked to repeat the task, tinted all blank spaces and showed motivation to explore other functionalities of the application may indicate that this device can indeed increase motivation.
The global results indicated that the mouse may not be considered as an unusable input device, but the touch screen could actually enhance their performance, motivation and satisfaction. Also, the autonomy may be increased for people with intellectual disabilities using digital platforms, thus diminishing the digital gap and promoting E-Inclusion for this group of people.
Finally, the low rate of dropouts (no one quit the task or refused to perform it) showed that participants had motivation to interact with digital environments.
As future work we intend to extend the results to other elemental interaction tasks besides selection, as manipulation / navigation and insertion tasks. Also, we propose to work with other groups with intellectual disabilities and with different levels of disability, as severe to profound, in order to replicate these results.
ACKNOWLEDGEMENT
We thank all people who directly or indirectly helped in this study.
REFERENCES
APA-American Psychological Association, 2013. DSM-V- The Diagnostic and Statistical Manual of Mental Disorders, 5th ed. Available: http://www.dsm5.org/Pages/Default.aspx.
Beyer, H. and Tukey, J., 1981. Exploratory Data Analysis. Biometrical Journal. Addison-Wesley Publishing Company Reading, Mass. Menlo Park, Cal., London, Amsterdam, Don Mills, Ontario, Sydney 1977, XVI, 688 S., Vol. 23, No 4, pp. 413 414. Doi=10.1002/bimj.4710230408.
Blake, J., 2012. The natural user interface revolution. Natural User Interfaces in .NET. Manning Publications Co. pp. 1 43.
Carvalho D., Bessa, M. and Magalhães, L., 2014. Different interaction paradigms for different user groups: an evaluation regarding content selection. In Proceedings of the XV International Conference on Human Computer Interaction (Interacción'14). ACM, New York, NY, USA, Article 40, 6 pages. DOI=10.1145/2662253.2662293 Available: http://doi.acm.org/10.1145/2662253.2662293
Foley, J. D., Wallace, V. L. and Chan, P., 1984.The human factors of computer graphics interaction techniques. In IEEE Computer Graphics and Applications, Vol. 4, No 11, pp. 13 48. Doi=10.1109/MCG.1984.6429355.
Harrysson, B., Svensk, A., Johansson, G.: How People with Developmental Disabilities Navigate the Internet. British Journal of Special Education, vol. 31(3), p.138-142. (2004).
Hix, D. and Hartson H.R., 1999. Developing user interfaces: ensuring usability through products and process. John Wiley & Sons. New York, USA.
ISO-International Organization for Standardization, 1997. ISO 9241-11: Ergonomic requirements for office work with visual display terminals (VDTs), Part 11 Guidelines for specifying and measuring usability. Geneva.
Karat, C., Campbell R. and Fiegel, T., 1992. Comparison of empirical testing and walkthrough methods in users interface evaluation. In Proceedin . California, Monterey, pp. 397-404.
Karoulis, A., Sylaiou, S. and White, M., 2006. Usability evaluation of Virtual Museum Interface. Informatica, Vol.17, No 3, pp.363-380.
Kin, K., Agrawala, M. and DeRose, T., 2009. Determining the benefits of direct-touch, bimanual, and multifinger input on a multitouch workstation. In GI '09 Proceedings of Graphics Interface 2009. Toronto, Canada, pp. 119 124. Law, L., Hvannberg, E., 2002. Complementarity and Convergence of Heuristic Evaluation and Usability Test: A Case
Study of UNIVERSAL Brokerage Platform. In Proceedings of 2nd Nordic Conference on Human-Computer Aarhus, Denmark. New York, ACM, pp. 71-80.
Mayer, R.E. and Moreno, R. N., 2003. Ways to Reduce Cognitive Load in Multimedia Learning. In Educational Psychologist, Vol. 38, No 1, pp. 43 52.
Opitz, C., 2003. The effects of implementing Web accessibility standards on the success of secondary adolescents with learning disabilities. Arizona State University, EUA. Avilable: http://worldcat.org/oclc/55135520.
Prates, R., Barbosa, S., 2003. User Interfaces assessment - Concepts and Methods. Avaliação de Interfaces de Usuário Conceitos e Métodos. In Anais do XXIII Congresso Nacional da Sociedade Brasileira de Computação. XXII Jornadas de Actualização em Informática (JAI).
Preece, J., Rogers, Y., Sharp, H., Benyon, D., Holland, S. and Carey, T., 1994. Human-Computer Interaction. Addison-Wesley Publ. London, England.
Riga Ministerial Declaration, 2006. Available: http://ec.europa.eu/information_society/activities/ict_psp/documents/declaration_riga.pdf.
Rocha T., 2008. Accessibility and Usability on the Internet for People with Intellectual Disabilities. Master degree. University of Trás-os- Montes and Alto Douro, Vila Real, Portugal.
Rocha, T., Bessa, M., Gonçalves, M., Cabral, L., Godinho, F., Peres, E., Reis, M., Magalhães, L., Chalmers, A., 2012. The Recognition of Web Pages' Hyperlinks by People with Intellectual Disabilities: An Evaluation Study. Journal of Applied Research in Intellectual Disabilities, Vol. 25, No 6, pp. 542 - 552. DOI: 10.1111/j.1468-3148.2012.00700.x Rocha T., 2014. Interaction metaphor for Access to Digital Information an autonomous form for People with Intellectual
Disabilities. Ph. D Thesis. University of Trás-os-Montes e Alto Douro Vila Real.
Roh, S., 2004. Designing accessible Web-based instruction for all learners: Perspectives of students with disabilities and Web-based instructional personnel in higher education. Doctoral dissertation, Indiana University, USA. Available:
http://mutex.gmu.edu:2068/pqdweb?did=828407271&sid=3&Fmt=2&clientId=31810&RQT=309&VName=PQD. Small, J., Schallau, P., Brown, K., Ettinger, D., Blanchard, S., Krahn, G., 2005. Web Accessibility for People with
Cognitive Disabilities. In Resna Procedings.
Steed, A. and Tromp, J., 1998. Experiences with the evaluating of CVE aplicattions. In Proceedings of Collaborative Virtual Environments. Manchester, UK.
Softonic, [online]. Available: http://apps.microsoft.com/windows/pt-pt/app/gs-kids-paint-learn/85eac273-f6de-4936-a94c-50596d7eb631
UN-United Nations, 2006. Rights of Persons with Disabilities Convention. Available: http://www.un.org/disabilities/convention/conventionfull.shtml or http://www.ulbra.br/acessibilidade/onu-2006.htm. WHO-World Health Organization, 2009. IFC-International Classification of Functioning, Disability and Health.