I
The
per
formance
o
f
Portuguese
banks
under
Base
l
I
I
I:
how
have
the
new
cap
ita
l
requ
irements
impact
ed
the
pro
f
itab
i
l
ity
o
f
Portuguese
banks?
F
i
l
ipe
Ferre
ira
dos
Santos
D
issertat
ion
wr
itten
under
the
superv
is
ion
o
f
Pro
fessor
D
iptes
Chandrakante
Prabhudas
Bh
im
jee
D
issertat
ion
subm
itted
in
part
ia
l
fu
l
f
i
lment
o
f
the
requ
irements
for
the
MSc
in
F
inance,
at
the
Un
ivers
idade
Cató
l
ica
Portuguesa
,
January
2018
.
III
The performance of Portuguese banks under Basel III: How have the new
capital requirements impacted the profitability of Portuguese banks?
Abstract
This Dissertation analyzes how the new capital requirements imposed by Basel III framework affected the profitability of Portuguese banks, during and after the Global Financial Crisis (GFC). The present Dissertation employs the Multiple Regression analysis to study how Common Equity Tier 1, Tier 1 and Total Capital movements, could affect the Return on Equity and Return on Assets of Portuguese banks. This research collected some relevant empirical findings from the estimated regressions. This research’s findings suggest that there is a negative relationship between Common Equity Tier 1 and Return on Equity, and that Tier 1 and Total Capital contributes positively to the increase of profitability. Moreover, Common Equity Tier 1 presents coefficients with higher magnitude comparing with the other capital ratios, having a greater impact on Portuguese banks’ profitability. Finally, higher capital ratios affect the credit channel in the Portuguese banking sector and could impact the profitability of Portuguese banks.
Esta Dissertação analisa a forma como os novos requisitos de capital impostos pelo acordo de Basileia III afetaram a rentabilidade dos bancos portugueses, durante e após a Crise Financeira Global. A presente Dissertação desenvolve uma análise de Regressão Múltipla para averiguar como os movimentos no Common Equity Tier 1, Tier 1 e Total Capital puderam afetar o retorno sobre o patrimonio líquido e o retorno sobre os ativos dos bancos Portugueses. Esta Dissertação alcançou vários resultados empíricos relevantes, com base nas regressões estimadas. Esta Dissertação conclui que existe uma relação negativa entre o Common Equity Tier 1 e o retorno sobre o patrimonio líquido, bem como que o Tier 1 e o Total Capital contribuem positivamente para o aumento da rentabilidade. Além disso, o Common Equity Tier 1 apresenta coeficientes com maior magnitude em comparação com os outros rácios de capital, tendo maior impacto sobre a rentabilidade. Finalmente, o aumento dos rácios de capital afetam o canal de crédito no setor bancário nacional e podem afetar a rentabilidade dos bancos portugueses.
JEL Classification: C1; E5; F0; G2
Key words: Basel III, Capital Requirements, Banking, Portuguese Banks, Bank Profitability, Finance Filipe Ferreira dos Santos
V
Acknowledgements
I would like to thank my Dissertation Advisor Diptes Bhimjee for his guidance and support throughout the period of research and writing of the present Dissertation.
Special thank you to my girlfriend, Inês Clemente, for encouraging me to achieve my goals and for always being by my side. Also, my sincere thanks to my best friends Bernardo Domingues, Gonçalo Torgal, Marcelo Carvalho, and Nuno Santos who are always present in the most important moments, despite geographical distances.
Last but not the least, a very special thank you to my Family for their unconditional love and support. This Dissertation is dedicated to them as a sign of gratitude.
VII
Table of Contents
Abstract ... III Acknowledgements ... V List of Acronyms ... IX List of Tables ... XI List of Figures ... XIII1. Introduction ... 1
2. Contextualization Chapter... 3
3. Literature Review ... 9
4. Methodology & Data ... 13
5. Empirical Findings ... 21
6. Conclusion ... 37
References ... 39
IX
List of Acronyms
APB – Associação Portuguesa de Bancos
BCBS – Basel Committee on Banking Supervision BCP – Banco Comercial Português
BIS – Bank for International Settlements BP - Breusch-Pagan (test)
BPI – Banco Português de Investimento CGD – Caixa Geral de Depósitos CRD – Capital Requirements Directive CTIER1 – Common Equity Tier 1 Capital EAD – Exposure at Default
EU – European Union
FED – Federal Reserve System GFC – Global Financial Crisis HHI - Herfindahl-Hirschman index NPL – Non-Performing Loans ROA – Return on Assets ROE – Return on Equity RWA – Risk Weighted Assets TC – Total Capital
XI
List of Tables
Table 1 - Capital Requirements imposed by Basel II and Basel III ... 4
Table 2 - Herfindahl-Hirschman Index (HHI) for the 5 Portuguese banks since 2009 until 2016 ... 8
Table 3 - Variables of the regression ... 13
Table 4 - Common Equity Tier 1 descriptive statistics for the different banks ... 15
Table 5 - Common Equity Tier 1 correlation matrix ... 15
Table 6 - Tier 1 capital descriptive statistics for the different banks ... 16
Table 7 - Tier 1 correlation matrix ... 16
Table 8 - Total Capital descriptive statistics for the different banks ... 16
Table 9 - Total Capital correlation matrix ... 17
Table 10 - Return on Assets (ROA) descriptive statistics for the different banks ... 18
Table 11 - Return on Equity (ROE) descriptive statistics for the different banks ... 18
Table 12 - Source and time window of the variables used in this study ... 19
Table 13 - Capital Reforms implementation timetable imposed by Bank for International Settlements ... 21
Table 14 - Regression (9) between ROA, Common Equity Tier 1, and Tier 1 capital for Millennium BCP ... 22
Table 15 - Regression (10) between ROE, Common Equity Tier 1, and Tier 1 capital for Millennium BCP ... 23
Table 16 - Regression (13) between ROE, Common Equity Tier 1, and Tier 1 capital for Banco Português de Investimento ... 26
Table 17 - Regression (14) between ROE and Common Equity Tier 1 and Total capital for Santander Totta ... 28
Table 18 - Regression (15) between ROE, Tier 1, and Total capital for Montepio ... 30
Table 19 - Regression between ROA, Common Equity Tier 1, and Tier 1 Capital for Caixa Geral de Depósitos ... 32
Table 20 - Regression between ROE, Common Equity Tier 1, and Tier 1 Capital for Caixa Geral de Depósitos ... 32
Table 21 - Non-Performing Loans to Total gross loans ... 47
Table 22 - Regression between ROA, Common Equity Tier 1, Tier 1, and Total Capital for Millennium BCP ... 48
Table 23 - Regression between ROE, Common Equity Tier 1, Tier 1, and Total Capital for Millennium BCP ... 48
Table 24 - Regression between ROA, Common Equity Tier 1, Tier 1, and Total Capital for BPI ... 48
Table 25 - Regression between ROE, Common Equity Tier 1, Tier 1, and Total Capital for BPI ... 49
Table 26 - Regression between ROA, Common Equity Tier 1, Tier 1, and Total Capital for Santander Totta ... 49
Table 27 - Regression between ROE, Common Equity Tier 1, Tier 1, and Total Capital for Santander Totta ... 49
Table 28 - Regression between ROA, Common Equity Tier 1, Tier 1, and Total Capital for Montepio ... 50
Table 29 - Regression between ROE, Common Equity Tier 1, Tier 1, and Total Capital for Montepio ... 50
Table 30 - Regression between ROA, Common Equity Tier 1, Tier 1, and Total Capital for CGD .... 50
XIII
List of Figures
Figure 1 - Amount of assets per bank as a percentage of total assets. ... 5
Figure 2 - Amount of Loans to customers per bank as a percentage of total loans. ... 6
Figure 3 - Amount of Deposits per bank as a percentage of total deposits. ... 6
Figure 4 - Scatter plot between Millennium BCP ROE and CTIER1 ... 24
Figure 5 - Scatter plot between BPI ROE and TIER1 ... 27
Figure 6 - Scatter plot between Santander Totta ROE and CTIER1 ... 29
Figure 7 - Scatter plot between Montepio ROE and Total Capital ... 31
Figure 8 - Scatter plot between CGD ROE and CTIER1... 33
Figure 9 - Scatter plot between CGD ROE and TIER1 ... 33
Figure 10 - Non-Performing Loans to Total gross loans ... 35
Figure 11 - Scatter plot between Millennium BCP ROA and CTIER1 ... 43
Figure 12 - Scatter plot between Millennium BCP ROA and TIER1 ... 44
Figure 13 - Scatter plot between Millennium BCP ROE and TIER1 ... 44
Figure 14 - Scatter plot between BPI ROE and CTIER1 ... 45
Figure 15 - Scatter plot between Santander Totta ROE and Total Capital ... 45
Figure 16 - Scatter plot between Montepio ROE and TIER1 ... 46
Figure 17 - Scatter plot between CGD ROA and CTIER1 ... 46
1
1. Introduction
Growth and profitability are the goals of every financial institution. However, with the increasing pace of regulatory change, the renewed regulatory vigilance and higher stakeholder expectations in a post-crisis environment, it becomes even harder for banks to be profitable. One of the involvements of the Bank for International Settlements (BIS) after the Global Financial Crisis (GFC) - due to the severity of international financial contagion processes in financial institutions that ultimately affected the global economy - was the Basel III framework. According to BIS (2011), “the objective of the reforms is to improve the banking sector’s ability to absorb shocks arising from financial and economic stress, whatever the source, thus reducing the risk of spill over from the financial sector to the real economy”(BIS, 2010: p.1). The aim of this Dissertation is to study how the new capital requirements imposed by the BIS could affect the profitability of major Portuguese banks. Regarding the capital requirements, this Dissertation will focus on the Common Equity Tier 1 Capital, the Tier 1 Capital and Total Capital. In relation to Portuguese banks, this research focuses on the impact of those new capital requirements on five (5) major banks: Caixa Geral de Depósitos, Santander Totta, Banco Português de Investimentos, Millennium BCP and Montepio. This is a very important research topic for four main reasons. First, it is an excellent opportunity to find what is the performance of profitability metrics (namely, the ROE and ROA) of the Portuguese banks. Second, to address the recent shocks in the Portuguese economy, (for instance, the sovereign debt crisis), which resulted in the increasing of regulatory compliance due to the Global Financial Crisis and the numerous recapitalizations and resolutions in the banking sector. Third, to address and increase the relevant literature about this academic research topic for financial institutions, because there is a lack of literature about this academic research topic at an empirical level, more precisely on the Portuguese banking sector. Fourth, considering that banks must comply with these new requirements, it is crucial to understand how those increases on capital could affect their business activities, and how they can make the most of those requirements, especially in the context of a more invigorated financial stability framework. The academic literature has mainly focused on the origins of the Global Financial Crisis of 2008 and on the reasons, that led to the implementation of Basel III. Also, how the increasing levels of regulation could prevent future crises, protect society, and make financial institutions grow safely by being more prepared against economic shocks. There is some academic
2
literature concerning the impacts of increasing regulation on banks’ performance and how they have adjusted to the new capital ratios, which have suffered a huge transformation since the beginning of Basel III implementation. Some literature about loan supply in the European markets, and how the lending rates will fluctuate under Basel III framework is also observed. The present Dissertation employs Multiple Regression analysis to study how capital movements could affect the profitability of Portuguese banks. The data used in this Dissertation were taken from banks’ balance sheet through a time window from 2007 to 2016. The variables used to compute the regression analysis could be divided in two types, the dependent variables and the independent variables. The former includes the profitability indicators, more precisely, the ROE and ROA. While the latter includes the Common Equity Tier 1, Tier 1 Capital and Total Capital.
Regarding the empirical findings, the present Dissertation suggests that high capital levels on banks’ balance sheets contribute to the decreasing of the credit channel in the banking sector. The amount of loans will decrease, due to the impact on the credit channel, and the number of defaults by customers will increase substantially. The Non-Performing Loans will maintain their growth tendency demonstrated since 2006 and consequently increase banks’ provisions. Also, according to the estimated regressions, the Common Equity Tier 1 has a strong negative impact on the profitability of Santander, Millennium BCP and BPI. Overall, it is possible to conclude that there is a negative relationship between the increased capital requirements and profitability.
Following this brief overview about the present Dissertation, the contextualizing chapter (Section 2) pays attention to the Global Financial Crisis. Also, it provides a general overview of the Basel III framework and describes the evolution of the banking sector in Portugal. Section 3 addresses the relevant literature review. Section 4 focuses on the methodology and data used to compute the regressions, with the main goal of achieving relevant empirical results. Section 5 presents the Dissertation’s empirical findings. This chapter describes the main findings and provide the explanations for the profitability performance in the banking sector. Finally, section 6 presents the main conclusions with a detailed summary of the topics addressed by this fundamental academic research question.
3
2. Contextualization Chapter
The Global Financial Crisis is essentially associated with the “deflating of a speculative bubble in the housing market that began in the United States in 2006 and has now cascaded across many other countries in the form of financial failures and a global credit crunch”(Shiller, 2008: p.9).
Bessis (2015) states that “in the United States, after assisting in the bail-out of some large financial firms, the financial authorities let Lehman Brothers down in 2008, [a moment] which is considered as the critical event in the development of the financial crisis.” (Bessis, 2015: p.14). With this, a very important question arises, namely, what were the main determinants leading to the Global Financial Crisis?
Hull (2009), defends that the lack of self-regulation revealed by financial institutions, the lax mortgage lending practices, the housing bubble created by the securitization process, and the inappropriate information provided by rating agencies, were the main reasons that led to the Global Financial Crisis.
The Global Financial Crisis started in the United States but soon spread worldwide, and Portugal was no exception. According to Saunders (2014), the European crisis was so deep that “the U.S. banks had sovereign risk exposure (…) to Portugal [which] totalled $47.1 billion.” (Saunders, 2014: P.62).
International financial contagion processes among financial institutions typically explain the propagation of the systemic shock throughout the global banking industry (Bhimjee, et al. 2016), leading to a global crisis that affected almost all economies on a global scale. (Bhimjee et al., 2013) further defends that the contagion process was the main determinant for the huge change in public debt levels of Euro Area Member States. Even the economies that were growing exponentially faced huge slowdowns: “China’s booming economy slowed more than had been predicted, from 10.1 percent in the second quarter of 2008 to 9 percent in the third quarter.” (Saunders, 2014: p.61).
Regarding the huge impact on the global economy due to the lack of regulation, and in order to control for inflation and to contribute to global financial stability, the Bank for International Settlements implemented the third framework of the Basel accord. These new regulatory efforts
4
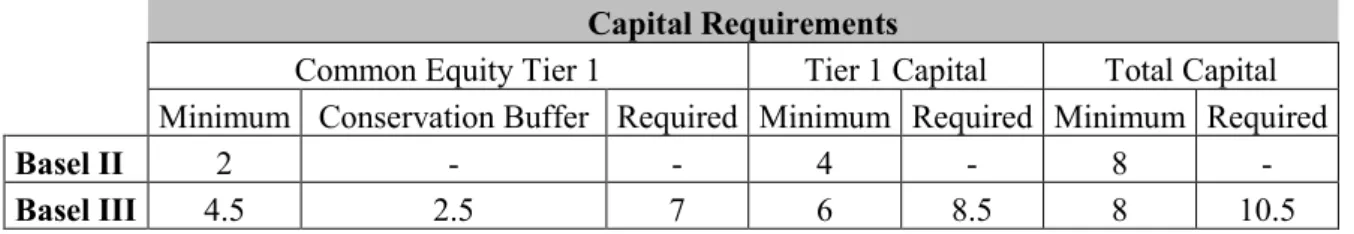
are aimed at strengthening banks’ capital framework, in comparison to the precepts established in Basel II, as can be observed in the following table:
Capital Requirements
Common Equity Tier 1 Tier 1 Capital Total Capital Minimum Conservation Buffer Required Minimum Required Minimum Required
Basel II 2 - - 4 - 8 -
Basel III 4.5 2.5 7 6 8.5 8 10.5
Table 1 - Capital Requirements imposed by Basel II and Basel III Source: Bank for International Settlements, 2010
In addition to the Risk Weighted Assets (RWA) requirements, there were structural changes in the capital requirements framework, namely, new capital definitions, new buffers, the implementation of the leverage ratio and the concept of systematic risk. One of the most important features of this deep regulatory change is the implementation of a conservation buffer of 2.5%. "If [bank] capital is high enough to absorb large losses, the banks would be safe. The size of the capital base depends on how much risk banks are taking.” (Bessis, 2015: p.14). But how could this new set of capital requirements contribute to the strengthening of the capital framework in the banking sector? What are the main goals of the Basel III framework? According to Basel Committee On Banking Supervision (2011), there are 5 specific goals that Basel III aims to achieve. The first goal is to increase the consistency, quality, and transparency of banks’ capital in order to guarantee that the financial institutions are prepared to absorb financial losses in the case an extreme financial event occurs. Secondly, it is important to strengthen the risk coverage of banks’ capital by safeguarding capital requirements against securitization processes, counterparty credit risk, banks exposures to central counterparties (CCPs), and counterparty credit risk exposures. Thirdly, the concept of leverage ratio was introduced as a supplementary measure to the Basel risk-based capital. The fourth goal passes through the implementation of countercyclical buffers which reduce the procyclicality of shocks in the banking system. Finally, the fifth goal addresses the implementation of some liquidity standards for banking institutions, for instance, the liquidity coverage ratio, the net stable funding ratio, and supervisory monitoring, in order to identify major disruptions in liquidity risks.
Accordingly, Portuguese banks were subject to these new requirements imposed by Basel III. However, the Portuguese banking sector was affected by the innumerable recapitalizations and resolutions after the financial crisis. For instance, 2012 was marked by the recapitalization of
5
Caixa Geral de Depósitos, Banco Português de Investimento, and Millennium BCP. Also, 2014 was marked by the intervention of 4.3 thousand million euros of public help with the creation of Novo Banco. Very recently, in 2017, the Millennium BCP increased its capital by 1.3 thousand million euros.
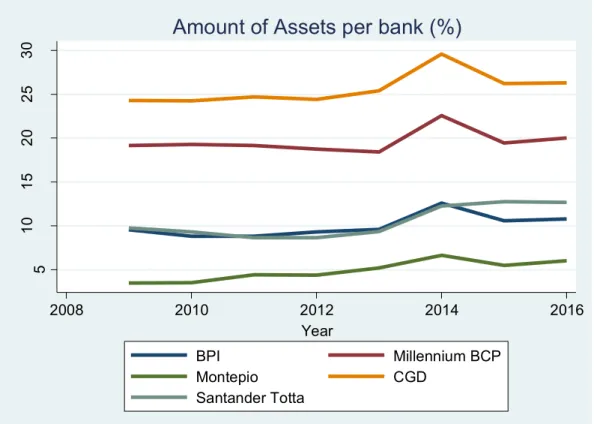
According to Associação Portuguesa de Bancos (2016), the Portuguese banking sector had an amount of €386 thousand million in total assets, collectively providing €234.6 thousand million in loans to their customers and receiving 245.4 thousand million euros in deposits from customers. Through the following Figures, it is possible to scrutinize the evolution of the amount of assets, credit, and deposits for the five (5) major Portuguese banks that are being addressed by the present Dissertation, for the time frame 2009 - 2016 (Figure 1 below).
Figure 1 - Amount of assets per bank as a percentage of total assets. Source of data: Associação Portuguesa de Bancos (2016)
30 25 20 15 10 5 Amo un t o f Asse ts pe r b an k (% ) 2008 2010 2012 2014 2016 Year BPI Millennium BCP Montepio CGD Santander Totta
6
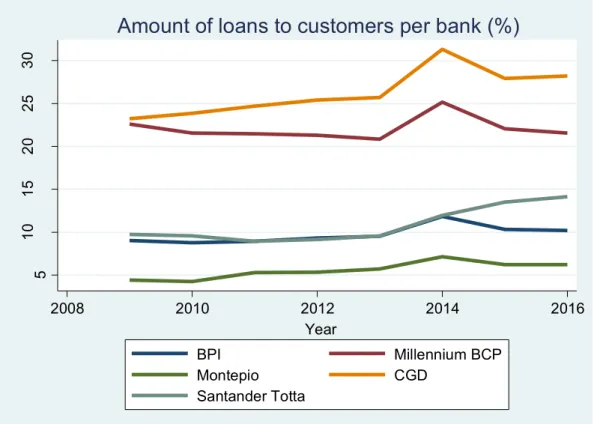
Figure 2 - Amount of Loans to customers per bank as a percentage of total loans. Source of data: Associação Portuguesa de Bancos (2016)
Figure 3 - Amount of Deposits per bank as a percentage of total deposits. Source of data: Associação Portuguesa de Bancos (2016)
30 25 20 15 10 5 Amo un t o f l oa ns to cu st ome rs pe r b an k (% ) 2008 2010 2012 2014 2016 Year BPI Millennium BCP Montepio CGD Santander Totta
Amount of loans to customers per bank (%)
40 30 20 10 0 Amo un t o f d ep osi ts pe r b an k (% ) 2008 2010 2012 2014 2016 Year BPI Millennium BCP Montepio CGD Santander Totta
7
Collectively, the said 5 major Portuguese banks hold 76% of the assets in the Portuguese banking sector, provide 80% of the loans and receive 81% of the deposits (values for the year 2016). It is important to mention that, in 2014, the Portuguese banking industry (as observed by the four major Portuguese financial institutions) increased the soundness of their financial indicators, because of the resolution of Banco Espirito Santo. Due to that event, the indicators referring to this bank were not incorporated in the total calculation of assets, credit, and deposits. There is a specific increase in the figures above for 2014 because, when calculating the credit, assets, and deposits for the Portuguese banking sector, Novo Banco was not incorporated in the estimations and for this reason, the share of these 5 banks is higher. Caixa Geral de Depósitos has always been the biggest bank in Portugal while Millennium BCP is the top private bank until 2016.
With that said, an important question arises: How are these indicators distributed by different banks, mainly the ones that are being addressed by the present Dissertation? According to Rhoades (1993), the Herfindahl-Hirschman Index (HHI) represents a statistical measure of concentration and measures the dimension of different financial institutions in relation to the industry, in this case, the banking industry. In order to analyse the behaviour of this index since the beginning of the financial crisis, the concentration levels of the credit, assets, and deposits
for the Portuguese banking sector were estimated, through the following formula1:
HHI = ∑n (𝑀𝑆𝑖)2
i=1 (1)
• n = number of banks
• MS = Market Share
• 𝑖 = Bank 𝑖
The formula above could be computed by squaring the Market Shares of the Portuguese banks and then summing the respective squares. The existence of monopoly power in the banking system will be expressed by an HHI equal to 1. The following table demonstrates the levels of this Index according to assets, credit, and deposits:
1 Bikker, J. A. and Haaf, K. (2002) Measures of Competition and Concentration in the Banking Industry: a Review of the Literature.
8
Herfindahl-Hirschman Index (HHI)
2009 2010 2011 2012 2013 2014 2015 2016 Assets 0.115 0.113 0.115 0.113 0.119 0.174 0.137 0.140 Credit 0.125 0.122 0.126 0.130 0.131 0.195 0.159 0.160 Deposits 0.156 0.143 0.147 0.151 0.146 0.206 0.173 0.173
Table 2 - Herfindahl-Hirschman Index (HHI) for the 5 Portuguese banks since 2009 until 2016 Source of data: Associação Portuguesa de Bancos (2016)
According to table 2, the HHI is considered to have a mild level of concentration, also, a growth trend in all indicators can be noted. For assets and credit, the Portuguese banking sector presents low levels of concentration, and for deposits, is considered to have a moderate concentration, insofar as, in most of the years, the value of the index is higher than 0.15. These findings might be attributed to the fact that Caixa Geral de Depósitos and Millennium BCP have received, during the 8 years associated with the time frame adopted by the present Dissertation, approximately 50% of the deposits made by customers.
The Portuguese banking sector has faced a severe financial crisis and has witnessed many changes in the sector. In addition, the Bank for International Settlements imposed new capital requirements for the Portuguese banks. The present Dissertation will analyse how those new capital requirements could affect the profitability of the Portuguese banking sector.
9
3. Literature Review
The main goal of the present chapter is to analyse the essential academic literature sources associated with the research topic addressing the BASEL III framework. The main goals of this Dissertation are: i) to understand what were the main reasons for the design and implementation of the BASEL III accord; and ii) how this accord could affect the performance of Portuguese banks, mainly where banks’ profitability is concerned. This chapter of the literature review is organized in descending order of importance.
According to Basel Committee On Banking Supervision (2011), the goal of the latest improvement on the Basel framework is to improve banks’ ability to absorb shocks arising from economic and financial stress and prevent future crises. This white paper presents the 5 goals of the Basel III framework, as well as the calculation method of Common Equity Tier 1 Capital, Tier 1 Capital, Total Capital and capital buffers, for instance, conservation and countercyclical buffer. However, there are several negative consequences associated with this new capital requirement framework.
First of all, it is very important to return to the origin of the problem that contributed to the implementation of this agreement, the credit crisis. Hull (2009) presents the main events that contributed to the credit crisis of 2007. This article focuses on the origins of the crisis and tries to demonstrate that the US housing market, the several levels of securitization, and the rating agencies were the main determinants for the U.S. subprime crisis. Hull (2009) concludes that the credit crisis could be explained by the very low interest rate environment (lax monetary policy) between 2002 and 2005, the relaxed lending standards and low risk aversion, as well as sophisticated financial innovation processes (as represented by the growing volume of the subprime mortgage lending). In addition, the author also states that to avoid future crises, the financial institutions should disincentive the compensation plans produced by short-term performance and increase the transparency of the financial products promoted by banks. Due to the lack of financial regulation demonstrated in the aftermath of the global financial crisis, the Bank for International Settlements, implemented the third regulatory framework of the Basel accords. This accord’s main goal is to reduce the probability and severity of future crises (BIS, 2011). Considering that the execution of BASEL III and the corresponding procedures must be fully implemented by the beginning of 2019, a very pertinent academic
10
research question arises: How do the new capital requirements imposed by the Basel III
framework affect the profitability of the Portuguese Banks?
Hannoun (2010) demonstrates how important the Basel III framework is to increase safety in the Banking sector, for instance, by emphasizing stress testing. Additionally, it describes how the new capital requirements imposed by Basel III will deeply strengthen the capital framework, when compared to the Basel II accord. Hannoun (2010) further observes that “Basel III not only enhances the microprudential framework for capital, but it also adds a macroprudential approach that is system-wide and systemic.” (Hannoun, 2010: p. 16). On another hand, Gavalas (2015) analyses how the new capital requirements imposed by Basel III could affect the loan growth and lending rates for European commercial banks. The article’s approach distinguishes between banks that faced the impact of a banking crisis and those that did not suffer from the severe crisis consequences. The paper uses multiple regression analysis to estimate the appropriate amount of capital that banks should hold and the corresponding level of suitable loan rates. Gavalas (2015) main findings suggest that banks who have experienced a crisis, such as the Portuguese banks, assuming a 1.3% increase in the equity-to-asset ratio in order to comply with Basel III requirements, will lead to a reduction of 4.97% in the volume of loans. The author also concludes that a 1% increase in the equity-to-asset ratio will contribute to a 0.05% average increase in the loan rate for banks.
The decreasing of the credit availability and higher lending rates could severely affect the Portuguese credit channel, and reduce economic activity. The increase of the capital ratios that Portuguese banks must have could have a negative impact, considering that the provision of loans constitutes banks’ most important activity and the latter’s major source of revenue. In the same line of reasoning, Cosimano and Hakura (2011) also study how the increase in capital requirements will lead to higher lending rates and slower loan growth in developed countries, such as Portugal. Similarly, the authors also found that on large banks, the lending rates increase 16 basis points to achieve the Bank for International Settlements’ capital requirements. Furthermore, according to the author’s estimations, the increasing on the capital conservation buffer by 2.5 percentage points are typically expected to reduce loans by 2.5%.
According to past literature, Lüders (2010) directly assesses the impact of Basel III on European banks by assuming the full implementation of Basel III requirements. They predict that the pre-tax Return on Equity of European banks may decrease by between 3.7 and 4.3 percentage points from the pre-crisis level of 15%. These authors also conclude that, in 2013,
11
the Return on Equity will decline by 0.3 pp and 2.1 pp on 2016 (on average). Taking into consideration the possible decrease in banking profitability as previously mentioned, (Allen et al., 2012) make an important analysis on how to deal with the pressure of regulators to meet the capital requirements, while, at the same time, meet the performance expectations of the banks’ shareholders. In order to prove this line of argumentation, these authors design and implement a model considering the Basel III regulatory weights and profitability ratios, in order to provide a combination that maximizes the wealth of shareholders and, at the same time, comply with the regulatory requirements. The authors argue that this new Basel framework will drastically increase the difficulty of bank management, in terms of liquidity and accessibility of credit. The authors also state that almost all banks are compliant under Basel II, but only a selection of banks will be able to comply with Basel III and compliance with the higher capital requests. These consequences might affect the performance of the Portuguese banking industry and its constituents, as several authors previously demonstrated.
With the aim of investigating the empirical results of the present Dissertation, the regression results will be based on Brooks (2008) and Gujarati (2011). The first author explains in a very theoretical way the econometric concepts from a financial perspective. While, on another hand, Gujarati (2011) makes very practical and detailed analysis of the outputs of econometric regressions.
This research will further clarify how Portuguese banks’ performance will be impacted by the full implementation of Basel III.
13
4. Methodology & Data
The present section analyses the empirical methodology deployed in the Dissertation, as well as the data used in support of the corresponding model applications.
The present research employs the Multiple Linear Regression (MLR) model in order to analyse how the movements of capital requirements imposed by Basel III impact the profitability of the following Portuguese banks: Banco Português de Investimento, Caixa Geral de Depósitos, Millennium BCP, Montepio and Santander Totta. This is an established quantitative technique that takes into account the potential impact of multiple explanatory variables on banks’ profitability metrics, through the estimation of econometric regressions. The general econometric specification of the econometric regression is expressed by:
• ROE 𝑖 = σ + β1 CTIER1 𝑖 + β2 TIER1 𝑖 + β3 Total Capital 𝑖 + u𝑖 (2)
• ROA 𝑖 = σ + β1 CTIER1 𝑖 + β2 TIER1 𝑖 + β3 Total Capital 𝑖 + u 𝑖 (3)
The ‘Return on Equity’ and ‘Return on Assets’ are the dependent variables, i.e., the variables that the present Dissertation wants to explain and critically analyse. On another hand, ‘Common Equity Tier 1 Capital’, ‘Tier 1 Capital’ and ‘Total Capital’ are the independent or explanatory variables, the variables that can explain the outcome variable. The ‘σ’ and ‘β’ are parameters to be estimated and ‘u’ is the error term.
The dependent and independent variables that will be used in the regression estimations are the following:
Dependent Variables Independent Variables
Return on Equity Common Equity Tier 1 Return on Assets Total Capital
14
Dependent Variables:
• Return on Equity (ROE): Hull (2009) defines this concept has a measure of financial
performance in the banking sector, which is computed by the division between the return expressed by the Net Income and the value of Shareholder’s Equity.
ROE = Net Income
Shareholder′s Equity (4)
• Return on Assets (ROA): According to Damodaran (2017) the ROA consists on the
Return produced by the existing assets. Basically, expresses how well banks are making profit from the capital that have invested.
ROA =EBIT∗(1−Tax Rate)
Total Assets (5)
Independent Variables:
• Tier 1 Capital: BIS (2005) defines this concept has the amount of regulatory capital that includes equity and retained earnings, and this capital must be at least 6.0% of a given financial institution’s Risk Weighted Assets (RWA).
• Common Equity Tier 1: According to BIS (2005) this ratio consists of the retained earnings and other reserves expressed in the balance sheets of the financial institutions. This must be at least 4.5% of Risk Weighted Assets.
• Total Capital: BIS (2005) defines this ratio has the Tier 1 capital plus Tier 2 Capital (essentially composed of subordinated debts). Must be at least 8.0% of Risk Weighted Assets.
Also, the Bank for International Settlement has also imposed a capital conservation buffer in order to protect the banking sector against economic shocks. For the calculation of those capital ratios presented above, is necessary to estimate the Risk Weighted Assets. According to BIS (2005), “total risk-weighted assets are determined by multiplying the capital requirements for market risk and operational risk by 12.5 (…) and adding the resulting figures to the sum of
15
risk-weighted assets for credit risk.” (BIS, 2005: p.12). The formula of the RWA could be expressed by:
• RWA = K x 12.5 x EAD (6)
Where K stands for the ‘capital requirement’ and EAD for ‘Exposure at Default’.
Summary statistics
• Independent Variables:
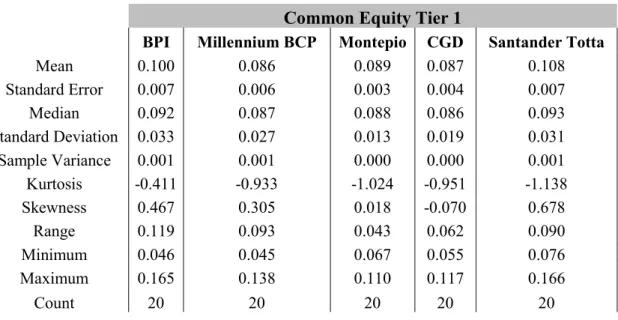
Common Equity Tier 1
BPI Millennium BCP Montepio CGD Santander Totta
Mean 0.100 0.086 0.089 0.087 0.108 Standard Error 0.007 0.006 0.003 0.004 0.007 Median 0.092 0.087 0.088 0.086 0.093 Standard Deviation 0.033 0.027 0.013 0.019 0.031 Sample Variance 0.001 0.001 0.000 0.000 0.001 Kurtosis -0.411 -0.933 -1.024 -0.951 -1.138 Skewness 0.467 0.305 0.018 -0.070 0.678 Range 0.119 0.093 0.043 0.062 0.090 Minimum 0.046 0.045 0.067 0.055 0.076 Maximum 0.165 0.138 0.110 0.117 0.166 Count 20 20 20 20 20
Table 4 - Common Equity Tier 1 descriptive statistics for the different banks
Common Equity Tier 1
BPI Millennium BCP Montepio CGD Santander Totta BPI 1
Millennium BCP 0.951 1
Montepio 0.584 0.474 1
CGD 0.643 0.599 0.371 1
Santander Totta 0.467 0.513 -0.251 0.331 1
16
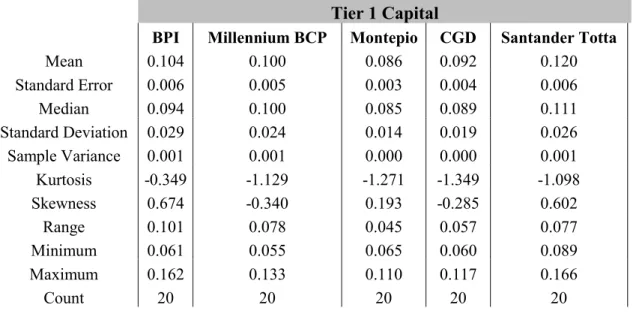
Tier 1 Capital
BPI Millennium BCP Montepio CGD Santander Totta
Mean 0.104 0.100 0.086 0.092 0.120 Standard Error 0.006 0.005 0.003 0.004 0.006 Median 0.094 0.100 0.085 0.089 0.111 Standard Deviation 0.029 0.024 0.014 0.019 0.026 Sample Variance 0.001 0.001 0.000 0.000 0.001 Kurtosis -0.349 -1.129 -1.271 -1.349 -1.098 Skewness 0.674 -0.340 0.193 -0.285 0.602 Range 0.101 0.078 0.045 0.057 0.077 Minimum 0.061 0.055 0.065 0.060 0.089 Maximum 0.162 0.133 0.110 0.117 0.166 Count 20 20 20 20 20
Table 6 - Tier 1 capital descriptive statistics for the different banks
Tier 1 Capital
BPI Millennium BCP Montepio CGD Santander Totta
BPI 1
Millennium BCP 0.762 1
Montepio 0.736 0.347 1
CGD 0.759 0.829 0.501 1
Santander Totta 0.442 0.774 -0.047 0.611 1
Table 7 - Tier 1 correlation matrix
Total Capital
BPI Millennium BCP Montepio CGD Santander Totta
Mean 0.115 0.120 0.108 0.119 0.125 Standard Error 0.005 0.004 0.005 0.003 0.005 Median 0.111 0.119 0.109 0.123 0.113 Standard Deviation 0.021 0.017 0.022 0.015 0.023 Sample Variance 0.000 0.000 0.000 0.000 0.001 Kurtosis 0.174 -1.441 -1.497 0.752 -0.729 Skewness 0.934 0.147 -0.160 -0.898 0.886 Range 0.077 0.051 0.064 0.057 0.065 Minimum 0.085 0.095 0.072 0.081 0.101 Maximum 0.162 0.146 0.136 0.138 0.166 Count 20 20 20 20 20
17
Total Capital
BPI Millennium BCP Montepio CGD Santander Totta BPI 1
Millennium BCP 0.479 1
Montepio 0.615 -0.146 1
CGD 0.504 0.380 0.469 1
Santander Totta -0.019 0.615 -0.599 -0.150 1
Table 9 - Total Capital correlation matrix
According to the summary statistics presented above, the standard deviation of the three (3) capital ratios in all banks is not very volatile against the mean. On average, Bank Santander Totta presents higher capital ratios, and Montepio presents the lowest ratios. Generically, where the Common Equity Tier 1 and Tier 1 Capital are concerned, Portuguese banks present a lower kurtosis, which means that there are few dispersed observations against the normal distribution. The skewness is negative in the three (3) capital ratios for Caixa Geral de Depósitos, which means that the observation accumulates on the peak’s left side. On average, Millennium BCP presented some difficulties in compliance with the Common Equity Tier 1 and Tier 1 Capital requirements. Through the correlation table, it is noteworthy to observe that the strong positive correlation on Tier 1 Capital and Common Equity Tier 1 Capital between Millennium BCP and BPI. This reflects the fact that, for instance, if the Common Equity Tier 1 of Millennium BCP increases, the Common Equity Tier 1 of the bank BPI will move in the same direction and vice-versa.
18
• Dependent variables:
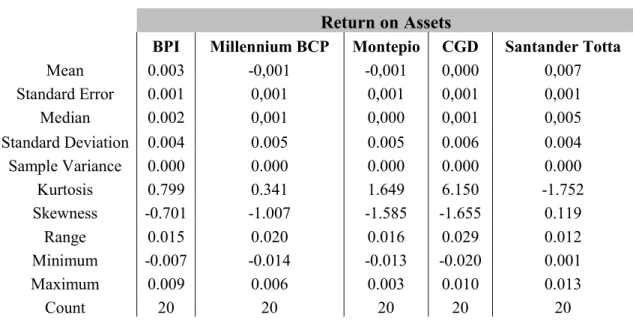
Return on Assets
BPI Millennium BCP Montepio CGD Santander Totta
Mean 0.003 -0,001 -0,001 0,000 0,007 Standard Error 0.001 0,001 0,001 0,001 0,001 Median 0.002 0,001 0,000 0,001 0,005 Standard Deviation 0.004 0.005 0.005 0.006 0.004 Sample Variance 0.000 0.000 0.000 0.000 0.000 Kurtosis 0.799 0.341 1.649 6.150 -1.752 Skewness -0.701 -1.007 -1.585 -1.655 0.119 Range 0.015 0.020 0.016 0.029 0.012 Minimum -0.007 -0.014 -0.013 -0.020 0.001 Maximum 0.009 0.006 0.003 0.010 0.013 Count 20 20 20 20 20
Table 10 - Return on Assets (ROA) descriptive statistics for the different banks
Return on Equity
BPI Millennium BCP Montepio CGD Santander Totta
Mean 0.050 -0.033 -0.018 -0.010 0.098 Standard Error 0.017 0.025 0.016 0.030 0.015 Median 0.051 0.015 0.006 0.011 0.083 Standard Deviation 0.076 0.110 0.071 0.132 0.068 Sample Variance 0.006 0.012 0.005 0.017 0.005 Kurtosis 1.714 0.665 1.298 8.634 -1.552 Skewness -0.295 -1.177 -1.489 -2.265 0.289 Range 0.363 0.427 0.233 0.665 0.204 Minimum -0.138 -0.305 -0.181 -0.479 0.012 Maximum 0.225 0.122 0.052 0.186 0.216 Count 20 20 20 20 20
Table 11 - Return on Equity (ROE) descriptive statistics for the different banks
According to the summary statistics on the Return on Equity (ROE) and Return on Assets (ROA), on average, BPI and Santander Totta are more profitable, having, on both ratios, a positive performance during the time window of this study (2007 to 2016). Caixa Geral de Depósitos is the bank that presents the highest volatility regarding the ROE and ROA indicators against their corresponding means. Also, Caixa Geral de Depósitos is the only bank that demonstrates a kurtosis much higher than 3, revealing that the sample has several extreme values. There is a high probability that Santander Totta presents a right-skewed distribution
19
and the other banks present a left-skewed distribution for both profitability ratios. Bank Santander Totta offers the highest return on assets and BPI the highest return on equity.
Data Source
Variables Time Window Source
Return on Equity 2007 - 2016 Associação Portuguesa de Bancos (APB) Return on Assets 2007 - 2016 Associação Portuguesa de Bancos (APB) Common Equity Tier 1 2007 - 2016 Thomson Reuters; Semestral Financial Reports
Tier 1 capital 2007 - 2016 Thomson Reuters; Semestral Financial Reports Total Capital 2007 - 2016 Thomson Reuters; Semestral Financial Reports
Table 12 - Source and time window of the variables used in this study
Table 12 (above-presented) provides information related to the source of the five (5) variables that have been used to study how the new capital requirements imposed by Basel III could affect the performance/profitability of Portuguese banks. Our Dissertation’s sample comprises the following Portuguese banks: Banco Português de Investimento, Caixa Geral de Depósitos, Millennium BCP, Montepio and Santander Totta. The time window adopted in this research is between 2007 and 2016, as this time frame is the most suitable window to study the effects of Basel III capital requirements, taking into account that the said BASEL III framework was developed in the aftermath of the global financial crisis of 2007-2008, as a measure intended to strength banks’ capital requirements, and in order to avoid the onset of future financial crises.
21
5. Empirical Findings
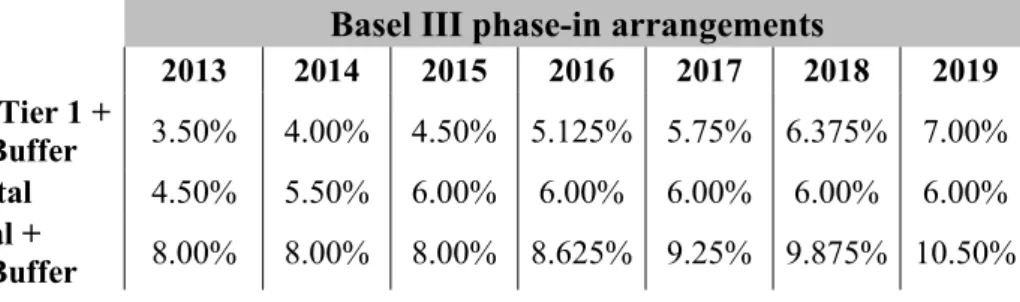
According to the European Parliament (2013), the Directive 2013/36/EU has implemented the new capital requirements framework to all financial institutions, the Capital Requirement Directive (CRD) IV, that consists on the Basel III framework. Those new capital requirements that the European banks must comply with consist of a gradual process of increasing banking capital until the full implementation of Basel III in 2019. The next table presents the Basel III phase-in arrangements:
Basel III phase-in arrangements
2013 2014 2015 2016 2017 2018 2019 Common Equity Tier 1 +
Conservation Buffer 3.50% 4.00% 4.50% 5.125% 5.75% 6.375% 7.00% Tier 1 Capital 4.50% 5.50% 6.00% 6.00% 6.00% 6.00% 6.00%
Total Capital +
Conservation Buffer 8.00% 8.00% 8.00% 8.625% 9.25% 9.875% 10.50%
Table 13 - Capital Reforms implementation timetable imposed by Bank for International Settlements Source: Basel Committee on Banking Supervision (2014)
This timely increase of banks’ capital requirements is very important for the financial institutions to avoid abrupt changes in their activities. Also, it is vital to prevent a huge shock in banks’ performance derived from the sudden increasing of capital on their balance sheets, and also by the sharp decrease on the credit channel.
With the aim of studying the relationship between the Core Tier 1, Tier 1, the Total Capital, and the Return on Equity, and Return on Assets of the Portuguese banks, some regressions addressing BASEL III’s impact on Portuguese banks’ have been estimated. The data for these variables were taken from the half-yearly financial reports of the five (5) most important Portuguese banks. The data range from 2007 up until 2016. The behaviour of the variables under study (ROE and ROA), the outcome/dependent variables, are explained by a function that contains independent variables. The regression estimations are linear functions of the independent variables and they were used in the following regression specifications, presented previously in the methodology and data chapter:
• ROE 𝑖 = σ + β1 CTIER1 𝑖 + β2 TIER1 𝑖 + β3 Total Capital 𝑖 + u 𝑖 (7)
22
After the regressions have been estimated, the most significant variables are maintained and the ones which were not so significant were excluded from the final results. That is, the present research design follows a two-step approach in the econometric estimations. The regressions with the variables that have been excluded are expressed in the appendix. The only exception is Caixa Geral de Depósitos in which the regression results were maintained although the variables were not statistically significant. Also, some graphs were computed to demonstrate the relationship between the dependent variable and the most significant independent variable for each bank. The graphs for the remaining variables are expressed in the appendix.
Millennium BCP
Banco Comercial Português, S.A. (Millennium BCP), is considered Portugal’s largest private bank when it comes to market share, having more than 2.3 million customers in multiple geographies. Founded in 1985 mainly due to the subtraction of regulations and expansion of the financial system the bank has nowadays approximately 15,000 employees and 1,000 branches. Starting with Millennium BCP, the following regressions were estimated:
• Millennium BCP Return on Assets = σ + β1 Common Equity Tier 1 Capital 𝑖 + β2
Tier 1 Capital 𝑖 + u 𝑖 (9)
• Millennium BCP Return on Equity = σ + β1 Common Equity Tier 1 Capital 𝑖 + β2
Tier 1 Capital 𝑖 + u 𝑖 (10) The outputs of the previous regressions are (respectively):
Regression Statistics Multiple R 0.801 R Square 0.642 Adj. R Square 0.600 Standard Error 0.003 F-test 0.000 BP test 0.405 Ramsey test 0.387 Observations 20
Coefficients Standard Error t Stat P-value Lower 95% Upper 95%
Intercept 0.01 0.003 2.569 0.020 0.001 0.015
CTIER1 -0.21 0.048 -4.346 0.000 -0.312 -0.108
TIER1 0.09 0.054 1.623 0.123 -0.026 0.203
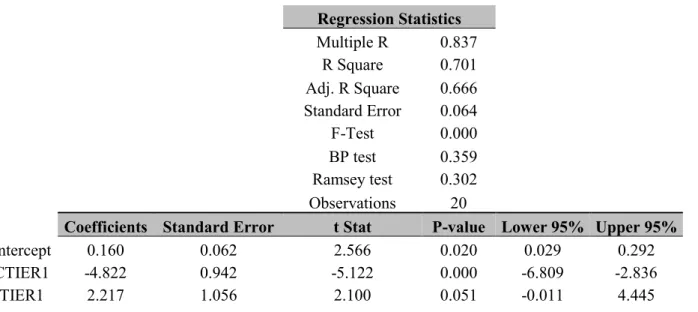
23 Regression Statistics Multiple R 0.837 R Square 0.701 Adj. R Square 0.666 Standard Error 0.064 F-Test 0.000 BP test 0.359 Ramsey test 0.302 Observations 20
Coefficients Standard Error t Stat P-value Lower 95% Upper 95%
Intercept 0.160 0.062 2.566 0.020 0.029 0.292
CTIER1 -4.822 0.942 -5.122 0.000 -6.809 -2.836
TIER1 2.217 1.056 2.100 0.051 -0.011 4.445
Table 15 - Regression (10) between ROE, Common Equity Tier 1, and Tier 1 capital for Millennium BCP
Those regressions provide the following equations:
• Millennium BCP ROA = 0.01 – 0.21 Common Tier 1 Capital+ 0.09 Tier 1 Capital (11)
• Millennium BCP ROE = 0.16 – 4.82 Common Tier 1 Capital+ 2.22 Tier 1 Capital (12)
According to Gujarati (2011), the “σ” is the intercept and the “β”s are defined as the slope coefficients, in this case, the slope of CTIER1 and TIER1. Jointly, they constitute the regression parameters. According to the regression output of table 2, the average expected value of the Return on Equity is 0.01, and this value is reached by matching the independent variables to zero. Also, it is possible to observe that, all else being constant, an increase of one percent in Common Equity Tier 1, would change, on average, the ROA of Millennium by -0.21% and -4.82% for the ROE. On another hand, if the Tier 1 capital increases by one percent, on average, the Return on Assets will increase by 0.09% and the Return on Equity by 2.2%. It means that TIER 1 has a positive impact on the ROE and ROA. On another hand, CTIER1 has a negative impact on the profitability of Millennium BCP. In order to analyse the statistical significance of the independent variables, some statistical tests will be taken into account. Brooks (2008) defines the t-statistic as the ratio of the coefficient to its standard error, and it is very useful to compare with the corresponding critical value. The critical value is considered to be -1.96 and 1.96 from a t-distribution and the main goal consist in analysing whether the null hypotheses will be rejected (significant) or not (not significant). According to the output
24
of the regression of table 2 and 3, the coefficient CTIER1 is statistically significant because the t-stat is higher than 1.96 and in this case, lower than -1.96. The other statistical test is the P-value. Brooks (2008) defends that “it gives the marginal significance level where one would be indifferent between rejecting and not rejecting the null hypothesis.” (Brooks, 2008: p.74). Assuming a significance level of 0.05%, for a confidence interval of 95%, both CTIER1 variables are statistically significant. In the specific case of Millennium BCP, it means that there is a relation concerning the behaviour between CTIER1 with the ROE and ROA. Following Gujarati (2011) regarding the interpretation of the confidence interval, it is possible to state that there is a 95% probability that the impact of an additional unit of CTIER1 on the ROA will be at least -0.31 and -0.11 units at the most.
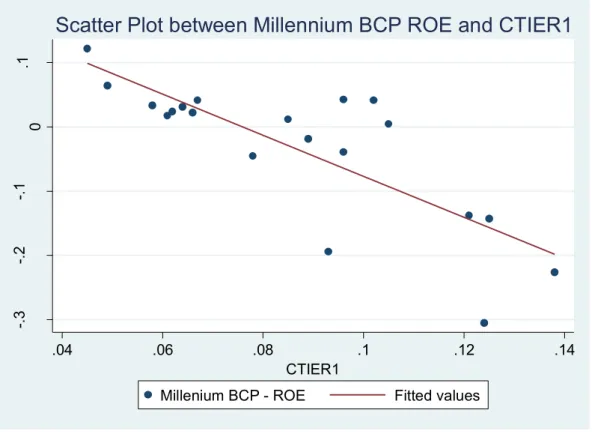
The estimation produces a good fit, insofar as, according to the R-Squared, approximately 64% of the movements on the ROA of Millennium BCP are explained by the variables of the estimated regression and the chosen independent variables, which also explain 70% of the movements of the ROE. From the following Figure it is possible to analyse the behaviour of the regression observations:
Figure 4 - Scatter plot between Millennium BCP ROE and CTIER1
-.3 -.2 -.1 0 .1 Mi lle nn iu m BC P R O E .04 .06 .08 .1 .12 .14 CTIER1
Millenium BCP - ROE Fitted values
25
Through the observation of the figure 4 above, it is possible to conclude that the independent variables were able to explain the dependent variable since most of the observations are close to the regression line (fitted values). The Standard errors of this regression are very low, meaning that the values of the ROE and ROA over the 10 years of the study do not present strongly diverging values from the mean. More importantly, the figure also expresses the negative trend of the ROE in relation to progressive increases of CTIER1.
It is also important to analyse some relevant statistical tests, for instance, the F-test, Breusch-Pagan and Ramsey test. Starting with the F-test, the test results associated with regression (11) and (12) above mentioned, are respectively 0.02% and 0%, meaning that the estimation is globally well estimated, and it is representative of the population. In terms of autocorrelation tests, the Breusch-Pagan test for both regressions was computed. Regressions (11) and (12) test results were 40.48% and 35.88%, meaning that there are no heteroscedasticity issues. Taking into account the Ramsey test, according to Gujarati (2011) to detect if the model is omitting some relevant variables, it is possible to conclude through the test results, 38.74% and 30.15% respectively, that the model is correctly specified.
Banco Português de Investimento (BPI)
Banco Português de Investimento S.A. (BPI) is “the fifth largest financial institution operating in Portugal in terms of assets (…) with market shares of 9.2% in loans and 10.7% in customer resources ” (BPI, 2017). The bank was founded in 1981 and its core business area is Retail Banking and Commercial Banking. Roughly 85% of BPI’s stake is held by CaixaBank Group. BPI total assets raised in June 2017 to an amount of 32,751 Million euros.
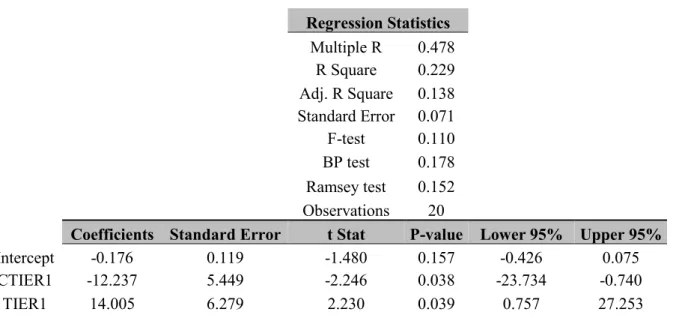
26 Regression Statistics Multiple R 0.478 R Square 0.229 Adj. R Square 0.138 Standard Error 0.071 F-test 0.110 BP test 0.178 Ramsey test 0.152 Observations 20
Coefficients Standard Error t Stat P-value Lower 95% Upper 95%
Intercept -0.176 0.119 -1.480 0.157 -0.426 0.075
CTIER1 -12.237 5.449 -2.246 0.038 -23.734 -0.740
TIER1 14.005 6.279 2.230 0.039 0.757 27.253
Table 16 - Regression (13) between ROE, Common Equity Tier 1, and Tier 1 capital for Banco Português de Investimento
This output provides the next equation:
• BPI Return on Equity = -0.18 – 12.24 Common Equity Tier 1 + 14.01 Tier 1 (13)
According to the above-mentioned estimation all of the independent variables are statistically significant for a 95% confidence interval. Also, the independent variables create the same impact on BPI as the corresponding impact verified in Millenium BCP, more specifically the fact that CTIER1 has a negative impact on ROE and TIER1 a positive impact on ROE. It is important to observe that the R-squared is low, and on this specific regression, the observations of this sample are not so close to the regression line (fitted values) as the previous. Also, the inclination of the line expressing the fitted values is not so steep comparing with Millennium BCP:
27
Figure 5 - Scatter plot between BPI ROE and TIER1
According to F-test, regression (13) presents a result of 10.97%, meaning that this estimation is a borderline case of good fit for a Confidence Interval of 90%. Regarding the presence of autocorrelation, the BP test was computed. The corresponding test result was 17.82%, stating that there is no issue with heteroscedasticity, the error has the same variance given any value of the explanatory variables. Also, there are no omitted variables in the current model because the Ramsey test presented a value of 15.15%.
Santander Totta
Banco Santander Totta S.A. (Santander Totta), founded in 1988, is now one of the largest private banks in Portugal. In the third quarter of 2017, the bank announced gross loans of 31 thousand million euros, 15.4% market share, customer funds of 37.9 thousand million euros and deposit’s market share of 13.7% (Aug. 2017). Currently, the bank has almost 600 branches and over 6,000 employees.
Concerning Santander Totta, presently one of the biggest privately-owned banks in Portugal, the following regression output was estimated:
-.1 0 .1 .2 .3 BPI R O E .06 .08 .1 .12 .14 .16 TIER1
BPI - ROE Fitted values
28 Regression Statistics Multiple R 0.677 R Square 0.458 Adj. R Square 0.394 Standard Error 0.053 F-test 0.006 BP test 0.426 Ramsey test 0.380 Observations 20
Coefficients Standard Error t Stat P-value Lower 95% Upper 95%
Intercept 0.131 0.069 1.897 0.075 -0.015 0.276
CTIER1 -2.266 0.630 -3.598 0.002 -3.596 -0.937
Total Capital 1.707 0.843 2.025 0.059 -0.071 3.485
Table 17 - Regression (14) between ROE and Common Equity Tier 1 and Total capital for Santander Totta
This output provides the next equation:
• Santander Totta ROE = 0.13 – 2.27 Common Tier 1 Capital + 1.71 Total Capital (14)
On this regression for Santander Totta is important to observe that Total Capital is one of the independent variables that helps explain the ROE of Santander. This variable is statistically significant for a significance level of 10%. The following figure 6 expresses the behaviour of CTIER1 on the Santander Totta ROE:
29
Figure 6 - Scatter plot between Santander Totta ROE and CTIER1
Through the corresponding output, it is also possible to verify the positive contribution that Total Capital has on this profitability ratio. The CTIER1 continues to be very significant, however it does not have such a negative impact on ROE comparing with the other Portuguese banks.
Regarding the F-test for regression (14), the test result presented a value of 0.55%, demonstrating how well the current model is representative of the population. In terms of autocorrelation, the BP test was computed, and the test result is 42.61%. To support the previous results, the Ramsey test for regression (14) is 37.95%, a very significant result, expressing that the equation is correctly specified.
Montepio
Caixa Económica Montepio Geral S.A. (Montepio) was founded in 1844 and is considered to be a savings bank with its core business in Retail Banking. The bank has a thousand million euros in total assets, gross loans to customers of about 15 thousand million, and customer funds of 12 thousand million euros, as presented in its 2016 Report and Accounts 21. Finally, it’s network has more than 450 branches and 3.800 employees.
0 .0 5 .1 .1 5 .2 Sa nt an de r T ot ta R O E .08 .1 .12 .14 .16 CTIER1
Santander Totta - ROE Fitted values
30
Considering the regression (15) output of Montepio, it should be observed that this bank has the lowest market share comparing with the other 4 banks of the study in terms of credit, deposits and assets.
Regression Statistics Multiple R 0.570 R Square 0.325 Adj. R Square 0.246 Standard Error 0.061 F-test 0.035 BP test 0.003 Ramsey test 0.084 Observations 20
Coefficients Standard Error t Stat P-value Lower 95% Upper 95%
Intercept -0.040 0.087 -0.457 0.653 -0.223 0.144
TIER1 -4.094 1.871 -2.188 0.043 -8.041 -0.146
Total Capital 3.438 1.212 2.836 0.011 0.881 5.996
Table 18 - Regression (15) between ROE, Tier 1, and Total capital for Montepio
This output provides the next equation:
• Montepio ROE = -0.04 – 4.09 Tier 1 Capital+ 3.44 Total Capital (15)
It is important to note a quite different performance of TIER1 on Montepio’s Return on Equity, when comparing with the previously presented results associated with Millennium BCP and BPI. In this case, TIER1 has a strong negative impact on banks profitability. Both independent variables are statistically significant for a significance level of 5%, and the Total Capital is almost significant for a significance level of 1%.
31
Figure 7 - Scatter plot between Montepio ROE and Total Capital
Concerning the F-test for regression (15), the test result is 3.52%. It is possible to conclude that the model is representative of the population. In relation to the autocorrelation test, it was obtained a result of 0.25% meaning that, the errors are heteroskedastic. The Ramsey test has a value of 8.35%, it is possible to conclude, for a significance level of 5%, no omission of relevant variables impacted the ROE of Montepio.
Caixa Geral de Depósitos
Caixa Geral de Depósitos S.A. (CGD), was created by Carta de Lei in 1876, during the reign of King Luís. Nowadays, it has approximately 16,000 employees and operates in over 1,200 branches. According to Bloomberg (2017), the main areas of CGD activity are Retail Banking, Commercial Banking, Corporate Finance and Asset Management. When it comes to assets, CGD is Portugal’s largest bank as they stood at 99.36 thousand million euros in June 2016. Finally, Caixa Geral de Depósitos, the biggest bank in Portugal with a market share higher than 25% in terms of deposits, loans and assets, presents the following regressions output:
-.2 -.1 5 -.1 -.0 5 0 .0 5 Mo nt ep io R O E .06 .08 .1 .12 .14 Total Capital
Montepio - ROE Fitted values
32 Regression Statistics Multiple R 0.381 R Square 0.145 Adj. R Square 0.045 Standard Error 0.006 F-test 0.264 BP test 0.000 Ramsey test 0.150 Observations 20
Coefficients Standard Error t Stat P-value Lower 95% Upper 95%
Intercept 0.005 0.006 0.744 0.467 -0.009 0.018
CTIER1 0.207 0.150 1.382 0.185 -0.109 0.524
TIER1 -0.254 0.151 -1.681 0.111 -0.573 0.065
Table 19 - Regression between ROA, Common Equity Tier 1, and Tier 1 Capital for Caixa Geral de Depósitos
Regression Statistics Multiple R 0.384 R Square 0.147 Adj. R Square 0.047 Standard Error 0.129 F-test 0.258 BP test 0.000 Ramsey test 0.302 Observations 20
Coefficients Standard Error t Stat P-value Lower 95% Upper 95%
Intercept 0.087 0.146 0.596 0.559 -0.220 0.394
CTIER1 5.035 3.373 1.493 0.154 -2.081 12.151
TIER1 -5.823 3.401 -1.712 0.105 -12.998 1.352
Table 20 - Regression between ROE, Common Equity Tier 1, and Tier 1 Capital for Caixa Geral de Depósitos
These outputs provide the next equations:
• CGD Return on Assets = 0.005 + 0.21 Common Tier 1 Capital – 0.25 Tier 1 (16)
• CGD Return on Equity = 0.087 + 5.04 Common Tier 1 Capital – 5.82 Tier 1 (17)
Scrutinising the results of both regressions, what draws immediately to attention are the opposite trends of the results founded in the previous regressions, concerning the performance of the independent variables. As is possible to note through the observation of the regression output associated with Caixa’s estimation, the positive impact of CTIER1 and the negative impact of TIER1 (considering ROE as the dependent variable):
33
Figure 8 - Scatter plot between CGD ROE and CTIER1
Figure 9 - Scatter plot between CGD ROE and TIER1
However, none of the variables are statistically significant and could not explain properly the ROA and ROE respectively. Another finding consists in the fact that, these two variables, in
-.6 -.4 -.2 0 .2 C G D R O E .06 .08 .1 .12 CTIER1
CGD - ROE Fitted values
Scatter Plot between CGD ROE and CTIER1
-.6 -.4 -.2 0 .2 C G D R O E .06 .08 .1 .12 TIER1
CGD - ROE Fitted values
34
addition to not being statistically significant, do not explain the movements of ROA and ROE, because the R-squared of both regressions are 14.5% and 14.7% respectively. That is, their explanatory power is somewhat limited.
According to very relevant statistical tests, for instance, the F-test, Breusch-Pagan and Ramsey test, those results were performed in order to understand if the model fits and properly explains the population. Considering the results of the F-test, of regression (16) and (17) above mentioned, are respectively 26.35% and 25.81%, meaning that the estimation is not well estimated comparing with the previous regressions of the other Portuguese banks. In terms of autocorrelation tests, the Breusch-Pagan test was computed for regressions (16) and (17), and the results were 0.03% and 0.01%, grounding the idea of heteroscedasticity issues. The Ramsey test presents the following results, 14.97% and 30.15% respectively, demonstrating that the no omission of relevant variables is present in the estimations.
To conclude, through the estimation of the above-mentioned regressions, it is possible to collect some relevant empirical results in relation to the impact of capital ratios on the profitability of Portuguese banks.
The first overall finding suggests that there is a negative relationship between CTIER1 and ROE for BPI, BCP and Santander Totta, as they present a high degree of significance for this variable (close to 1% of significance). This variable also has an important feature, because it has a very significant impact on the bank’s profitability, taking into consideration the high levels of the coefficient relative to this variable. Second, for the same three (3) banks previously described, the TIER1 contributes to the increase of profitability. Third, for Montepio and Santander Totta, the obtained significant results associated with the independent variable Total Capital may demonstrate that in Portugal, this ratio contributes positively to the ROE. Fourth, regarding the independent variables, the CTIER1 has coefficients with higher magnitude comparing with TIER1 in most of the Portuguese banks, and TIER1 presents higher coefficients in comparison with Total Capital.
These empirical findings allow us to conclude that these three main capital requirements imposed by Bank for International Settlements will have a significant impact on the profitability of major Portuguese banks, as depicted by the estimated equations. The described findings are at the origin of a very important question: How have these new capital requirements affected/impacted Portuguese banking activities and, subsequently, banks’ profitability since the Global Financial Crisis?
35
According to APB (2015), the historical levels of bank capital have always stood above the legal minimums required. However, since 2008, Tier 1 Capital and Total Capital of Portuguese banks have lower values comparing with the average of European Union 27. Nevertheless, the obligation to progressively increase the levels of bank capital affects the credit channel of Portuguese banks. Bonfim (2013) states that the credit channel “encompasses two different transmission mechanisms: the bank lending channel and the balance sheet channel.” (Bonfim, 2013: p.89). With the increasing of capital requirements, as depicted through Table 1, Portuguese banks will have more capital in their balance sheets and the credit channel will progressively decrease until 2019 (until the full implementation of Basel III takes place). Bonfim (2013) also found that the Portuguese banks, mainly the smaller ones, provide more loans to riskier borrowers, with higher probabilities of default, when the overall level of interest rates is low. This research also concludes that there is a “risk-taking channel in Portugal”. (Bonfim, 2013: p. 102). One of the main problems in the Portuguese banking sector that contributes to the lack of profitability is the increase of Non-Performing Loans (NPLs), as verified since the beginning of the Global Financial Crisis.
Figure 10 - Non-Performing Loans to Total gross loans Source: Federal Reserve Economic Data (2017)
0 5 10 15 20 N on Pe rfo rmi ng L oa ns to T ot al G ro ss Lo an s (% ) 2005 2006 2007 2008 2009 2010 2011 2012 2013 2014 2015 Year USA Portugal Germany Italy
36
The figure above demonstrates the growth of the ratio between defaulted loans (when borrowers are more than 90 days into non-compliance with their obligations) and the total gross loans for USA, Germany, Portugal, and Italy. In the beginning of the GFC, the USA banking sector had a peak on the loan defaults series; however, two years later the U.S. banking industry was able to stabilize this crisis trend in the banking sector. Regarding one of the most developed economies in Europe, Germany was mildly affected by the contagion process associated with the propagation of the financial shock across financial institutions. However, the same did not happen to Portugal, as the series reveals that, from 2005 to 2015, the value of NPL’s increased sharply (expressed as non-performing loans to total gross loans). In fact, this increase is massive, at the value increased by 635%. According to KPMG (2017), the NPLs consume banks’ capital, increase the running costs of the corresponding banks, while also having a huge impact on the corresponding profitability, which could, eventually, even compromise the sustainability of the Portuguese banking sector. It is possible to conclude that the NPLs are one of the main drivers of the decrease of Portuguese banks’ profitability. KPMG (2016), suggest that there are 5 key drivers of bank profitability. The net interest margins, cost of income ratios, the business model of the bank, the non-performing loans that increase banks’ provisions (and consequently decreases profitability), and, finally, the regulatory reform that increases the capital requirements. Following this line of reasoning, Portuguese banks inevitably had to comply with this effort of increasing their corresponding capital requirements, especially in periods of financial distress, when they need significant amounts of bank capital in order to carry out their banking activities in the face of financial distress episodes. In sum, the present section of the Dissertation concludes that the new capital requirements imposed by Basel III framework have a negative impact on the profitability of Portuguese banks.