THE PROPOSED ACQUISITION
OF DANONE BY UNILEVER
Ana Margarida Almeida Carvalho
Dissertation written under the supervision of Professor António
Borges de Assunção
Dissertation submitted in partial fulfilment of requirements for the MSc in
Finance, at the Universidade Católica Portuguesa, June 2020.
ACKNOWLEDGEMENTS
During the last years, I worked hard to overcome my own goals and discover who I want to be as a professional. It is hard to say if this is the final year of my studying journey.
I thought this thesis would be the last chapter of my master’s degree, but it was more than that. It was the realization that we can all finish what we set our mind to, even in unusual times. I would like to thank my Academic Advisor António Borges de Assunção for the support and availability he gave me since day one, not only in terms of guidance and theoretical background but also motivation. I would like to express gratitude to my friends Ana Prata and Tomi Siira for the support they gave me while writing this thesis.
To my classmates that became friends, for setting a healthy competition between us, and for being always around for help and long study sessions.
To my parents and sister, for their unconditional love and support, and for making it possible for me to study at Universidade Católica Portuguesa and be the first one of my family to hold a master’s degree.
ABSTRACT
The purpose of this dissertation is to propose an acquisition in the Consumer Goods Sector. This Sector has been consistently growing in the last years, and Investment Analysts forecast it as one of the fastest moving in the next years.
The proposed companies are Unilever as acquirer and Danone as target. Danone is a unique opportunity for Unilever to acquire a company that has brands loved by million families across countries and a strong pathway for delivering long term sustainable value to the economy and environment.
Unilever and Danone have an intrinsic value of €123 046million and €44 507million, respectively. The acquisition would follow a friendly takeover with a bid price of €56 265 million, which represents a 30% premium over the market capitalization of the target as of 29th May 2020. The offer would be 80% cash and 20% equity, financed by cash reserves and the issuance of debt. In term of shares, Unilever would need to issue 242million shares for the acquisition. It is expected that the proposed acquisition yield €13 967million in synergies and deliver €2 208 million value to acquirer shareholders.
Keywords: Mergers & Acquisitions, Consumer Goods, Healthy Food Title: The Proposed Acquisition of Danone by Unilever
ABSTRATO
Esta dissertação tem como objetivo propor uma aquisição no setor de Bens de Consumo. Este setor tem vindo a crescer nos últimos anos, e analistas preveem como um dos setores com maior mudança nos próximos anos.
Unilever é a empresa proposta como investidora e Danone como empresa adquirida. Danone é uma oportunidade única para Unilever adquirir uma empresa que tem marcas amadas por milhões de famílias em vários países e um plano forte para criar valor sustentável a longo prazo para a economia e ambiente.
Unilever e Danone têm valor intrínseco de €123 046 milhões e €44 507 milhões, respetivamente. A aquisição seguiria uma proposta amigável com uma oferta de €56 265 milhões, que representa um prémio de 30% acima do valor de mercado da empresa adquirida a 29 Maio 2020. A oferta seria em dinheiro e ações, financiada por capital próprio e emissão de dívida. Unilever emitiria 242 milhões de novas ações. Espera-se que a aquisição proposta gere sinergias no valor de €13 967m e crie um valor capturado de €2 208 milhões para os acionistas da Unilever.
Palavras-chave: Fusões e Aquisições, Bens de Consumo, Comida Saudável Título: A Proposta de Aquisição da Danone pela Unilever
TABLE OF CONTENTS ACKNOWLEDGEMENTS ... 1 ABSTRACT ... 2 ABSTRATO ... 3 LIST OF FIGURES ... 6 LIST OF TABLES ... 7 LIST OF EQUATIONS ... 8 LIST OF ABBREVIATIONS ... 9
PART I – LITERATURE REVIEW ... 10
1.MERGERS AND ACQUISITIONS ... 10
1.1. M&A Overview ... 10
1.2. M&A Outlook ... 10
1.3. Motivations for M&A ... 12
1.4. Acquisition Premium ... 14
1.5. Methods of Payment ... 14
1.6. Profitability of M&A Deals ... 15
2.VALUATION ... 16
2.1. Valuation Overview ... 16
2.2. Discounted Cash Flow ... 17
2.2. Adjusted Present Value ... 20
2.3. Relative Valuation ... 20
PART II – INDUSTRY ANALYSIS ... 22
1. INDUSTRY OVERVIEW ... 22
1.1. Market Size and Segmentation ... 22
1.2. Growth Projections ... 24
1.3. Drivers, Trends and Consumer Preferences ... 26
1.4. M&A Activity ... 27
1.5. Key Challenges ... 27
PART III – COMPANY PROFILES ... 29
1.UNILEVER ... 29
1.1. Overview ... 29
1.2. Culture ... 30
1.3. Strategy and R&D ... 30
1.4. Structure and Ownership ... 31
1.5. SWOT Analysis... 32
1.6. Financial Analysis ... 33
2.DANONE ... 39
2.2. Culture ... 40
2.3. Strategy and R&D ... 40
2.4. Structure and Ownership ... 41
2.5. SWOT Analysis... 42
2.6. Financial Analysis ... 43
PART IV – DEAL RATIONALE ... 49
PART V – VALUATION ... 51
VALUATION OF STANDALONE FIRMS ... 51
1. Unilever ... 51
2. Danone ... 55
VALUATION OF THE COMBINED FIRM ... 58
1. Synergies ... 58
2. Premium ... 59
3. Transaction and Integration Fees ... 60
4. Financing ... 60
5. Valuation Summary ... 61
6. Accretive/ Dilutive Analysis ... 62
PART VI – TRANSACTION TOPICS ... 63
1. TAKEOVER APPROACH ... 63
2. POST-MERGER INTEGRATION RISKS ... 63
3. ALTERNATIVE TARGET ... 64
PART VII – CONCLUSION ... 65
BIBLIOGRAPHY ... 66
LIST OF FIGURES
Figure 1- Global Deal Value and Volume; source: Moody's Analytics (2019) ... 11
Figure 2- Operating and Financial Synergies; source: Damodaran (2005) ... 13
Figure 3- Market Capitalization Distribution of Industry; adapted from Eikon Thomson Reuters ... 22
Figure 4- Bottled Water Market Value by Geography; adapted from MarketLine (2019) ... 23
Figure 5- Bottled Water Market Forecast; adapted from MarketLine (2019) ... 24
Figure 6- Global Dairy Market Forecast; adapted from MarketLine (2019) ... 25
Figure 7- Organic Food Market Forecast; adapted from MarketLine (2019) ... 25
Figure 8- Unilever Brands Example; adapted from Unilever Annual Report (2019) ... 29
Figure 9- Ownership of top 10 Investment Managers (2020); adapted from Eikon Thomson Reuters ... 31
Figure 10- Unilever Historic Revenues by Business Line; adapted from Unilever Annual Report ... 33
Figure 11- Unilever Historic Revenues by Geography; adapted from Unilever Annual Report ... 33
Figure 12- Unilever Historic Costs; adapted from Unilever Annual Report ... 34
Figure 13- Danone Ownership (2020); retrieved from Eikon Thomson Reuters ... 41
Figure 14- Danone Historical Revenues by Business Line; adapted from Danone Annual Report ... 43
Figure 15- Danone Historical Revenues by Geography Segment; adapted from Danone Annual Report ... 43
Figure 16- Danone Historical Costs; adapted from Danone Annual Report ... 44
Figure 17- Danone Historic EPS and ROE; retrieved from Eikon Thomson Reuters ... 46
Figure 18- Danone Historic Dividend Yield (%); retrieved from Eikon Thomson Reuters .... 46
Figure 19- Danone Share Price Performance; retrieved from Eikon Thomson Reuters ... 47
Figure 20- Danone and CAC 40 Stock Price Performance; retrieved from Eikon Thomson Reuters ... 48
Figure 21- Unilever Valuation Football Field ... 55
Figure 22- Danone Valuation Football Field ... 58
Figure 23- Summary Valuation ... 62
Figure 24- Post-Transaction Integration Matrix; adapted from Haspeslagh & Jemison (1991) ... 64
LIST OF TABLES
Table 1- Merger Motives; adapted from Trautwein (1990) ... 12
Table 2- Acquisition Premium and Announcement Price Reaction; adapted from Berk & DeMarzo (2017) ... 14
Table 3- Default Spread; source: Damodaran (2020) ... 19
Table 4- Unilever's SWOT Analysis ... 32
Table 5- Unilever vs FTSE Returns ... 38
Table 6- Danone SWOT Analysis ... 42
Table 7- Danone Historic Key Metrics; retrieved from Eikon Thomson Reuters ... 45
Table 8- Danone vs. CAC 40 returns ... 48
Table 9- Unilever Free Cash Flow to the Firm Forecast ... 53
Table 10- Unilever WACC-based DCF Valuation Sensitivity Analysis ... 54
Table 11- Danone's Free Cash Flow to the Firm Forecast ... 57
Table 12- Danone WACC-based DCF Valuation Sensitivity Analysis ... 57
LIST OF EQUATIONS
Equation 1- WACC discount rate computation ... 17
Equation 2- Cost of equity computation ... 18
Equation 3- Beta unlevered computation ... 19
Equation 4- Beta Levered Adjustment ... 19
Equation 5- After-tax cost of debt computation ... 20
LIST OF ABBREVIATIONS
APV BRICS
Adjusted Present Value
Brazil, Russia, India, China and South Africa CAGR CAPEX CAPM CF COGS GDP D&A DCF EBIT EBITDA EPS EV FCFF FMCG IPO M&A MV PP&E PV R&D ROE SG&A TV WACC WC
Compound Annual Growth Rate Capital Expenditures
Capital Asset Pricing Model Cash Flow
Cost of Goods Sold Gross Domestic Product Depreciation and Amortization Discounted Cash Flow
Earnings Before Interest and Taxes
Earnings Before Interest, Taxes, Depreciation and Amortization Earnings per Share
Enterprise Value
Free Cash Flow to the Firm Fast Moving Consumer Goods Initial Public Offering
Mergers and Acquisitions Market Value
Property, Plant and Equipment Present Value
Research and Development Return on Equity
Selling, General and Administrative Terminal Value
Weighted Average Cost of Capital Working Capital
PART I – LITERATURE REVIEW 1. Mergers and Acquisitions
1.1. M&A Overview
Mergers and Acquisitions (M&A), also referred as “the market for corporate control” (Berk & DeMarzo, 2017), can either be the act of one company or group of individuals acquiring another company (acquisition), or the merge between companies (merger). When one firm acquires another, there is typically a buyer, referred as the acquirer or bidder, and a seller, called the target firm. When this happens, there is a change of ownership and control of the firm, usually referred as a takeover (Berk & DeMarzo, 2017).
Mergers can be characterized as horizontal when the firms operate in a similar industry, or vertical, meaning the merger take place between firms that operate in two distinct industries but within the same supply chain (DePamphilis, 2011). Conglomerate Merger is the term used when there is merge between firms that operate in different industries and their business activities are unrelated.
Additionally, a takeover can be denominated as friendly or hostile. While a friendly takeover happens with the approval of target’s management, a hostile takeover takes place when a deal happens against the wishes of the management team.
1.2. M&A Outlook
The M&A market tends to be characterized by peaks of heavy activity, followed by moments of few transactions, also called merger waves. Although Brealey & Myers (1996) argue that financial theory does not explain merger waves, Rhodes-Kropf, Robinson, and Viswanathan (2005) suggest that disclosure of private information on both sides can lead to increased merger activity that is correlated with market.
The “urge to merge” began in North America during the 60s and there has been a steady increase in the number of mergers and acquisitions since that time (Burke, 1988). In 2007, M&A deals broke new records and the second half of 2007 saw the end of one of the biggest merger wave in the U.S. market (Wruck, 2008).
With a more careful overview of last year, coming from a strong 2018, in 2019 global M&A deals declined both in volume and value. In fact, the results were the lowest for any year since 2013. Nevertheless, 2019 was the sixth highest year on record in terms of volume and the seventh highest in terms of value.1 Although there was a decline in announcements of M&A activity, strategic dialogue remained strong as a driver for M&A activity and stronger business, being North America the region with highest number of megadeals2,3. Figure 1 give additional understanding of Deal value and volume in the last 6 years.
Figure 1- Global Deal Value and Volume; source: Moody's Analytics (2019)
M&A activity is expected to be driven by firms looking to strengthen their portfolio, particularly in times of prolonged uncertainty. Three trends are shaping the global M&A landscape in the future years: i) Portfolio optimization, ii) Health, ethicality and authenticity, and iii) Digital transformation.4 Companies with similar size are expected to continue to merge, to increase free cash flow, diminish earnings volatility and withstand risks raised from uncertainty in some markets. Studies suggest that Europe is at the verge of losing its competitive advantage in some markets, especially due to the tendency for bigger deals in North America and the increase of number of deals in Asia Pacific (driven mainly by the Chinese economy).5
1 (Moody’s Analytics, 2019)
2 Transactions with size greater than 10million USD
3 (J.P. Morgan, 2020)
4 (KPMG, 2019)
Global Scope deals have increased from 41% in 2015 to 58% in 2019, showing a consistent response of the market to growth pressures and disruption. Scope deals are prevalent in most of the industries, with healthcare, technology and consumer goods showing the strongest momentum.6
1.3. Motivations for M&A
Many acquisitions and large strategic investments are often justified with the argument that they will create synergies, which is the additional value that is generated when combining firms, creating opportunities that would not be available alone (Damodaran, 2005).
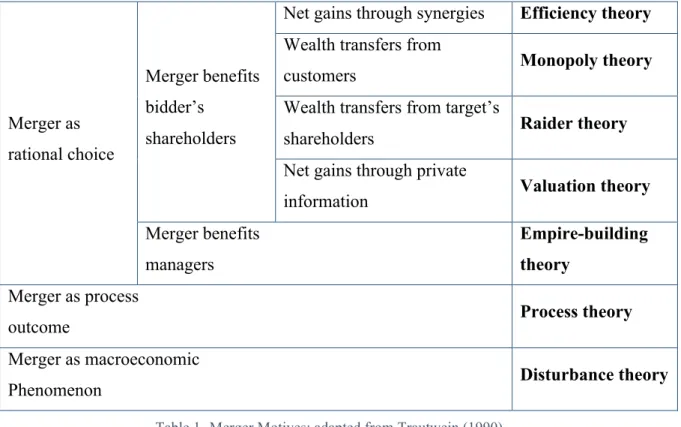
Trautwein (1990) categorizes seven theories of merger motives, as seen on Table 1.
Literature suggests that Merger Motives can be divided into three different groups: Economic, Personal and Strategic Motives (Brouthers, van Hastenburg, & van den Ven, 1998). In their study, Brouthers, van Hastenburg and van den Ven recognize that merger motives can range from increasing profitability to increasing managerial prestige and conclude that managers have often more than one motive to enter a deal. Walter & Barney (1990) and
6 (Bain & Company, Inc. , 2020)
Merger as rational choice
Merger benefits bidder’s
shareholders
Net gains through synergies Efficiency theory Wealth transfers from
customers Monopoly theory
Wealth transfers from target’s
shareholders Raider theory
Net gains through private
information Valuation theory
Merger benefits managers
Empire-building theory
Merger as process
outcome Process theory
Merger as macroeconomic
Phenomenon Disturbance theory
Trautwein (1990) also state that mergers might be undertaken to enhance the economic performance of the firm and this Economic Motives can be marketing economies of scale, increase profitability, cost reduction, response to market failures, among others. Similarly, Berkovitch & Narayanan (1993) and Trautwein (1990) explain that Personal Motives such as prestige or remuneration play an important role in managers’ final decision in entering a deal. Finally, Strategic motives, such as synergy, global expansion, pursuing market power, acquisition of new resources, improving the competitive environment by (1) acquiring a competitor or (2) creating barriers to entry, may motivate merger activities (Ingham, Kran, & Lovestam, 2007) and (Walter & Barney, 1990).
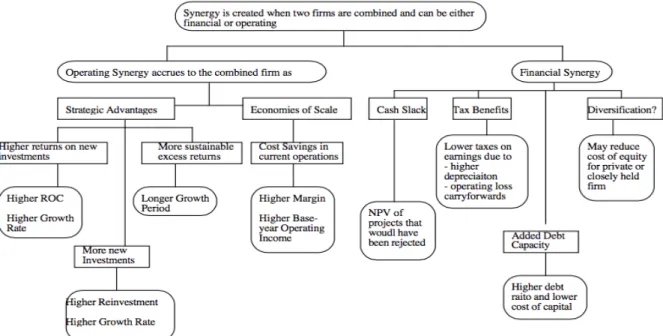
When valuing synergies, acquirers tipically base their calculations on five major types of synergies: savings, revenue enhancements, process improvements, financial engineering, and tax benefits (Eccles, Lanes, & Wilson, 1999). Damodaran (2005) categorizes various sources of synergies into two groups: operating and financial synergies. The author examines how to value these synergies accurately and how sensitive they are to different assumptions made (Figure 2).
Figure 2- Operating and Financial Synergies; source: Damodaran (2005)
Finally, Bunter and Lintner (1951) study tax motivation to sell. The authors conclude that non-taxes motivations had greater importance than the tax motivation in contributing to the decision to sell.
1.4. Acquisition Premium
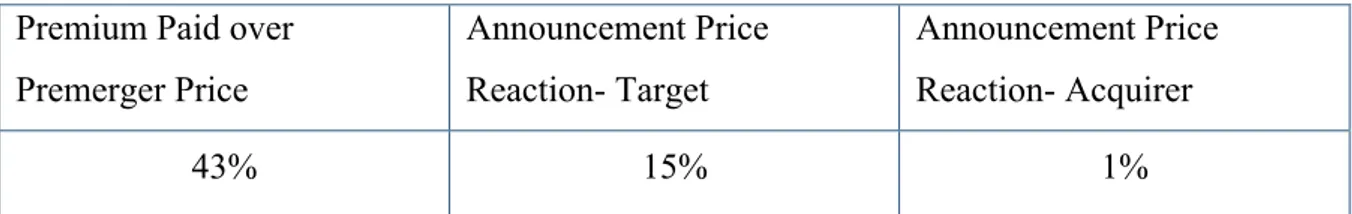
Nowadays, both the acquirer and the target company know that the purchase price will be higher than the intrinsic value, which means that the buyer will most likely pay a premium. (Eccles, Lanes, & Wilson, 1999). The acquisition premium represents the percentage difference between the acquisition price and the premerger price of the target firm (Berk & DeMarzo, 2017).
As table 2 shows, acquirers pay an average premium of 43% over the premerger price of the target.
Table 2- Acquisition Premium and Announcement Price Reaction; adapted from Berk & DeMarzo (2017)
Sirower & Sahni (2006) reported an average premium of 36%, while acquisitions with persistent positive returns had an average of 26% and acquisitions with persistent negative returns a 41% premium.
Literature gives evidence that the bigger the value from synergies, the larger the premium (Damodaran, 2005). The characteristic of the takeover also has an impact on premium paid. Hostile acquisitions have larger premiums than friendly mergers. Tender offers tend also to pay higher premium than the one on mergers (Damodaran, 2005).
While some authors (Eccles, Lanes, & Wilson, 1999) show that the size of the premium does not always correlate to the success of the deal, others (Trautwein, 1990) suggest that managers tend to set a bid price high enough to avoid competitors to bid.
1.5. Methods of Payment
Reasons that influence the method of payment in corporate acquisitions, can go from characteristics of firms to characteristics of the environment in which the acquisition takes place (Martin, 1996). Methods of payment in a corporate acquisition are divided into cash, all-stock and mixed payment of cash and equity.
Overall, the way an acquisition is paid determines how the risk is distributed between Premium Paid over
Premerger Price Announcement Price Reaction- Target Announcement Price Reaction- Acquirer 43% 15% 1%
the buyer and the seller. In a cash deal, the exchange of money for shares sets a simple transfer of ownership. On the other hand, in an exchange of shares, it becomes far less clear who is the buyer and who is the seller (Rappaport & Sirower, 1999). In a cash payment, there is no uncertainty and targets’ managers walk away with cash once the payment is settled, while when there is a stock or mixed payment, uncertainty is faced since the value is tied up to post merger success (Amel-Zadeh & Meeks, 2019). Travlos (1987) explains the method of payment plays also a signaling effect, since when managers engage in an all-stock deal, they believe that its shares are overvalued (Rappaport & Sirower, 1999).
Evidence suggests that shareholder returns are also affected by the type of payment. Indeed, shareholders of acquiring companies fare worse in stock transactions than they do in cash transaction (Rappaport & Sirower, 1999). Furthermore, equity-financed transactions tend to create less value since obliges targets’ shareholders to share the overpaying risk, according to their ownership of the combined firm (Rappaport & Sirower, 1999). The method of payment has also an effect on the acquiring firm’s capital structure. When the payment is settled in cash, usually it is financed with additional borrowing which adds to the indebtedness of the acquiring firm (Travlos, 1987 and Berk & DeMarzo, 2017). Additionally, Damodaran (2005) finds that stock prices of target firms tend to do much better on the announcement of all-cash acquisitions than all-stock or mixed payment acquisitions.
Evidence suggest that stock financing is particularly popular in large transactions and friendly takeovers. Martin (1996) concludes that the higher the acquirer’s growth opportunities, the greater the likelihood of the acquirer to use stock to finance the acquisition. On the other hand, when there is high availability of cash, high institutional shareholding and block holdings, the likelihood of a stock financing decreases, and managers tend to go for a cash payment. Tender offers also reveal to be most likely financed with cash (Martin, 1996).
Rappaport & Sirower (1999) sustain that also valuation plays an important role in what drives the method of payment- especially when shareholders accept an offer for an exchange of shares. Amel-Zadeh & Meeks (2019) conclude in their study that voluntary merger forecasts by the target only has a positive effect on the completion likelihood in stock-financed acquisitions, but not in cash acquisitions.
1.6. Profitability of M&A Deals
M&As are an effective way of transferring resources to where they are most needed and of removing underperforming managers (DePamphilis, 2011), but studies suggest that sellers
are the biggest beneficiaries of M&A transactions (Sirower & Sahni, 2006) and conclude that most acquisitions do not create any value for the acquiring firm shareholders, even though managers keep pursuing it, making bigger deals every year (Eccles, Lanes, & Wilson, 1999).
Literature gives a variety of arguments to the lack of good performance in deals, such as: irrational exuberance about the strategic importance of the deal, enthusiasm built up during the excitement of negotiations, week integration skills, among others (Eccles, Lanes, & Wilson, 1999). Absence of an accurate due diligence process is also a strong candidate for poor performance of transactions, since “deal making is glamorous but due diligence is not” (Cullinan, Le Roux, & Weddigen, 2004), which leads companies to assemble large deals without carefully analyzing the size and scope of the transaction. Ingham, Kran and Lovestam (2007) suggest that smaller acquisitions are more beneficial because they are easier to integrate, leading to managerial, operational and financial synergies.
Cullinan, Le Roux and Weddingen (2004) claim that the momentum of the transaction is hard to resist once senior manager has the target in its sights. They claim that Due Diligence has shifted from a careful analysis of data, to a poor reading of financial statements. It is important to consider that this study was prior to the financial crisis, and more recent evidence suggests that successful acquirers view due diligence as much more than verifying data, as they put under microscope the strategic rationale of the deal.7
As cited in (Brouthers, van Hastenburg, & van den Ven, 1998), number of scholars have suggested reasons for the continued pursuit of M&A deals, regarding the success of them. Indeed, managers pursue different goals rather than shareholder wealth, and are also criticized by being overly optimistic. Past empirical studies on M&A profitability are also believed to give inaccurate information due to poor data collection, irrelevant time-periods covered, and misuse of statistical tools (Berkovitch & Narayanan, 1993) and (Ingham, Kran, & Lovestam, 2007).
2. Valuation
2.1. Valuation Overview
Investment bankers usually price acquisitions using multiples of current earnings or cash flows for comparable companies or transactions, while financial economists estimate the
market value of companies by calculating the discounted value of their expected future cash flows (Kaplan & Ruback, 1996). Little empirical evidence exists on whether any of these models provide reliable information, let alone which one provides the most accurate information.
When making a transaction, managers need to value three different parts of the deal- operation, opportunities and ownership claims, - and take into consideration three fundamental functions- cash, time and risk (Luehrman, 1997). Luehrman (1997) argues that even though the common practice is to make these valuations using only one tool, managers face several issues due to structural features that generate different analytical challenges when valuing the above-mentioned parts of the deal. The author suggests three complementary tools that outperform WACC-based DCF: for valuing operations, the Adjusted Present Value approach; for valuing opportunities, the Option Pricing approach; and for valuing ownership claims, the Equity Cash Flows approach.
Kaplan and Ruback (1996) show evidence that it is worthwhile to combine DCF Approaches and Multiple Valuation information when pricing a deal.
2.2. Discounted Cash Flow
The Discounted Cash Flow (DCF) technique emerged in the 1970s as the best tool for valuing corporate assets, and has two important distinct approaches: The Weighted Average Cost of Capital (WACC) and the Adjusted Present Value (APV), being the WACC method the most common version used (Kaplan & Ruback, 1996).
2.2.1. Weighted Average Cost of Capital
According to the WACC-based DCF, the value of a business equals its expected future cash flows discounted to present value at the weighted average cost of capital (WACC). The rate used to discount cash flows is defined as
WACC = E
E + D∗ Re + D
E + D∗ Rd ∗ 1 − Tc
Where E is the market value of equity, D the market value of debt, Re the cost of equity, Rd the cost of debt and Tc the corporate tax rate.
2.2.1.1. Cost of Equity
To compute the cost of equity we use the Capital Asset Pricing Model (CAPM), introduced independently by Treynor (1961), Sharpe (1964) Lintner (1965) and Mossin (1966), built under the theory of Markowitz (1952) of mean-variance optimization. Cost of equity is computed as follows:
E Ri = Rf + βi E(Rm ) − Rf)
Equation 2- Cost of equity computation
Where Rf represents the risk-free rate; Bi beta of the firm; and E(Rm)-Rf the market risk premium.
The market risk premium measures the excess return that investing in the market yields over a risk-free rate. It provides a benchmark by which is possible to assess investor’ willingness to hold market risk (Berk & DeMarzo, 2017). The risk-free rate under the CAPM model corresponds to the rate at which investors can both borrow and save (Berk & DeMarzo, 2017). Bruner (1998) suggests using the yield of a long term (10 to 30 years) bonds to determine the risk-free interest rate.
2.2.1.2. Beta
The beta coefficient measures the systematic risk or volatility of the portfolio, being, theoretically, the percentage change in the return of a security for a 1% change in the return of the market portfolio (Berk & DeMarzo, 2017). Damodaran (2012) suggests that beta should reflect the risk added to the market portfolio by the investment. Kaplan and Ruback (1996) study valuations based on three different measures of systematic risk, namely firm-based measure, industry based and market-based measure of risk. After getting the unlevered beta for the industry, since the equity beta of a company is determined both by the riskiness of the business it operates in, as well as the amount of financial leverage risk it has taken, there is the need to incorporate the firm’s capital structure as follows (Damodaran, 1999):
βu = βL 1 + 1 − t ∗ DE
Equation 3- Beta unlevered computation
Where bu represents the unlevered beta, bL the levered beta, E the market value of Equity, D the market value of debt, and t the tax rate.
Blaume (1975) shows that company Betas tend to the mean of all betas, so it is justifiable to adjust Beta Levered as follows:
𝐴𝑑𝑗𝑢𝑠𝑡𝑒𝑑 βL = 2
3∗ βL + 1 3
Equation 4- Beta Levered Adjustment
Kaplan and Ruback (1996) conclude that the industry-based and market-based approaches perform the best, giving more realistic results.
2.2.1.3. Cost of Debt
The pre-tax cost of debt can be achieved by summing a default spread to the risk-free rate. The default spread can be given from the credit rating of a traded bond the company has, or, in another case, computed by its interest coverage ratio, as suggested in table 3 (Damodaran 2018).
To compute the after-tax cost of debt, and account for the tax shield savings from interest payments, the following can be done:
After-tax Cost of Debt = Cost of Debt * 1 - tn
Equation 5- After-tax cost of debt computation
Where tn is the tax rate in period n.
2.2. Adjusted Present Value
While the discounted cash flow approach most commonly used, the WACC, has become obsolete, the Adjusted Present Value (APV) Technique has been gaining ground between investment bankers as a complementary tool to value acquisitions (Luehrman, 1997).
The APV relies on the principle of value additivity (Luehrman, 1997), and computes the value of the firm as the sum of two pieces: (i) the value of the firm as an unlevered, all-equity firm, and (ii) the value added by a firm’s choice of capital structure, which comes in the form of the interest tax shield (Luehrman, 1997). The discount rate used to calculate the first part is the unlevered cost of capital, as follows
𝑅𝑢 = 𝑅𝑓 + 𝛽𝑢(𝑅𝑚 − 𝑅𝑓)
Equation 6- Unlevered cost of capital computation
Where Bu is the unlevered beta, Rm-Rf the market risk premium.
2.3. Relative Valuation
To value a firm using relative valuation, we multiply the ratio from the guideline companies by the performance measure for the company being valued (Kaplan & Ruback, 1996). There are three different approaches for relative valuation: Comparable Company, Comparable Transaction and Comparable Industry (Kaplan & Ruback, 1996).
This technique is based on two assumptions that are most of the times unrealistic. First, the expected future cash flows of the company are assumed to grow at the same rate and bare the same level of risk as those of the firm being valued. Secondly, the value of the company is
assumed to vary in direct proportion with change in the performance measure (Kaplan & Ruback, 1996).
Goedhart, Koller and Wessels (2005) suggest using four principles when performing a relative valuation: choose peers with similar return on invested capital and growth projections; rely on forward-looking multiples and not historical averages; give preference to enterprise value (EV) multiples; and adjust EV multiples for non-operating items.
PART II – INDUSTRY ANALYSIS 1. Industry Overview
Both Unilever and Danone operate in the Consumer Staples Sector, that takes part of the Consumer Non-Cyclicals Economic Sector. This sector is characterized as one of the largest, most competitive and fastest moving and includes well-known companies such as Walmart, Costco, Nestlé, Procter & Gamble, PepsiCo, L’Oréal, Philip Morris and AB inBev.
According to GICS, the sector can be divided in three industry groups: i) Food & Staples Retailing, ii) Food, Beverage & Tobacco, and iii) Household & Personal Products. Figure 3 represents the division of this industry groups by market capitalization.
In this analysis, the focus is Food and Beverages Industry, since the proposed target operates in this group.
1.1. Market Size and Segmentation
The Food and Beverages Industry is characterized by the production and distribution of fresh and packaged food and non-alcoholic and alcoholic beverages. To simplify the understanding of this business sector, we will focus on the characteristics that the industry shares with the proposed target, meaning Food and Water.
In terms of bottled water, Nestle SA is the leading player in the industry in value terms, while Coca-Cola and Danone accounted for second and third largest value shares, respectively,
Figure 3- Market Capitalization Distribution of Industry; adapted from Eikon Thomson Reuters
18% 61% 21% Household)&)Personal)Products Food,)Beverages)&)Tobacco Food)&)Staples)Retailing
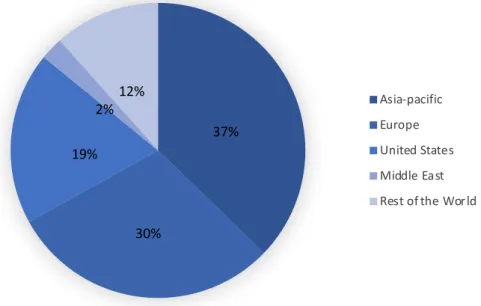
in 2018.8 Figure 4 shows the distribution of market value through geographies. Asia-pacific accounts for 37.2% of the global packaged water market value.
Figure 4- Bottled Water Market Value by Geography; adapted from MarketLine (2019)
In the dairy products segment, Danone Group is the leading market player, generating a 6% share of the market's value. Groupe Lactalis SA and Nestle SA account for the second and third largest market shares, respectively. Europe accounts for 38.3% of the global dairy market value, followed by Asia-pacific with 27%. Milk is the largest segment of the dairy market, with 36% of the market’s total value, followed by cheese and yogurt, with 27% and 11% market value, respectively.
In the organic and natural food segment, the market remains dominated by Europe and the US, but growth in Asia-Pacific, especially China, is very strong. Expectations are the gap between Asia-Pacific and other regions will reduce over the coming years. The United States accounts for 42% of the global organic food market value, followed by Europe with 40% and Asia-Pacific with 12%.
8 Retrieved from MarketLine 2019
37% 30% 19% 2%12% Asia,pacific Europe United9States Middle9East Rest9of9the9World
1.2. Growth Projections
The Consumer Staples sector is expected to reach $14 trillion by 2025, with anti-aging creams, non-carbonated drinks and mineral water the categories revealing the biggest expected growth. 9
With a closer look at the global Food and Beverages industry, growing at a fast pace and expected to show an annual growth rate (CAGR 2020-2024) of 8.4%, the market volume is expected to be of $105,898 million by 2024.10
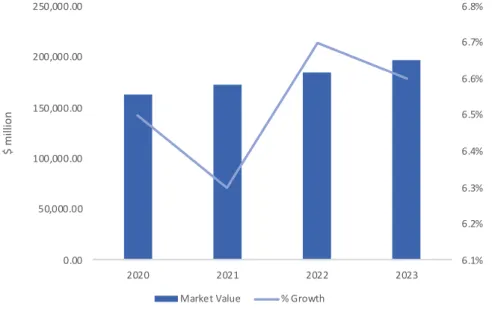
The global packaged water sector has experienced strong value and volume growth in recent years. In 2023, the global packaged water market is forecast (Figure 5) to have a value of $196,864.6 million, an increase of 37.5% since 2018 and a volume of 294,825.9 million liters, an increase of 21.9% since 2018.11
Figure 5- Bottled Water Market Forecast; adapted from MarketLine (2019)
Moreover, the global dairy market has experienced strong value growth and moderate volume growth in recent years. Robust growth registered in the dairy sector by Asian countries such as Indonesia, China and India supported the strong growth of the global dairy market. In 2023, the global dairy market is forecast (Figure 6) to have a value of $520,343.6 million, an increase of 21% since 2018.12
9 (McKinsey & Company, 2015 )
10 (McKinsey & Company, 2015 )
11 (MarketLine, Global Packaged Water Industry Profile, 2019)
12 (MarketLine, Global Dairy Market Industry Profile, 2019)
6.1% 6.2% 6.3% 6.4% 6.5% 6.6% 6.7% 6.8% 0.00 50,000.00 100,000.00 150,000.00 200,000.00 250,000.00 2020 2021 2022 2023 $.mi lli on Market.Value %.Growth
Figure 6- Global Dairy Market Forecast; adapted from MarketLine (2019)
The organic food market is the fastest growing segment in the US food market, according to the US Organic Trade Association (OTA). Growing population, rising income levels, increasing awareness of the benefits of organic and a series of scandals in the non-organic food market, have all helped to boost the growth of the non-organic food market, especially in the Chinese market. In 2023, the global organic food market is forecast (Figure 7) to have a value of $164,788.8 million, an increase of 38.4% since 2018.13
Figure 7- Organic Food Market Forecast; adapted from MarketLine (2019)
13 (MarketLine, 2019) 430,000.00 440,000.00 450,000.00 460,000.00 470,000.00 480,000.00 490,000.00 500,000.00 510,000.00 520,000.00 530,000.00 2020 2021 2022 2023 $.mi lli on Market.Value 120,000.00 125,000.00 130,000.00 135,000.00 140,000.00 145,000.00 150,000.00 155,000.00 160,000.00 165,000.00 170,000.00 2020 2021 2022 2023 $,mi lli on Market,Value
1.3. Drivers, Trends and Consumer Preferences
The growth in the food and beverages industry can be explained by diverse factors. Increasing population is without question the number one driver for consumption, with population expected to increase up to 9.7B by 205014. Economic growth and rising disposable income in emerging markets, especially in BRICS nations, alongside with rapid urbanization are pressuring consumption towards the highest levels ever reported.
With increasing population, need to access quality water increases, and Asia and Africa scarcity problem will eventually increase prices and lower water quality, representing an opportunity to companies that offer quality bottled water.
Societies are becoming more diverse and fragmented. There has been growing split between generations, socio-economic groups and political affiliations, and therefore, consumers are making more decisions based on their values. The demand has been shifting in the most recent years to more natural, organic and probiotic food options, especially in the dairy products. Dairy products tend to be a staple in diets; therefore, they are unlikely to be replaced. Higher awareness of health and wellness, alongside with functional oriented products and the need to tackle climate change, are making a pressure on the market to meet these preferences. Protein enhanced products have been appearing due to the increase of buying power in emerging economies, and a more nutritious and fitness culture in developed countries.
Clinical nutrition is also expected to grow in the next years with ageing populations, increasing numbers of celiac disease patients as well as lactose-intolerant and other disorders. The rise of premature babies since 2016 suggests also an increase in demand of clinical nutrition. This segment is also shifting to more organic and natural, triggered by some scandals in the last decade, such as the Nestlé baby infant formula in Africa, and the reputation of Chinese companies that used to add melanin and other hormones to their formulas, which lead to the death of infants and caused urinary problems in more than 300 thousand babies.
In this new digital era and retail landscape, brands must be visible, convenient and part of the conversation – taking a stand and action on the issues people care about and this has been represented by a high demand for local and environmentally sustainable foods. The growth in social media has helped to spread social awareness with regards to the practices involved in the food market and its impact on environment.
Finally, permanent changes in consumption are emerging due to COVID-19. Whilst the
outbreak and national lockdown leads companies to bankruptcy, it also provides enormous opportunities for industries than can rethink their portfolio, supply chain channel, and marketing fast. Food, Home and Care are seeing massive demand increases (Accenture, 2020) and in the long term, lasting changes will drive portfolio revaluation across industries. Consumers are choosing healthier products, trustworthy and supportive to the communities they live in, so to keep as a leader in the sector, companies need to reshape their marketing plan around new demand.
1.4. M&A Activity
Dealmakers are seeking fewer but bigger transactions. In 2019, M&A activity in the Staples Goods sector declined both in value and volume when compared to 2018, with Household & Personal Products being the only exception with an increase of 4% in value. Even though uncertainty in markets and high valuations lead to less competition between bidders, average deal size remained above records from previous years, reaching an average size of $296.4 million in the industry.
Successful acquirers are focused on companies that complement their growth strategy and align response with changing consumer preferences, expanding into high growth segments and markets.
The acquisition of Laboratories Filorga Cosmetiques SAS by Colgate-Palmolive Co. for $1.7 billion, accounted for 22% of the consumer goods category total value. With consumer preferences shifting to a more healthy and organic diet, Nestlé sold its Ice Cream business, which includes the famous Haagen-Dazs brand, for $4 billion.
1.5. Key Challenges
Some challenges may arise in the sector in the next years. According to the World Bank, global growth decelerated in 2019, with continued weakness in global trade and investment affecting both developed and emerging economies. Geopolitical tensions and climate concerns are increasing the uncertainty. The effects of the newest pandemic, COVID-19, are still to be fully predicted.
The slow growth of wages in developed economies may represent a challenge for companies to increase their revenues in these geographies.
Regulations on competition or on product offering, pricing and plastic packaging, may represent a specific challenge to address in some regions.
The world was expected to face a recession, but with COVID-19, that expectation has been transformed into reality. The outbreak of COVID-19 is taking an extraordinarily heavy toll on the world economy, with world GDP falling at record levels, and all countries reporting positive cases. Borders were closed in most of the countries and national lockdown was implemented, which represented the entrance to a crisis territory for most of the business and eventually countries. The biggest outcomes of the pandemic are direct loss of output and unemployment, which are being tackled by the introduction from governments and institutions of strict measures and rescue plans.
The outbreak of COVID-19 demands rapid response from companies, especially on digital assets and talent. Companies should focus investments in digital training, knowledge systems, and accelerate move to intelligent operating models. Marketing should define brand actions that create positive impact during times of need, understand short term and structural behavioral change and channel impacts. In term of sales, companies can expect an increase in physical goods and decrease in services. Consumer behavior is also changing, since people prefer the safety of online shopping instead of crowded stores. Companies need to review stock allocation and prioritize demand planning, since product scarcity can cause consumers to look at other brands.15
In the consumer goods sector, a future strategic differentiator will be demand sensitivity and flexible manufacturing to consumers, to avoid lack of offering and the increase of Costs of Good Sold as a result from travel bans and bankruptcy of some suppliers.
Finally, the US elections in November 2020 may also affect the industry with new regulations on trade and corporate tax rate.
PART III – COMPANY PROFILES 1. Unilever
1.1. Overview
Unilever is a global company selling FMCG, co-headquartered in the Netherlands (Unilever NV) and United Kingdom (Unilever PLC). NV and PLC, together with their group companies, operate effectively as a single economic entity.
Unilever sells more than 400 brands around 150 countries and employs over 155 thousand people. Its products are present in the house of around 2.5 billion people every day, with 60% of sales from emerging markets and 40% from developed economies. The firm has currently 310 factories in over 70 countries and a global network of more than 400 logistics warehouses that deliver products to 25 million retail sales outlets. In 2019, Unilever had an annual turnover of €52 billion.
From the over 400 brands sold, 85% of them are in a leading position in the industry, being family favorites around the globe, especially Lipton, Knorr, Dove, Rexona, Hellmann’s, Omo and other 6 famous brands that represent an annual turnover of more than €1 billion. Unilever also gives response to specific consumer needs in different regions, under local brands such as Brooke Bond in India, Brilhante in Brazil, and Suave in the Americas. Figure 8 shows some of the most famous brands of the company.
Unilever operates in three divisions: i) Beauty and Personal Care which includes sales of skin care and hair care products, deodorants and oral care products, ii) Foods and Refreshment which includes sales ice cream and tea-based beverages, and sale of soups, sauces,
snacks, dressings, and iii) Home Care which includes sales of home care products, such as powders, liquids and capsules, soap bars and a range of cleaning products. Unilever has also two brands under the water purifier division and Unilever Food Solutions, a global provider of culinary and commercial inspiration to chefs.
1.2. Culture
Unilever believes that succeeding requires "the highest standards of corporate behavior towards everyone we work with, the communities we touch, and the environment on which we have an impact. "The Unilever Sustainable Living Plan” is based on the UN 2030 Agenda, and its focused on three main goals: i) improving health and wellbeing for more than 1 billion people, ii) reduce environmental impact by half (through greenhouse gases, water use, waste and packaging and sustainable sourcing), and iii) financing livelihoods for millions, by more inclusive business and fairness in the workplace.
Since 2010, Unilever already reached to more than 1.3 billion people to improve their health and hygiene, delivered a sustainable impact with 62% of agricultural raw material being sustainable sourced and uses 100% renewable grid electricity in 5 continents.
1.3. Strategy and R&D
Unilever’s strategy is focused mainly on active management portfolio by disposal of obsolete brands and by acquiring fast growing brands, that are focused on customer needs and “good for the planet”. In Unilever agenda, there is also powering emerging markets and a more focused execution based on 5 principles: improve penetration, innovate with impact, capturing growth in fast growing channels, purposeful brands, and fuel for growth with savings.
Unilever assumes that two categories will have high growth in the future: luxury beauty and health, wellness and personal nutrition. Alan Jope, CEO of the company explains that “the overall effect has been to improve Unilever’s exposure to faster growing markets, those that offer better long-term prospects for value creation”.
Innovation is a key factor for growth at Unilever and the company has six R&D locations in India, China, North America, Europe, and the HIVE, the so called “Silicon Valley” of food in the Netherlands. The firm has around 6000 people working in different R&D teams and in 2019 the amount spent in R&D accounted for almost 1billion euros.
1.4. Structure and Ownership
Unilever N.V. and PLC have separate legal identities but operate as a single entity under equalization and other agreements. On June 2020, Unilever announced its plans to unify Group legal structure under Unilever PLC. The company explained that this will allow “strategic flexibility for portfolio evolution, including through equity-based acquisitions or demergers”.
Unilever N.V. ordinary shares are listed on Euronext Amsterdam and as New York Registry Shares on NYSE. The ordinary shares and the New York Registry Shares are exchangeable on a one-for-one basis.
Unilever PLC ordinary shares and depositary receipts of ordinary shares are listed on the London Stock Exchange and as American Depositary Receipts on NYSE. Each ADR represents 1 ordinary PLC share.
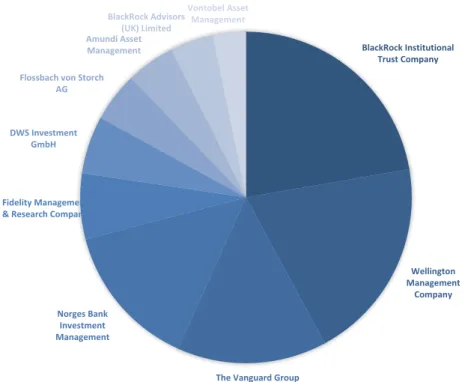
Unilever is owned by mainly investment managers. Figure 9 represents ownership of top 10 investment managers.
BlackRock(Institutional( Trust(Company Wellington( Management( Company The(Vanguard(Group Norges(Bank( Investment( Management( Fidelity(Management( &(Research(Company DWS(Investment( GmbH Flossbach(von(Storch( AG Amundi(Asset( Management BlackRock(Advisors( (UK)(Limited Vontobel(Asset( Management
1.5. SWOT Analysis
A SWOT analysis (Table 4) was constructed to assess how internal and external factors affect Unilever’s performance and assess the firm position within the industry.
Strengths Weakness
Strong brands, high brand loyalty
Vast network of retailers
Efficient supply chain management
Broad product mix
R&D Facilities and Talent
Dependence on retailers
Similar products with main competitors
Substitutes goods
Opportunities Threats
Business diversification
Product innovation (health)
Technology for environment conservation
Organic hypermarkets and supermarkets
High competition
Change in consumer's habits
Increasing popularity of retailer’s house brands
1.6. Financial Analysis
1.6.1. Revenues and Costs
In 2019, Unilever revenues accounted for over €51 million, an increase of around 2% from the previous year. Revenues have been spitted between 3 main geographies, with Europe generating historically around 20% of sales, North and South America 30% and the Rest of the World accounting for almost 50% of sales. The Rest of the world includes Asia, AMET (Africa, Middle East and Turkey), and RUB (Russia, Ukraine and Belarus).
In 2018, the company sold its spreads business as a strategy for growth and response to the shift in consumer preferences. This had an impact on revenues, which decreased in the Food and Beverages segment. Figures 10 and 11 give historical information about revenues per segment. 10 000 20 000 30 000 40 000 50 000 60 000 2015 2016 2017 2018 2019 € mi lli on Year Europe The Americas Asia/ AMET/ RUB
!" !10,000 !20,000 !30,000 !40,000 !50,000 !60,000 2015 2016 2017 2018 2019 €!mi lli on Year Home!Care Foods!&!Refreshment Beauty!&!Personal!Care
Figure 10- Unilever Historic Revenues by Business Line; adapted from Unilever Annual Report
Unilever cost structure is very stable, with costs of goods sold being the main expense, followed by marketing expenses and staff costs. Research and Development accounts for almost 1million euros each year, as one strategy for revenues growth. Figure 12 divides costs by nature and gives historical information.
1.6.3. Key Metrics
Table 5 provides metrics and ratios of Unilever and compares them to the Industry. In terms of profitability, the company has been performing in line with the industry, with 2018 being the year that highly surpassed industry values. With turnover growth average of 1.6% over five years and an operating margin of 16.8% in 2019, Unilever had a cash flow from operating activities of 10.6 billion euros last year, resulting in a net income of over 6 billion euros, a decrease of almost 40% from the previous year.
The year 2018 had an increase of over 50% in net profit, driven by high growth in Asia, especially in Chinese and Indian markets. However, the company faces a challenging market, in particular currency devaluations and rising commodity costs put pressure on demand.
Regarding financial performance, Unilever shows a high return on equity, which reaffirms the company ability to create profit.
In terms of liquidity, the company unveils a historical quick ratio, just as a current ratio lower to their industry median, and below zero. This reveals that the company is unable to meet its short-term obligations if needed. Additionally, in terms of leverage, Unilever has higher ratios than its industry, which indicates the it finances its operations and assets with debt.
-‐ 5,000 10,000 15,000 20,000 25,000 Distribution Costs
Production Costs Materials purchased for resale Other COGS Marketing Expenses SG&A Expenses Reseach and Development
€ million
2019 2018 2017 2016 2015
As also confirmed by the volume of sales, the company has high inventory turnover, which signals the ability to sell goods very quickly and be an industry leader, since this metric is 2x higher that’s its industry.
2015 2016 2017 2018 2019 Industry Median Profitability Gross Margin 48,5% 48,8% 43,2% 43,7% 44,0% 47.8% EBITDA Margin 16,0% 17,1% 21,5% 22,5% 22,9% 18.5% Operating Margin 14,1% 14,8% 16,0% 25,1% 16,8% 15.3% Net Margin 9,9% 10,5% 10,9% 19,3% 11,6% 10.4% Earning Power Asset Turnover 1,06 0,97 0,91 0,83 0,83 0.83 ROE 33,8% 32,6% 36,6% 75,7% 45,8% 15.1% Liquidity Quick Ratio 0,42 0,47 0,55 0,55 0,58 0.95 Current Ratio 0,63 0,68 0,72 0,77 0,78 1.26 Leverage Assets/Equity 3,39 3,45 4,62 5,36 4,91 1.68 Debt/Equity 0,91 1,00 1,97 2,30 2,11 0.17 % LT Debt to Total Capital 32,0% 33,3% 44,4% 59,7% 56,0% 10.4%
Net Debt / EBITDA 1,19 1,30 1,51 1,93 1,87 0.38
Operating
Inv. Turnover 6,5 6,3 7,4 6,9 6,9 3.0
ROIC 17,7% 16,6% 16,1% 25,2% 14,5% -
Table 5- Unilever Historic Key Metrics; retrieved from Eikon Thomson Reuters
Basic Earnings per Share (EPS) and Return on Equity (ROE) evolution can be seen in Figure 13. EPS registered a CARG of 3.39% over the last 5 years, while ROE performed consistently above the industry median (15%), reaching 75% in 2018.
Figure 14 shows the evolution of last five years Dividend Yield. In this period, it registered a CAGR of 1.56% and as of April 2020, it is currently at 3.53%. The company also has a dividend reinvestment plan.
1.82 1.88 2.15 3.49 2.15 33.8% 32.6% 36.6% 75.7% 45.8% 2015 2016 2017 2018 2019 Year Basic.EPS ROE 2.35% 2.40% 2.45% 2.50% 2.55% 2.60% 2.65% 2.70% 2.75% 2.80% 2.85% 2015 2016 2017 2018 2019
Figure 13- Unilever Historic EPS and ROE; retrieved from Eikon Thomson Reuters
1.6.4. Stock Market Performance
Unilever PLC is listed on London Stock Exchange and is constituent of FTSE 100 Index. Unilever NV is listed on Euronext Amsterdam and is constituent of AEX index. The company is also a component of the Euro Stoxx 50. The evolution of the monthly stock prices of last 20 years is represented in Figure 15 and Figure 16.
Unilever NV IPO was on January 1985, while Unilever PLC on August 1939. On September 2019, Unilever PLC reached a highest level of 5324 euros, while Unilever NV a maximum share price of 57 euros. Until the 2008 financial crisis, stocks were with steady
€"# €"1,000.00" €"2,000.00" €"3,000.00" €"4,000.00" €"5,000.00" €"6,000.00" 1/ 1/ 00 10 /1 /0 0 7/ 1/ 01 4/ 1/ 02 1/ 1/ 03 10 /1 /0 3 7/ 1/ 04 4/ 1/ 05 1/ 1/ 06 10 /1 /0 6 7/ 1/ 07 4/ 1/ 08 1/ 1/ 09 10 /1 /0 9 7/ 1/ 10 4/ 1/ 11 1/ 1/ 12 10 /1 /1 2 7/ 1/ 13 4/ 1/ 14 1/ 1/ 15 10 /1 /1 5 7/ 1/ 16 4/ 1/ 17 1/ 1/ 18 10 /1 /1 8 7/ 1/ 19 4/ 1/ 20 Sh ar e"P rice Date €"# €"10.00" €"20.00" €"30.00" €"40.00" €"50.00" €"60.00" 1/ 1/ 00 9/ 1/ 00 5/ 1/ 01 1/ 1/ 02 9/ 1/ 02 5/ 1/ 03 1/ 1/ 04 9/ 1/ 04 5/ 1/ 05 1/ 1/ 06 9/ 1/ 06 5/ 1/ 07 1/ 1/ 08 9/ 1/ 08 5/ 1/ 09 1/ 1/ 10 9/ 1/ 10 5/ 1/ 11 1/ 1/ 12 9/ 1/ 12 5/ 1/ 13 1/ 1/ 14 9/ 1/ 14 5/ 1/ 15 1/ 1/ 16 9/ 1/ 16 5/ 1/ 17 1/ 1/ 18 9/ 1/ 18 5/ 1/ 19 1/ 1/ 20 Sh ar e"P rice Date
Figure 15- Unilever plc Stock Performance History; retrieved from Eikon Thomson Reuters
growth. After recovery from crisis, stocks started to perform incredibly well, growing more than before 2008, which indicates the success of the company in the last 10 years and confidence of shareholders. This is also observed when we look at Figure 17 and see how Unilever performed well above the FTSE 100 index.
As of 22thApril 2020, 36% of the analyst coverage had a hold recommendation and 28% a buy recommendation (Reuters, 2020).
Unilever FTSE 100
CAGR (20y) 8.79% 0.75%
Last year standard deviation 4.71% 2.77%
Last year price change (%) 9.19% 4.55%
Table 5- Unilever vs FTSE Returns
Figure 17- Unilever plc and FTSE 100 Historic Cumulative Returns; retrieved from Eikon Thomson Reuters !100% 0% 100% 200% 300% 400% 500% 600% 1/ 1/ 00 9/ 1/ 00 5/ 1/ 01 1/ 1/ 02 9/ 1/ 02 5/ 1/ 03 1/ 1/ 04 9/ 1/ 04 5/ 1/ 05 1/ 1/ 06 9/ 1/ 06 5/ 1/ 07 1/ 1/ 08 9/ 1/ 08 5/ 1/ 09 1/ 1/ 10 9/ 1/ 10 5/ 1/ 11 1/ 1/ 12 9/ 1/ 12 5/ 1/ 13 1/ 1/ 14 9/ 1/ 14 5/ 1/ 15 1/ 1/ 16 9/ 1/ 16 5/ 1/ 17 1/ 1/ 18 9/ 1/ 18 5/ 1/ 19 1/ 1/ 20 Cu mu lati ve 7Re tu rn s
2. Danone
2.1. Company Overview
Danone is a global company that operates in the food and beverages industry, headquartered in France.
Danone is the leading provider of fresh dairy products and plant-based products worldwide, the leader in advanced medical nutrition in Europe and is the number two in the global ranking of early life nutrition providers and packaged water.
The company sells around 25 brands to 120 countries and employs over 100 thousand people in 55 countries.
Most of Danone’s sales come from three leading brands in the industry: Aptamil, Activia and Danone. Danone’s portfolio covers family favorites’ brands such as the ones represented in Figure 18.
Danone operates primarily in three divisions: i) Essential Dairy and Plant-Based Products (EDP), which produces and distributes fermented dairy products, plant-based and organic products and beverages, including coffee creamers; ii) Waters, which sells bottled water, and iii) Specialized Nutrition that can be divided in two segments, Early Life Nutrition and Advanced Medical Nutrition. The first one produces baby and infant formulas, milk, fruit-based desserts, cereals and baby food. The second, offers adult and pediatric clinical nutrition products related to malnutrition, illness or other causes.
2.2. Culture
Danone stands by ‘One Planet. One Health’ vision and believes in a food revolution to deliver sustainable impact to people and the planet. The company is committed to deliver not only economic but also social progress, by bringing health through food to society. Now more than ever, consumers are concerned with food, but it all started in 1919 when Isaac Carasso sold its first yogurt with bacteria for children with intestinal infections and started to sell its products under Danone name to pharmacies, before joining supermarkets.
Danone “2030 Goals Plan” is based on the UN 2030 Agenda, and its focused on nine goals, splitted between brand model, business model, and trust model of Danone. Under the business model, it aims to grow as a Certified B Corp, innovating to offer superior food experiences. Under the brand model, the company aims to grow their called “Manifesto” brands to protect and nourish both the health of the people and the health of the planet. Based on the trust model, the company will grow in an inclusive way, empowering their people and working with partners to create and share sustainable value.
The company has three social innovation funds to deliver impact: The Danone Ecosystem Fund, Danone Communities and the Livelihoods Fund.
2.3. Strategy and R&D
Being a leader in their business, Danone has built a unique portfolio focused on health which allows them to be a key player in the current market and give response to industry trends. The company has been transforming its portfolio offering to target fast-growing channels. With convenience stores, discounters and e-commerce growing faster than hypermarkets, Danone has been also adapting its products, from single-serve to on-the-go.
With the acquisition of WhiteWave in 2017, that brought plant-based products and beverages to the business, Danone seeks to develop and promote the category as a response to consumer needs. Demand for new sources of protein as well as the growing demand for natural, nutritious and environmentally friendly products is an opportunity to Danone. Danone plans to triplicate its sales in the Plant-based segment, reaching 5 billion euros by 2025.
Specialized Nutrition represents a portfolio of science-based nutritional solutions designed to positively impact health through food, and it is the business that asks for more innovation. Nutricia is a world-class research and development facility in the Netherlands
focused on delivering evidence-based, and specialized nutrition for people of all ages. In 2019, 25% of the sales corresponded to innovation-based products.
Between 4% and 5% of each year sales are reinvested in for organic growth and efficiencies. R&D expenditure accounts for more than 300 million euros per year.
2.4. Structure and Ownership
Danone is owned by mainly institutional investors. Figure 19 represents Danone current ownership. Top 5 institutional investors are MFS Investment Management, BlackRock Institutional Trust Company, Amundi Asset Management, The Vanguard Group and First Eagle Investment Management.
Institutional Investors 77%
Individual Shareholders and "Fonds Danone" FCPE
11%
Treasury Shares and Company Related
6%
Trading and Miscellaneous 6%
2.5. SWOT Analysis
A SWOT analysis was performed to understand where Danone stands within the industry (Table 6).
Strengths Weakness
Popular products (yogurt)
Natural/ organic products
Leader on bottled water
R&D Facilities and Talent
Low growth in Asia
Dependence on retailers
Limited products differentiation
High perishable products
High raw material costs
Focus on premium segments
Opportunities Threats
Business diversification (coffee)
Growth potential in emerging economies
Environmental Policies and Regulations
Fierce competition
Filtered Water
Innovation for health in stronger players
2.6. Financial Analysis
2.6.1. Revenues and Costs
In 2019, Danone revenues accounted for over €25 million, an increase of around 3% from the previous year. Revenues are reported from Europe and North America (Noram) and from the rest of the world, with Europe and Noram generating historically around 55% of sales.
Between 2015 and 2019, revenues grew at a CAGR of 2.44%. Figure 20 and Figure 21 reveal the revenues per business segment and geography for this period.
!" !5,000 !10,000 !15,000 !20,000 !25,000 !30,000 2015 2016 2017 2018 2019 €!mi lli on Year Waters Specialized!Nutrition Dairy!&!Plant"Based !" !5,000 !10,000 !15,000 !20,000 !25,000 !30,000 2015 2016 2017 2018 2019 €!mi lli on Year Rest!of!the!World Europe!&!Noram Figure 14- Danone Historical Revenues by Business Line; adapted from Danone Annual Report
Even though Danone has stable costs (Figure 22), they have been increasing in the most recent years regarding cost of goods sold and general and administrative expenses. This increase in costs is due to the growth of products being sold by the company.
2.6.2. Key Metrics
Table 7 provides metrics and ratios of Danone and compares them to the Industry. In terms of profitability, the company has been outperforming the industry, with 2017 being the most profitable year. With turnover CAGR of 2.44% for last five years and over 25billion euros in sales in 2019, Danone had an operating margin of 12.89% and generated a cash flow from operating activities of more than 3 billion euros last year, resulting in a net income of 2 billion euros.
Regarding financial performance, Danone performed in line with the rest of the industry showing a stable return on equity, which reveals the company ability to create profit.
In terms of liquidity, the company quick ratio and current ratio perform with some variations around industry median, with higher values in 2016. In contrast to the industry, Danone has higher leverage ratios, indicating that it uses more debt than its peers to finance operations and assets.
The company has high inventory turnover, which signals the ability to sell goods very quickly and be an industry leader, since the values are more than 2x higher that’s its industry.
!(2,000) !' !2,000 !4,000 !6,000 !8,000 !10,000 !12,000 !14,000 Cost!of!goods!sold Selling!expense General!and!Administrative!Expense Reseach!and!Development!Expense Other!income!(expense) €!million 2019 2018 2017 2016 2015
2015 2016 2017 2018 2019 Industry Median Profitability Gross Margin 50,00% 51,00% 49,10% 48,40% 49,10% 34.4% EBITDA Margin 16,70% 17,40% 18,80% 18,70% 19,30% 14.3% Operating Margin 9,80% 13,30% 14,90% 11,10% 12,80% 8.4% Net Margin 5,80% 8,30% 9,90% 6,80% 8,20% 5.5% Earning Power Asset Turnover 0,70 0,57 0,56 0,56 0,56 0.81 ROE 10,60% 13,40% 17,80% 15,30% 11,50% 11.4% Liquidity Quick Ratio 0,72 1,96 0,76 0,86 0,73 0.98 Current Ratio 0,72 1,96 0,76 0,86 0,73 1.72 Leverage Assets/Equity 2,59 3,35 3,06 2,70 2,63 2.02 Debt/Equity 0,81 1,57 1,30 1,06 0,98 0.29 % LT Debt to Total Capital 34,20% 54,60% 46,70% 42,30% 37,60% 15.1%
Net Debt / EBITDA 1,68 1,85 2,31 2,92 2,54 0.98
Operating
Inv. Turnover 8,30 7,80 8,30 7,40 6,90 3.8
ROIC 5,80% 6,30% 7,10% 4,90% 6,10% -
Table 7- Danone Historic Key Metrics; retrieved from Eikon Thomson Reuters
Earnings per Share (EPS) and Return on Equity evolution can be seen in Figure 23. EPS registered a CAGR of 7.03% over the last 5 years, while ROE performed consistently above the industry median, with an average of 13.72% during this period, reaching highest value (17.80%) in 2018.
Average dividend yield can be found on Figure 24. In 2019, Danone proposed a payment of €2.10 per share, in line with earnings progression and that the company believes reflects its solid financial position.
2.10 2.79 3.91 3.63 2.95 10.60% 13.40% 17.80% 15.30% 11.50% 2015 2016 2017 2018 2019 Year )EPS ROE 0.00% 0.50% 1.00% 1.50% 2.00% 2.50% 3.00% 3.50% 2015 2016 2017 2018 2019
Figure 17- Danone Historic EPS and ROE; retrieved from Eikon Thomson Reuters