Biometeorology and animal welfare
Available space in feeders for housed sheep: social behavior and performance
José Coriolano Andrade da Silveira1, Vinícius de França Carvalho Fonsêca2* , Dermeval
Araújo Furtado1, Severino Guilherme Caetano Gonçalves dos Santos3, Josinaldo Araújo da
Silva3, Edgard Cavalcanti Pimenta Filho4, Edilson Paes Saraiva3,Ariosvaldo
Nunes de Medeiros4
1 Universidade Federal de Campina Grande, Departamento de Engenharia Agrícola, Campina Grande, PB, Brasil.
2 Universidade Estadual Paulista, Grupo de Inovação em Biometeorologia Animal (INOBIO-MANERA), Jaboticabal, SP, Brasil.
3 Universidade Federal da Paraíba, Departamento de Zootecnia, Grupo de Estudos em Bioclimatologia, Etologia e Bem-Estar Animal, Areia, PB, Brasil.
4 Universidade Federal da Paraíba, Departamento de Zootecnia, Areia, PB, Brasil.
ABSTRACT - This study was designed to assess the effects of feeding space availability on social behavior and performance
of housed crossbreed sheep through the use of three different types of feeders. Thirty-six crossbreed ewes (Santa Inês × Dorper; 2-3 years old) with initial body weight of 34.99±4.28 kg were randomly assigned to a 3 × 3 (feeder type × available space at the feeder) factorial arrangement among nine pens. Pens had one of three feeder types (concrete bunk, plastic, or wood barrel) and one of three amounts of available space in the feeder (0.33, 0.25, or 0.20 m animal−1). Total dry matter intake/pen, dry matter intake per animal, total weight gain/pen, daily weight gain/animal, and food waste were evaluated. Percentage of time spent at feeding and frequency of aggressive behaviors/12 h were recorded. We observed a higher total daily weight gain in ewes with a feeding space of 0.33 and 0.25 m animal−1. The wastes were essentially insignificant for wood feeders in all feeding space treatments. The average number of aggressive behaviors was lower (P< 0.05) for animals kept in pens with feeding space of 0.33 m animal−1 than for those maintained in pens with feeding space of 0.20 and 0.25 m animal−1. Ewes with feeding space of 0.33 m animal−1 fed simultaneously 54% of the time, while among pens with feeding spaces of 0.25 or 0.20 m animal−1, this period was reduced to 41 and 30%, respectively. An available feeding space of 0.33 m animal−1 is recommended for adult housed
ewes, once it favors simultaneous access, lower competitive interactions at the feeder, and less variation in terms of individual weight gain among ewes.
Key Words: dominance relationship, ewes, feeding space, food waste
Introduction
Brazilian livestock practices of domestic sheep (Ovis aries) can differ greatly, ranging from extensive pasture to
intensive indoor system, differing in quantity and quality of space, which largely determine sheep behavior (Sevi et al.,
1999; Estevez et al., 2007; Stafford and Gregory, 2008).
Sufficient available space is essential to assure welfare of
livestock species (Averós et al., 2014; Averós et al., 2016).
In confinement system, food can be a limiting resource when it is provided in a restricted way or when the available space in the feeder is not sufficient for all animals to feed
simultaneously (Estevez et al., 2007). The effects of space
restriction in feeders have been approached in broiler
chickens and laying hens (Estevez et al., 1997; Hughes et al., 1997), dairy and beef cattle (Olofsson, 1999; Miranda-De La Lama et al., 2013), goats (Jorgensen et al., 2007; Van et al., 2007), and sheep (Henderson, 1985; Boe et al., 2006; Boe and Andersen, 2010). These surveys have
reported changes in group behavior, increase in aggressive incidents, and reduction in feed intake and weight gain when evaluating animals with reduced feeding spaces.
In Brazilian semiarid region, goat and sheep farmers use feeders made of wood, plastic barrels, or concrete bunks. The affordable price of the materials is a determining factor
for their choice (Barros et al., 2006; Silva et al., 2010). However, physical aspects, including feeding space, width,
and depth should be considered, since they can affect feed
waste (Martinson et al., 2012; Buskirk et al., 2003) and
competition amongst animals. Feeder recommendations may vary according to breed, sex, and age of animal, and type of
Received: January 25, 2017 Accepted: April 4, 2018
*Corresponding author: [email protected]
Copyright © 2018 Sociedade Brasileira de Zootecnia. This is an Open Access article distributed under the terms of the Creative Commons Attribution License (http://creativecommons.org/licenses/by/4.0/), which permits unrestricted use, distribution, and reproduction in any medium, provided the original work is properly cited.
© 2018 Sociedade Brasileira de Zootecnia ISSN 1806-9290
www.sbz.org.br
R. Bras. Zootec., 47:e20170024, 2018
food or supplement that is offered (Arnold and Maller, 1974; Ítavo et al., 2009; Jorgensen et al., 2007; Boe and Andersen, 2010; Averós et al., 2014). Ítavo et al. (2009) suggested a feeding space of 0.10 to 0.15 m animal−1 for adult sheep in
confined areas to allow simultaneous access for all animals. Boe
and Andersen (2010) recommended 0.35 to 0.45 m animal−1
as the ideal space for housed ewes; Stevens et al. (2005) suggested 0.30 m of depth for adult sheep feeders.
The effects of available space and other physical characteristics of the feeders on social behavior and performance of housed sheep are topics that should be better investigated. Thus, the objective of this study was to assess the effects of feeding space availability on social behavior and performance of housed crossbreed sheep through the use of three types of feeders (wood, plastic barrel, and
concrete bunk). We had predicted that a reduction of feeding
space would increase competitive interactions among sheep and amount of feed waste in the feeders; ewes could have difficulties to feed simultaneously when the space in the feeder was less than 0.33 m animal−1. Moreover, feeders of concrete bunk and plastic barrel would favor greater food waste and competitive interactions among ewes. Results of this study have valuable implications on the management of housed sheep, especially regarding animal welfare and economic efficiency.
Material and Methods
The study was carried out in São João do Cariri, PB, Brasil (7°23' S, 36°32' W, 449 m altitude).
Thirty-six crossbreed ewes (Santa Inês × Dorper; 2-3 years old) with initial body weight of 34.99±4.28 kg were placed in
confinement from November 27, 2013 to January 12, 2014.
The animals were randomly assigned to a 3 × 3 factorial arrangement (feeder type × available space at the feeder). Before the beginning of the experimental phase, ewes were subjected to an adaptation and handling period at the facility for ten days. Nine pens were used, each containing one of three feeder types (concrete bunk, plastic barrel, or
wood) and three, four, or five ewes with fixed stocking rate
of 4.1 m2 animal−1 for all pens.
Pens were built on compacted soil and had an area
covered with clay tile (3.75 m2, 4.95 m2, and 6.15 m2 for
pens with three, four, and five ewes, respectively). Pens contained drinkers made from tractor tires (cut in half) and were separated with wood posts and galvanized wire
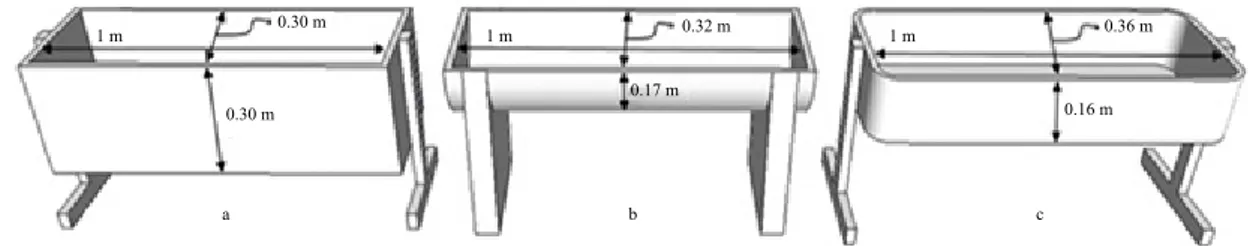
mesh. The feeders had the following dimensions: 1 × 0.30 × 0.30 m for wood feeders, 1 × 0.30 × 0.17 m for concrete bunks, and 1 × 0.30 × 0.16 m for plastic barrels (Figure 1).
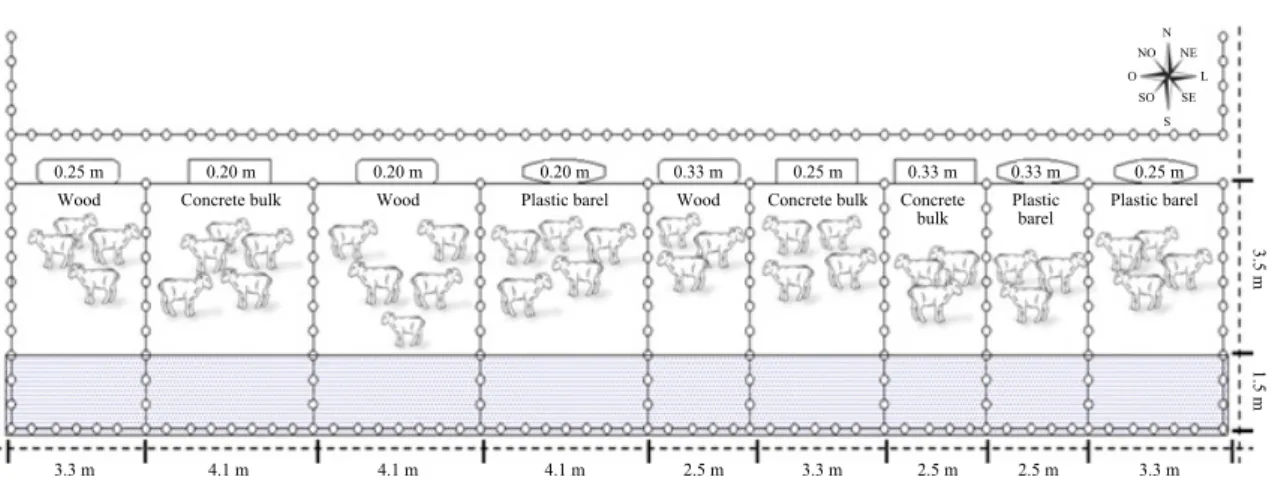
Therefore, the amounts of space in the feeders were 0.33, 0.25, and 0.20 m animal−1 in pens with three, four, and five ewes, respectively (Figure 2). Except for the wood, models of feeder were similar to those used by sheep and goat farmers in the semiarid region of Brazil (Silva et al.,
2010). We tried to represent a recommended design of
wood feeder based on Stevens et al. (2005).
Food was offered ad libitum both at 06:30 and 12:30 h,
and intake was regulated to allow 20% food residue; water was also provided ad libitum. The experimental diet was
formulated to meet the requirements of adult sheep in the
breeding season for a daily gain of 150 g animal−1 (NRC,
1985). The roughage:concentrate ratio was 50:50, and these
were offered as total mixed ration (Tifton hay, corn meal, soy and wheat, and mineral and vitamin supplementation). Leftovers in the feeders and part of the feed that fell on the ground were removed and weighed on an electronic balance for waste (%) estimations, being determined as the ratio between the leftovers collected outside the feeder
and total residues. A 2.0 × 2.0-m rubber mat was placed on
the ground under the feeder, which reached approximately 0.5 m around the feeder (front and sides). The food that fell on the ground and surrounded the feeder was collected
daily at 06:00 and 12:00 h.
Initial and final body weights were determined (kg animal−1) in the beginning and end of the confinement period, respectively. Total dry matter intake (kg pen day−1), estimation of individual dry matter intake (kg animal day−1), total weight gain (kg animal−1), and daily weight gain
a 0.30 m 1 m
0.30 m
0.17 m
0.16 m
0.32 m 0.36 m
1 m 1 m
b c
(g animal day−1) were quantified. Total dry matter intake was obtained by subtracting collected food residues from the amount of offered food daily, in each pen; individual dry matter intake was estimated from the ratio between total intake and the number of animals in each pen; total weight gain was calculated as the difference between the final and initial weights of the animals; and daily weight gain was obtained from the ratio between total weight gain and number of days that animals were confined.
Behavioral observations were performed directly and
continuously by focal animal sampling, from 06:00 to 18:00 h (Martin and Bateson, 1986). Ewes were individually tagged with non-toxic dye (ORBI-6694, Brazil) on both
sides for identification. Nine observations were made in
the initial (December 7, 8, and 9), middle (December 17, 18, and 19), and final (January 6, 11, and 12) confinement phases, totalizing 108 h of records. Platforms that were
4 m above the ground were used to observe the animals
from 6 m away. Observations were performed by twelve
trained people. Before the beginning of the experiment, all observers were subjected to a reliability test.
In this test, observers watched videos of the animals that were taken during adaptation period and recorded
animal activities. At the end of the test, the records from
all observers were compared. The procedure was repeated until a correlation of at least 95% between observations
were obtained (Fonsêca et al., 2014). Recorded behaviors
included percentage of time that ewes spent feeding in each observation and frequency of agonistic behaviors
(calculated as number of times or incidents/12h), which
comprised physical, passive displacements, butting, and
frontal clashing (Table 1). All behaviors were recorded
when animals were at the feeder area.
The normality distribution was checked by examining skewness and kurtosis coefficients. Thus, a general linear
model (GLM proc.) was used to test the fixed effects (space
available and type of feeder) on ewe performance and food waste, using Tukey’s test to verify differences between
treatments following the model:
Yijk = μ + Si + Tj + ST(ij) + e ijk,
in which Yijk =dependent variable; μ = overall mean; Si = fixed effect of feeding space; Tj = fixed effect of feeder type; STij = interaction; and e
ijk = residual term, including
the random error
Non-parametric analyses of the generalized linear
model were used (GLIMMIX proc.) based on restricted
3.3 m 4.1 m 4.1 m 4.1 m 2.5 m 3.3 m 2.5 m 2.5 m 3.3 m
1.5 m
3.5 m
0.25 m
S N
O L
SO SE NO NE
0.33 m 0.33 m
0.25 m 0.33 m
0.20 m 0.20 m
0.20 m 0.25 m
Concrete bulk Wood Plastic barel Wood Concrete bulk Concrete bulk
Plastic barel
Plastic barel Wood
Figure 2 - Layout of the experimental treatments.
Table 1 - Behavioral categories
Behavior Description
Feeding Ewe with the head inside the feeder.
Frontal position Ewe with the body axis directed perpendicularly to the feeder. Lateral position Ewe with the body axis directed parallel to the feeder.
Agressive behaviors
Physical displacements at the feeder Ewe is forced to leave the feed barrier because another ewe is butting or pushing it.
Passive displacement at the feeder Ewe leaves the feed barrier because another ewe is approaching it, but without physical contact. Frontal clashing The agent is rearing onto the hind legs with the head and torso twisted followed by descending forcefully
maximum likelihood (Boykin et al., 2010; Fonsêca et al., 2016) to examine the effects of different types of feeders
and available space in the feeders on animal behavior.
Mean value per group was used as statistical unit. We used
a lognormal response distribution for data recorded as time (time spent feeding) and negative binomial for frequency
(aggressive behaviors) data. All analyses were performed using SAS (Statistical Analysis System, version 9.3)
statistical software.
Results
Interaction between feeding space and feeder type for performance data was not observed. Initial and final body weights of the sheep, as well as total and individual dry matter intake, were similar across all feeder types (all
P>0.05) (Table 2). Higher and lower final body weights
were observed in ewes with feeding spaces of 0.33 and 0.20 m animal−1, respectively. Dispersion was greater (CV, %) among groups with less available space in the feeder
(Table 3). We observed a higher total daily weight gain in
ewes with a feeding space of 0.33 and 0.25 m animal−1.
Additionally, weight gain variation of ewes in pens with
feeding space of 0.20 m animal−1 was more pronounced, as
it was seen by the higher coefficient of variation. Animals
with a greater amount of available feeding space (0.33 m animal−1) consumed more (P<0.05) food.
The amount of total residue was the same in all pens,
no matter the feeder type (P = 0.1542; F(2.20) = 1.32) or
amount of feeding space (P = 0.5212; F(2.32) = 1.01). Total
daily residue ranged from 0.823 to 1.010 kg/pen. On the
other hand, greater percentage of waste was observed in concrete feeders followed by plastic barrel feeders
(P = 0.0001; F(2.18) = 4.32) (Table 4). Waste was essentially
negligible for wood feeders in all feeding space treatments. Furthermore, when feeding space was reduced in pens with concrete and plastic barrel feeders, there was a largest quantity of food waste (P = 0.0050; F(2.78) = 3.38).
Neither the type of feeder (P = 0.1011; F(0.83) = 0.30)
nor the amount of feeding space (P = 0.1450; F(0.90) = 0.45)
influenced the time spent at feeding. The average percentage
of time spent at feeding was 29.33% (2.9 h), 32.66% (3.2 h), and 29.66% (2.96 h) for treatments with feeding
space of 0.33, 0.25, and 0.20 m animal−1, respectively.
However, animals with feeding space of 0.33 m animal−1
fed simultaneously 54% of the time, while this period was
reduced to 41 and 30% in groups with feeding space of 0.25
and 0.20 m animal−1, on average (Table 5).
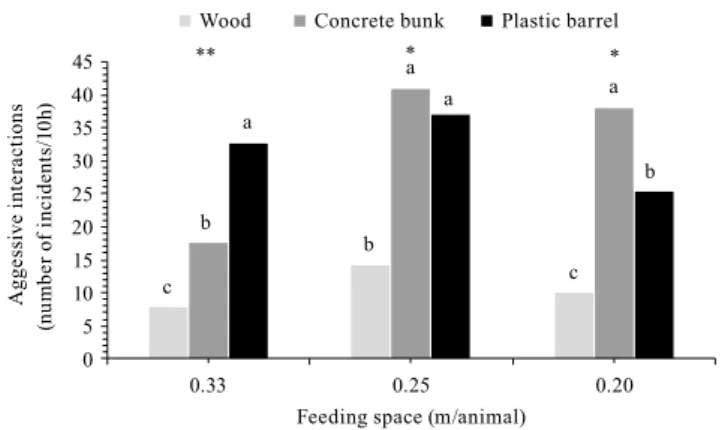
Interaction between feeder type and available space was evidenced through aggressive behaviors (P = 0.0234;
Table 2 - Performance of ewes (±SD) fed in wood, concrete bunk, and plastic barrel feeders
Variable response
Feeder type
P-value F test
Wood
(n = 12) Concrete bunk (n = 12) Plastic barrel (n = 12)
Initial body weight (kg) 35.2±3.3 34.9±2.5 34.8±2.6 0.524 1.19
Final body weight (kg) 42.3±4.1 42.2±3.1 42.2±3.8 0.112 1.10
Weight gaini (g/animal/day) 177.2±15.4 182.2±10.1 180.3±12.1 0.096 0.90
Weight gaint (kg) 7.1±2.9 7.3±2.8 7.23±2.4 0.874 1.08
Dry matter intakei (kg/animal/day) 1.6±0.3 1.7±0.5 1.6±0.3 0.187 1.55
Dry matter intaket (kg/pen/day) 6.2±0.8 6.5±0.6 6.5±0.4 0.106 1.27
i - individual; t - total.
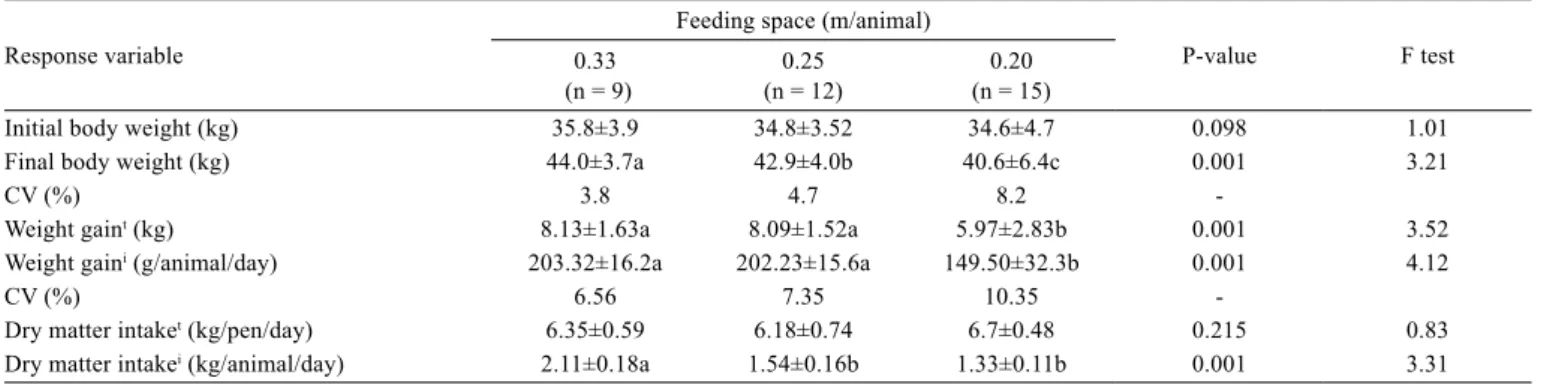
Table 3 - Performance of ewes (±SD) in the different feeding space treatment
Response variable
Feeding space (m/animal)
P-value F test
0.33 (n = 9)
0.25
(n = 12) (n = 15)0.20
Initial body weight (kg) 35.8±3.9 34.8±3.52 34.6±4.7 0.098 1.01
Final body weight (kg) 44.0±3.7a 42.9±4.0b 40.6±6.4c 0.001 3.21
CV (%) 3.8 4.7 8.2
-Weight gaint (kg) 8.13±1.63a 8.09±1.52a 5.97±2.83b 0.001 3.52
Weight gaini (g/animal/day) 203.32±16.2a 202.23±15.6a 149.50±32.3b 0.001 4.12
CV (%) 6.56 7.35 10.35
-Dry matter intaket (kg/pen/day) 6.35±0.59 6.18±0.74 6.7±0.48 0.215 0.83
Dry matter intakei (kg/animal/day) 2.11±0.18a 1.54±0.16b 1.33±0.11b 0.001 3.31
F(0.92) = 2.64 (Figure 3). The average number of aggressive
behaviors was lower (P = 0.0123; F(0.88) = 2.30) for animals
kept in pens with feeding space of 0.33 m animal−1 than for those maintained in pens with feeding space of 0.20 and 0.25 m animal−1. In pens with plastic barrel feeders, the frequency of aggressive behaviors was greater in groups with feeding space of 0.33 m animal−1 than in groups with 0.20 m animal−1. In pens with concrete feeders, ewes competed more when feeding space was decreased to 0.25 and 0.20 m animal−1.
Discussion
The objective of this work was to assess the effects of feeding space availability on social behavior and performance of crossbreed housed sheep with the use of three types of feeders (wood, plastic barrel, and concrete
bunk). As we predicted, space availability in feeders made
of concrete, plastic barrel, and wood influenced social behavior and performance of housed ewes. Furthermore, the design of feeders affected the frequency of aggressive behaviors among ewes and the amount of food waste. Based on our results, feeders with feeding space smaller than 0.33 m animal−1 led to higher levels of aggressive behaviors and lower time spent at simultaneous feeding for
all animals. When the space in feeders was decreased to
0.20 m animal−1, a greater variation in terms of individual
weight gain and final weight and overall decline in performance were observed among animals. Moreover, a minimum percentage of food waste was found in wood feeder, considering all the feeding spaces tested.
Surveys with farmed species have previously documented increases in frequencies of aggressive behaviors, changes in the amount of ingested food, and a decline in performance among animals when space in
feeders was reduced (sheep: Henderson, 1985; Boe and Andersen, 2010; goats: Loretz et al., 2004; Jorgensen et al., 2007; cattle: DeVries et al., 2004; Miranda et al., 2013).
In contrast with these findings, the design and amount of space in feeders of this study did not affect the time that ewes
spent at feeding. For instance, Boe and Andersen (2010)
verified that time housed ewes spent at feeding declined
approximately 27.5% when space in the feeder decreased.
The average percentage of time spent at feeding was 29.33
(2.9 h), 32.66 (3.2 h), and 29.66% (2.96 h) for treatments
with feeding spaces of 0.33, 0.25, and 0.20 m animal−1, respectively.
In a competitive situation, animals of lower rank may prefer to feed when others are not, thus avoiding consequences of agonistic encounters when food is given.
Shinde et al. (2004) and Olofsson (1999) reported that
the easiest way to maintain feeding time when feeding space is reduced would be to consume the feed at different
times throughout the day. Certainly, this may explain the
results of the present investigation. Such changes could be inferred from the percentage of time that all animals fed
simultaneously. According to our findings, animals with
feeding space of 0.33 m animal−1 fed simultaneously 54%
of the time. This percentage decreased to 41 and 30% in
groups with feeding spaces of 0.25 and 0.20 m animal−1,
c
b
c b
a
a
a
a
b
0 5 10 15 20 25 30 35 40 45
0.33 0.25 0.20
Ag
ge
ss
ive
in
teract
io
ns
(n
um
be
r of
in
cident
s/
10
h)
Feeding space (m/animal)
Wood Concrete bunk Plastic barrel
** * *
Lowercase letters represent difference (P<0.05) between feeder type.
* Non-significant (P>0.05) differences between treatment with 0.25 and 0.20 m animal−1. ** Evidenced difference (P<0.05) of the treatment with 0.33 to those with 0.25 and
0.20 m animal−1.
Figure 3 - Frequency of aggressive behaviors (number of times/10 h)
in the experimental treatments.
Table 5 - Number of ewes feeding at the same time (mean±SE; % of total observation)
Number of ewes feeding at the same time (%)
Feeding space (m animal−1)
0.33 0.25 0.20
1 15.74±2.90 10.13±1.34 10.42±3.42 2 30.42±1.23 19.38±0.54 16.41±2.11 3 54.50±2.65 29.49±1.43 18.90±0.85
4 0 41.75±2.87 24.54±0.35
5 0 0 30.05±1.64
SE - standard error.
Table 4 - Estimation of feed waste (%) as a function of feeder type and available space (mean±SE)
Response variable Feeding space (m animal−1)
Waste (%)1 0.33 0.25 0.20
Wood 0.58±0.02aC 0.56±0.03aC 0.73±0.01aC Concrete bunk 44.31±0.13bA 73.55±0.09aA 69.10±1.20aA Platic barrel 34.28±0.88bB 33.61±1.43bB 46.49±1.67aB
SE - standard error.
Means followed by different letters, uppercase in the column and lowercase in the row, are different (P<0.05).
1 Percentage of waste was determined as the ratio of the leftovers collected outside
respectively. Similarly, in studies with dairy cattle, Friend
and Polan (1974) and DeVries et al. (2004) also observed
an increase in simultaneous feeding time when more space was offered in the feeder line. The results of this study do not support the technical recommendation of Ítavo et al. (2009), who suggested that a feeding space for adult sheep
ranging from 0.10 to 0.15 m−1 is sufficient to allow
simultaneous access by all animals. Conversely, the results are consistent with the findings of Boe and Andersen (2010), which recommended 0.35 to 0.45 m animal−1 as the
ideal feeding space for housed ewes.
In the moment of offering feed, animals that have prior access tend to select more digestible and nutritious parts, while subjects that prefer to feed at other times can ingest insufficient amounts and more indigestible portions of food (Shinde et al., 2004), resulting in lower and more variable performance in the group. In a work with housed
dairy goats, Jorgensen et al. (2007) observed that
low-status animals spent less percentage of total observations feeding and more percentage of total observations queuing than high-status goats. This effect was more evident as the feeding space was restricted. In agreement, our findings showed lower and more variable weight gain among ewes when space in the feeder decreased from 0.33 m animal−1 to 0.20 m animal−1. It is likely that dominant animals had
prior access to the feeder at the time of offering feed. Van et al. (2007) stated that the coefficient of variation for
final weights of lambs and goats were higher under space-restricted conditions in the pen.
When enough space is provided in the feeder, animals
avoid violating individual space, which decreases aggressive interactions. In this study, ewes competed less when they
had more space in the feeders. Our results indicated that
the average number of aggressive behaviors was lower for animals kept in pens with feeding space of 0.33 m animal−1 than for those maintained in pens with feeding space of 0.20 and 0.25 m animal−1. The increase in agonistic interactions on feeding in space-restricted conditions is the main cause of changes in the amount of ingested food in some animals in
the group (Estevez et al., 2007). Previous findings with ewes
and goats have also demonstrated an increase in aggressive interactions when space availability in feeders and resting
areas was decreased (Lynch et al., 1989; Boe et al., 2006; Jorgensen et al., 2007; Boe and Andersen, 2010).
Besides the feeding space effect on social behavior and performance of confined ewes, results of this work also showed that feeder design led to differences in the frequency
of aggressive behaviors and percentage of food waste. As
we hypothesized, when feeding space was reduced in pens with concrete and plastic barrel feeders, there was a great
amount of food waste and aggressive interactions. Tested feeders were manufactured from wood, concrete bunks, and plastic barrel. The main difference between them lies
in the depth. Wood feeder had 0.30 m against 0.16 and 0.17 m for concrete bunk and plastic barrel, respectively. Our findings showed that higher frequency of aggressive
behaviors and greater percentage of waste were observed at feeders made of concrete followed by plastic barrels,
especially when feeding space was reduced. On the other
hand, even under reduced feeding space, wood feeders led to practically no food waste and lower levels of aggressive interactions. Daily percentage of waste ranged from 35 to
46% for plastic barrel feeders and 45 to 70% for pens with
concrete feeders, on average. In absolute terms, considering a mean daily waste of 0.500 kg/pen, total losses would
reach 180 kg of food at the end of the confinement period.
This is a relevant concern, because it directly affects payback time and, consequently, the economic efficiency
of the system. Obviously, a refinement in the cost-benefit
ratio of each feeder needs to be included in the economic analyses. For this, longevity and purchase price of feeders should be accounted. Presently, we are unaware of any study on housed sheep that has specifically examined the effects of different feeder designs on behavioral patterns and percentage of feed waste. Previous investigations determined hay waste and economics of nine round-bale feeder designs used in horse feeding (Martinson et al.,
2012). According to these authors, hay waste differed
between round-bale feeder designs. Feeders designed to provide greater physical restrictions resulted in less hay waste compared with feeders that provided easier access to hay. Results of the present study certainly should be attributed to the physical characteristics of the tested feeders, knowing that the depth of wood feeder contributed to lower waste percentage. Thus, such investigation support technical recommendation made by Stevens et al. (2005), who suggested a depth of 0.30 m for feeders for adult sheep in confinement.
Conclusions
An available feeding space of 0.33 m animal−1 is
recommended for adult housed ewes, once it favors simultaneous access, lower competitive interactions at the feeder, and less variation in terms of individual weight gain among ewes.
References
Arnold, G. W. and Maller, R. A. 1974. Some aspects of competition between sheep for supplementary feed. Animal Science 19:309-319. https://doi.org/10.1017/S0003356100022881
Averós, X.; Beltran de Heredia, I.; Ruiz, R. and Estevez, I. 2016. The impact of group size on welfare indicators of ewes during pregnancy. Plos One 11:e0167061. https://doi.org/10.1371/ journal.pone.0167061
Averós, X.; Lorea, A.; Beltran de Heredia, I.; Arranz, J.; Ruiz, R. and Estevez, I. 2014. Space availability in confined sheep during pregnancy, effects in movement patterns and use of space. Plos One 9:e94767. https://doi.org/10.1371/journal.pone.0094767 Barros, N. N.; Bomfim, M. A. D; Almeida, E. M. and Leite, L. A. A.
2006. Saleiro: Cocho para suplementação de caprinos e ovinos. Embrapa Caprino, Sobral. Comunicado Técnico N° 70.
Bøe, K. E. and Andersen, I. L. 2010. Competition, activity budget and feed intake of ewes when reducing the feeding space. Applied Animal Behaviour Science 125:109-114. https://doi.org/10.1016/j. applanim.2010.04.011
Bøe, K. E.; Berg, S. and Andersen, I. L. 2006. Resting behaviour and displacements in ewes — effects of reduced lying space and pen shape. Applied Animal Behaviour Science 98:249-259. https://doi.org/10.1016/j.applanim.2005.10.001
Boykin, D.; Camp, M. J.; Johnson, L.; Kramer, M.; Meek, D.; Palmquist, D.; Vinyard, B. and West, M. 2010. Generalized linear mixed model estimation using PROC GLIMMIX: results from simulations when the data and model match, and when the model is misspecified. p.137-156. In: Conference on Applied Statistics in Agriculture 2010 - 22nd Annual Conference Proceedings. https://doi.org/10.4148/2475-7772.1064
Buskirk, D.; Zanella, A.; Harrigari, T.; Van Lente, J.; Gnagey, L. and Kaercher, M. 2003. Large round bale feeder design affects hay utilization and beef cow behavior. Journal of Animal Science 81:109-115.
DeVries, T. J.; von Keyserlingk, M. A. G. and Weary, D. M. 2004. Effect of feeding space on the inter-cow distance, aggression, and feeding behavior of free-stall housed lactating dairy cows. Journal of Dairy Science 87:1432-1438. https://doi.org/10.3168/ jds.S0022-0302(04)73293-2
Estevez, I.; Andersen, I. and Nævdal, E. 2007. Group size, density and social dynamics in farm animals. Applied Animal Behaviour Science 103:185-204. https://doi.org/10.1016/j. applanim.2006.05.025
Estevez, I.; Newberry, R. and De Reyna, L. A. 1997. Broiler chickens: a tolerant social system. Etologia 5:19-29.
Fonsêca, V. F. C.; Saraiva, E. P.; Arruda, M. F.; Pereira, W. E.; Pimenta Filho, E. C.; Santos, S. G. G.; Amorim, M. L. C. and Silva, A. S. 2016. Mother-offspring relationship in Morada Nova sheep bred in a tropical semiarid environment: A perspective on maternal investment and parental conflict. Applied Animal Behaviour Science 183:51-58. https://doi.org/10.1016/j.applanim.2016.07.002 Fonsêca, V. F. C.; Saraiva, E. P.; Pimenta Filho, E. C.; Furtado, D. A.;
Mariz, T. A. M.; Silva, A. L. S.; Almeida, M. E. V. and Pinheiro, A. C. 2014. Influence of the climatic environment and duration of labor on the mother-offspring interaction in Morada Nova sheep. Journal of Animal Science 92:4123-4129. https://doi.org/10.2527/ jas.2014-7322
Friend, T. H. and Polan, C. E. 1974. Social rank, feeding behavior, and free stall utilization by dairy cattle. Journal of Dairy Science 57:1214-1220. https://doi.org/10.3168/jds.S0022-0302(74)85040-X
Henderson, D. J. 1985. Manger place allowance for feeding big bale silage to housed ewes: a behaviour study. Farm Build Engineer 2:21-24.
Hughes, B. O.; Carmichael, N. L.; Walker, A. W. and Grigor, P. N. 1997. Low incidence of aggression in large flocks of laying hens. Applied Animal Behaviour Science 54:215-234. https://doi. org/10.1016/S0168-1591(96)01177-X
Ítavo, C. C. B. F.; Voltolini, T. V.; Ítavo, L. C. V.; Morais, M. G. and Franco, G. L. 2009. Confinamento. Embrapa Semiárido, Petrolina. Comunicado Técnico N° 13.
Jorgensen, G. H. M.; Andersen, I. L. and Bøe, K. E. 2007. Feed intake and social interactions in dairy goats - The effects of feeding space and type of roughage. Applied Animal Behaviour Science 107:239-251. https://doi.org/10.1016/j.applanim.2006.10.007 Lynch, J. J.; Hinch, G. N; Bouissou, M. F.; Elwin, R. L.; Green, G.
C. and Davies, H. I. 1989. Social organization in young Merino and Merino x Border Leicester ewes. Applied Animal Behaviour Science22:49-63.https://doi.org/10.1016/0168-1591(89)90079-8. Loretz, C.; Wechsler, B.; Hauser, R. and Rüsch, P. 2004. A comparison
of space requirements of horned and hornless goats at the feed barrier and in the laying area. Applied Animal Behaviour Science 87:275-283.
Martin, P. and Bateson, P. 1986. Measuring behaviour: an introductory guide. Cambridge University Press, Cambridge.
Martinson, K.; Wilson, J.; Cleary, K.; Lazarus, W.; Thomas, W. and Hathaway, M. 2012. Round-bale feeder design affects hay waste and economics during horse. Journal of Animal Science 90:1047-1055. https://doi.org/10.2527/jas.2011-4087
Miranda-De La Lama, G. C.; Pascual-Alonso, M.; Guerrero, A.; Alberti, P.; Alierta, S.; Sans, P.; Gajan, J. P.; Villaroel, M.; Dalmau, A.; Velarde, A. and Campo, M. M. 2013. Influence of social dominance on production, welfare and the quality of meat from beef bulls. Meat Science 94:432-437. https://doi.org/10.1016/j. meatsci.2013.03.026
NRC - National Research Council. 1985. Nutrient requirements of sheep. 6th rev. ed. National Academy Press, Washington, DC. Olofsson, J. 1999. Competition for total mixed diets fed for ad
libitum intake using one or four cows per feeding station. Journal of Dairy Science 82:69-79. https://doi.org/10.3168/jds.S0022-0302(99)75210-0
Sevi, A.; Casamassima, D. and Muscio, A. J. 1999. Group size effects on grazing behaviour and efficiency in sheep. Journal Range Management 52:327-331.
Shinde, A. K.; Verma, D. L. and Singh, N. P. 2004. Social dominance-subordinate relationships on a flock of Marwari goats. Indian Journal of Animal Science 74:216-219.
Silva, R. S.; Furtado, D. A.; Azevedo, M. A. and Nascimento, J. W. B. 2010. Instalações para caprinos. Revista Educação Agrícola Superior 25:99-103.
Stafford, K. J. and Gregory, N. G. 2008. Implications of intensification of pastoral animal production on animal welfare. New Zealand Veterinary Journal 56:274-280. https://doi.org/ 10.1080/00480169.2008.36847
Stevens, C.; McFarland, I. and Ashton, B. 2005. Feeding and managing sheep in dry times. Bulletin 4651. Department of Agriculture and Australian Wool Innovation, Western Australia.