Rev. Caatinga, Mossoró, v. 31, n. 1, p. 246 – 254, jan. – mar., 2018
DETERMINATION OF GROWTH AND NUTRIENT ACCUMULATION IN BELLA
VISTA ONION
1CLARICE BACKES2, ROBERTO LYRA VILLAS BÔAS3, LEANDRO JOSÉ GRAVA DE GODOY4, PABLO FORLAN
VARGAS4*, ALESSANDRO JOSÉ MARQUES SANTOS2
ABSTRACT- Knowledge of the nutrient uptake by crops at different stages of growth may provide the basis
for rational application of fertilizers, which may lead to reduced production costs and improved use of fertilizers by plants. Based on this knowledge, we conducted this study to determine the biomass and nutrient accumulation curve of the onion cultivar Bella Vista in a system of transplanted seedlings. The experiment was carried out in Ituporanga–SC, Brazil, by using a randomized block design with three replicates. Eleven plant collections were carried out throughout the crop cycle. The variables evaluated included plant length; total dry biomass of leaves, bulbs, and roots; and concentrations of macro- and micronutrients. The maximum dry
biomass accumulation in the shoots and bulbs at 140 days after transplanting (DAT) was 4.26 and 27.41 mg per plant, respectively, which contributed to 13% and 85% of the whole plant dry biomass at the end of the cycle, respectively. Potassium (K, 521.6 mg) was accumulated in the largest quantity per plant, followed by nitrogen (N, 465.7 mg), calcium (Ca, 253.3 mg), sulfur (S, 109.0 mg), magnesium (Mg, 86.9 mg), and phosphorus (P, 76.5 mg). The micronutrient accumulation was as follows: iron (Fe, 6,227.5 µg), boron (B, 902.3 µg), zinc (Zn, 573.7 µg), manganese (Mn, 573.7 µg), and copper (Cu, 241.4 µg).
Keywords: Allium cepa L.. Growth analysis. Mineral nutrition.
DETERMINAÇÃO DO CRESCIMENTO E ACÚMULO DE NUTRIENTES EM CEBOLA BELLA VISTA
RESUMO - O conhecimento da extração de nutrientes pelas culturas, em diferentes estádios, pode fornecer subsídios para aplicação racional de fertilizantes, resultando na redução dos custos de produção e melhor aproveitamento dos fertilizantes pelas plantas. Desta forma, objetivou-se com este trabalho determinar a curva
de acúmulo de fitomassa e nutrientes para a cebola cv. Bella Vista, em sistema de mudas transplantadas. O experimento foi instalado e conduzido no município de Ituporanga – SC, Brasil, utilizando o delineamento experimental utilizado foi em bloco ao acaso com três repetições. Foram avaliados o comprimento da planta, fitomassa seca total, das folhas, do bulbo e raízes e concentração de macro e micronutrientes. A máxima fitomassa seca de da parte aérea e bulbos aos 140 dias após o transplante foi de 4,26 e 27,41 mg por planta, respectivamente, o que contribuiu para 13% e 85% da massa seca total da planta no final do ciclo, respectivamente. O potássio (521,6 mg) foi acumulado em maior quantidade pela planta, seguido pelo nitrogênio (N, 465,7 mg), cálcio (Ca, 253,3 mg), ensofre (S, 109,0 mg), magnésio (Mg, 86,9 mg) e fósforo (P,
76,5 mg). Para os micronutrientes a ordem de acúmulo foi: ferro (Fe, 6.227,5 µg), boro (B, 902,3 µg), zinco (Zn, 573,7 µg), manganês (Mn, 573,7 µg), e cobre (Cu, 241,4 µg).
Palavras-Chave: Allium cepa L.. Análise de crescimento. Nutrição mineral.
____________________ *Corresponding author
1Received for publication in 07/04/2016; accepted in 04/10/2017.
2Universidade Estadual de Goiás, São Luís de Montes Belos, GO, Brazil; [email protected], [email protected].
3Department of Soils and Environmental Resources, Universidade Estadual Paulista, Botucatu, SP, Brazil; [email protected].
INTRODUCTION
Among the many species of the genus Allium cultivated through olericulture, onion stands out for the consumption quantity and economic value that make it the third most important vegetable in Brazil in terms of economic value, ranking behind potato and tomato crops.
Plant nutrition is one of the several factors influencing the productivity and quality of onion bulbs (KURTZ; ERNANI, 2010). Balanced plant nutrition, attained through the supply of nutrients for the growth and development of plants at different stages of development, is essential for them to express their maximum genetic potential. Excessive use of fertilizers leads to an increase in the occurrence of leaf diseases, soil salinity, and nutrient imbalance, generating unnecessary additional costs. Its deficiency, by contrast, affects the entire development of the plant by changing its physiological and biochemical functions such as the constitution of proteins (N) and nucleic acids (P) and altering the synthesis of carbohydrates (K) and some amino acids (S).
The production of a cultivar results from interactions between the plant and the environment. To understand this interaction, one must measure the plant growth dynamics, in addition to its production. These data are essential for developing the growth and production models of a crop (CHARLO et al., 2011).
Knowledge on the growth of cultivated species enables the planning of rational cultivation methods, thereby contributing to the expression of genetic potential, in addition to providing data for the development of mathematical models describing the growth. This technique is based on the sequential measurement of the dry matter accumulation by the plant and/or its parts (CASTOLDI et al., 2009).
The amount of nutrients absorbed by a crop is a function of the concentration of the nutrient in the dry matter and dry matter production of each plant organ per area unit. Halvorson et al. (2002) found that the dry matter accumulation of onion leaves increased a little after mid-cycle and decreased
thereafter. Vidigal, Pereira and Pacheco (2002), on the other hand, evaluated the growth and nutrient uptake of Alfa Tropical onion (130 days in the summer cycle) and found that the plants growth was slow until mid-cycle and intensified thereafter until
the end of the cycle.
According to studies by Aguiar Neto et al. (2014), the order of nutrient accumulation by the onion was different between cultivars Texas Grano 502 and IPA 11 and in relation to the cultivation site (Petrolina–PE and Baraúna–RN). Of the total nutrients absorbed by the Alfa Tropical onion plant cultivated via seedling transplant, the bulbs accumulated 50.35% nitrogen (N), 83.98% (phosphorus) (P), 53.34% potassium (K), 45.09%
calcium (Ca), 60.00% magnesium (Mg), 56.17% sulfur (S), 84.32% zinc (Zn), 46.89% iron (Fe), 41.01% manganese (Mn), and 9.77% copper (Cu) (VIDIGAL; PEREIRA; PACHECO, 2010).
Based on studies on nutrient uptake conducted in São José do Rio Pardo–SP with cultivars Optima and Superex, May et al. (2008) found that even under similar cultivation conditions, there were differences in nutrient accumulation between both the cultivars.
The amount of nutrients extracted and exported by the crop varies according to the cultivar, yield, soil type, climate, plant density, and management. Hence, it is always necessary to establish the accumulation curves for each new cultivar released under different soil and climatic conditions.
This study was conducted to determine the growth and nutrient accumulation curve of Bella Vista onion in a system of transplanted seedlings.
MATERIAL AND METHODS
The experiment was conducted in Ituporanga–SC, Brazil (27°25ʹ07ʺS and 49°38ʹ46ʺW, 475 m above sea level) from June 6 to November 18, 2011. According to the Köppen classification, the climate is subtropical humid type with hot summers (Cfa). The average annual temperature is 19.0°C, and the average annual precipitation is 1530 mm. It rains year-long in the region, but rainfall is the lowest in
July and the highest in January. In January, the hottest month of the year, the average temperature is 23.4°C, and in June, the average temperature is 14.7°C, which is the lowest. Figure 1 shows the precipitation and temperature data recorded in Ituporanga during the experimental period.
The soil used for planting was classified as a Haplic Cambisol (SANTOS et al., 2006) of medium to clay texture. Soil samples were collected before planting the crop in the 0–20 cm layer. According to the analysis, the soil had the following chemical characteristics: pH (H2O) of 5.9; organic matter of 26 g dm‒3; P (Mehlich) of 6.1 mg dm‒3; H++Al+3, K, Ca, Mg, and cation exchange capacity of 35, 3.2, 74, 41, and 153 mmolc dm‒3, respectively; and base
saturation of 77%.
The experimental design adopted was the randomized block type with three replicates. The treatments included 11 plant collection dates. Each block was composed of a six-row bed; the four
Rev. Caatinga, Mossoró, v. 31, n. 1, p. 246 – 254, jan. – mar., 2018
In this study, we used the short-day onion cultivar Bella Vista (Sakata Seeds®), which has a
super early cycle (135–150 days) and greater tolerance to leaf diseases caused by Phytophthora sp., Alternaria porri,and Botrytis spp. because of the plant’s architecture, firm leaves, and high waxiness. The seedlings were produced in seedling trays (1.2 m width × 30 cm height), transplanted on April 11, 2011.
After the preparation of the beds, fertilizers was applied using 40, 160, and 80 kg ha‒1 N, P
2O5,
and K2O, respectively, employing the 5-20-10 mixed
fertilizer as the source and incorporating the nutrients with a bed shaper. Approximately, 3 g of seeds were used per square meter of bed, generating a population of 600 plants m‒2. The beds were covered with a fine layer of sawdust.
Approximately 25 to 30 days after emergence, topdressing was applied with 38 kg ha‒1 N, 47 kg ha‒1 Ca, and 0.75 kg ha‒1 B, using boron-containing calcium nitrate (30 g kg‒1 B) as source.
The planting area was prepared conventionally by scarifying and harrowing the soil twice. Liming was not necessary because of the high exchangeable base saturation in the soil.
Seedlings were harvested at 66 days after planting, after which all of them had their heights standardized by cutting their upper portion with a machete. The seedlings were transplanted into a definitive area with the naked root on June 06, 2011, with 0.33 m spacing between rows, at 10 plants m‒1, defining a density of 300 thousand plants ha‒1. The furrows for planting were opened with a six-row bed shaper.
During pre-plant fertilization of the furrow, the soil received 40, 160, and 80 kg ha‒1 of N, P
2O5,
and K2O using the 5-20-10 mixed fertilizer.
Topdressings were applied in split sessions throughout the cycle as follows: the first session consisted of 45 kg ha‒1 N, in the form of urea, at
30 DAT; the second session consisted of 35, 43, and 0.7 kg ha‒1 of N, Ca, and B, respectively, in the form of calcium nitrate with boron, at 56 DAT; the third session consisted of 23, 28, and 0.45 kg ha‒1 of N, Ca, and B, respectively, in the form of calcium nitrate and boron, at 80 DAT; the fourth session consisted of 18 kg ha‒1 N, 18 kg ha‒1 K
2O, and
22.5 kg ha‒1 Ca, with the 12
-00-12 mixed fertilizer and 15% Ca, at 95 DAT; and the fifth session consisted of 12 kg ha‒1 N, 12 kg ha‒1 K
2O, and
15 kg ha‒1 Ca, with the 12-00-12 mixed fertilizer and 15% Ca, at 109 DAT.
The total amount of nutrients applied during the crop cycle was 173, 160, 110, 108.5, and 1.15 kg ha‒1 of N, P
2O5, K2O, Ca, and B,
respectively. Additionally, three foliar fertilizations
were performed using manganese phosphate (300 g kg‒1P and 100 g kg‒1 Mn) and zinc phosphate
(400 g kg‒1 P and 100 g kg‒1 Zn) at the rate of 1.5 L ha‒1.
The plants collected on the respective dates were taken to the Laboratory of Plant Analysis at the Department of Soil and Environmental Resources, Faculty of Agricultural Sciences, São Paulo State University (UNESP), located in Botucatu–SP, Brazil. The plant length (distance between the plant pseudostem and the apex of the tallest leaf) was determined using a graduated ruler and bulb diameter was determined using a digital caliper.
After these determinations, the sampled plants were separated into leaves, commercial bulbs (flawless and with a transverse diameter greater than 35 mm), and roots; washed in running water with detergent; and finally washed in deionized water. Next, the material was weighed and dried in a forced-air oven at 65°C until a constant mass for determination of the accumulated dry biomass was reached. Subsequently, the plant material was ground, and the concentrations of nutrients (N, P, K, Ca, Mg, S, B, Fe, Mn, Cu, and Zn) were determined according to the method of Malavolta, Vitti and
0 5 10 15 20 25 30
0 20 40 60 80 100 120 140 160
Jun Jul Aug Sep Oct Nov
A
ir
t
em
pera
ture,
oC
R
ain
fall,
m
m
Precipitation T med. T min. T max.
Oliveira (1997). Based on the results for dry biomass and nutrient concentration, the amounts of nutrients per hectare were calculated, considering the population of 300,000 plants.
The dry biomass and nutrient accumulations throughout the cycle were calculated by adjusting the nutrient accumulations of each evaluation date, using the Sigma Plot graphic program (version 10.0), by the sigmoidal model (y = a/1+ e–(x-xo/b)).
RESULTS AND DISCUSSION
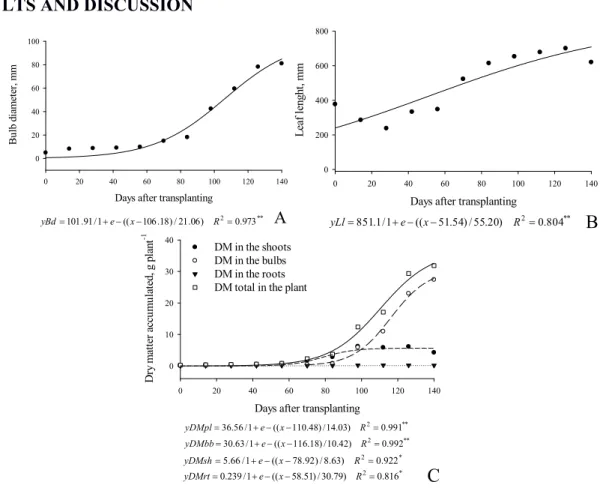
The bulb development was slow until 70 DAT. After this date, it had a more intense growth up to the end of the cycle (Figure 2A). The largest diameter of the bulbs of onion plants (81.0 mm) was obtained at 140 DAT; however, the difference from the previous measurement (126 DAT) was only 2.8 mm. This was due to the end of the harvest and stoppage of bulb growth. At this developmental stage, bulbs stop their cell expansion process and undergo only chemical changes until complete maturation.
Days after transplanting
0 20 40 60 80 100 120 140
B
u
lb
d
ia
m
ete
r,
m
m
0 20 40 60 80 100
* *
2 0.973
) 06 . 21 / ) 18 . 106 (( 1 / 91 .
101
e x R
yBd
A
Days after transplanting
0 20 40 60 80 100 120 140
L
ea
f
le
n
g
h
t,
m
m
0 200 400 600 800
* * 2
804 . 0 ) 20 . 55 / ) 54 . 51 (( 1 / 1 .
851
e x R
yLl
B
Days after transplanting
0 20 40 60 80 100 120 140
D
ry
m
atte
r
ac
cu
m
u
la
te
d
,
g
p
la
n
t
-1
0 10 20 30 40
DM in the shoots DM in the bulbs DM in the roots DM total in the plant
* *
2 0.991
) 03 . 14 / ) 48 . 110 (( 1 / 56 .
36
e x R
yDMpl
* *
2 0.992
) 42 . 10 / ) 18 . 116 (( 1 / 63 .
30
e x R
yDMbb
*
2 0.922
) 63 . 8 / ) 92 . 78 (( 1 / 66 .
5
e x R
yDMsh
C
* 2
816 . 0 ) 79 . 30 / ) 51 . 58 (( 1 / 239 .
0
e x R
yDMrt
Figure 2. Bulb diameter (A), leaf length (B), and dry matter accumulation (C) of Bella Vista onion plants as a function of sampling times. DM = dry matter; pl = plant; bb = bulbs; sh = shoots; rt = roots.
The onion plant length showed a sigmoid behavior (Figure 2B), because at the end of the cycle, the older leaves (the larger so far) entered senescence and started to dry. Because of this reason, measurements were performed in younger but smaller leaves. According to Augostinho et al. (2008), the sigmoid curve depicts best the growth of plants in general, with a slow growth in the initial stage and an intense growth phase later. The onion plants started to develop faster after 56 DAT, showing marked growth up to 112 DAT. The reduction in values of length observed at 14 DAT can be explained by the leaf-cutting practice, which occurred at seedling transplantation (0 DAT).
Initially, the dry biomass was formed by leaves and roots (Figure 2C). From 70 DAT, bulbs started to form, which led to an increase in dry
matter. At 112 DAT, the bulb dry matter (64%) was greater than that of shoots (34%). At the end of the cycle, the plant parts comprised of the following percentages: leaves = 13%, bulbs = 85%, and roots = 2%.
Rev. Caatinga, Mossoró, v. 31, n. 1, p. 246 – 254, jan. – mar., 2018
used.
From seedling transplant to the first harvest, the daily dry matter gain (over 14 days) was 0.01 g. For the other evaluated intervals of 15–28, 29–42, 43–56, 57–70, 71–84, 85–98, 99–112, 113–126, and 127–140 days, the respective daily gains were 0.01, 0.01, 0.02, 0.11, 0.10, 0.62, 0.34, 0.88, and 0.18 g. The maximum dry matter accumulation (0.88 g day‒1
per plant) was observed in the period of 113–126 DAT. After this period, daily dry matter
gain declined again. According to Pôrto et al. (2006), at this stage, the growth of shoots is practically suppressed, and the increase in dry matter of bulbs is
markedly reduced. The first situation is explained by the loss of position of main drain to the bulbs, while the second is caused by the approaching harvest season.
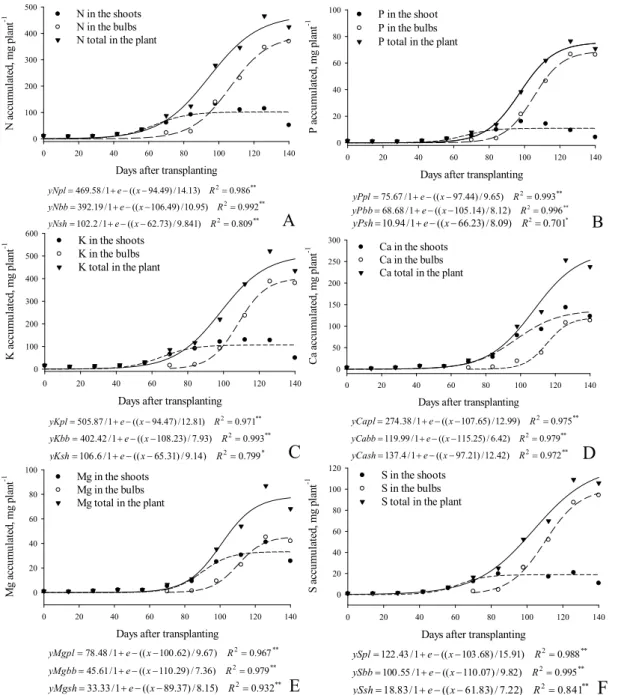
The nutrient uptake curves were similar to the growth curves (Figures 3 and 4). The macronutrients accumulated in the shoots (mg per plant), in descending order, were Ca (143.6), N (132.8), K (129.7), Mg (41.1), S (25.7), and P (16.1). For the micronutrients, the following sequence was observed (µg per plant): Fe (5,173.0), B (255.0), Zn (181.8), Mn (145.2), and B (77.0).
Days after transplanting
0 20 40 60 80 100 120 140
N a cc u m u la te d , m g p la n t -1 0 100 200 300 400 500
N in the shoots N in the bulbs N total in the plant
* *
2 0.986
) 13 . 14 / ) 49 . 94 (( 1 / 58 .
469
e x R
yNpl * * 2 992 . 0 ) 95 . 10 / ) 49 . 106 (( 1 / 19 .
392
e x R
yNbb
* *
2 0.809
) 841 . 9 / ) 73 . 62 (( 1 / 2 .
102
e x R
yNsh
A
Days after transplanting
0 20 40 60 80 100 120 140
P a cc u m u la te d , m g p la n t -1 0 20 40 60 80
100 P in the shoot
P in the bulbs P total in the plant
* *
2 0.993
) 65 . 9 / ) 44 . 97 (( 1 / 67 .
75
e x R
yPpl
* * 2 0.996 ) 12 . 8 / ) 14 . 105 (( 1 / 68 .
68
e x R
yPbb
*
2 0.701
) 09 . 8 / ) 23 . 66 (( 1 / 94 .
10
e x R
yPsh
B
Days after transplanting
0 20 40 60 80 100 120 140
K a cc u m u la te d , m g p la n t -1 0 100 200 300 400 500 600
K in the shoots K in the bulbs K total in the plant
* * 2 971 . 0 ) 81 . 12 / ) 47 . 94 (( 1 / 87 .
505
e x R
yKpl
* *
2 0.993
) 93 . 7 / ) 23 . 108 (( 1 / 42 .
402
e x R
yKbb * 2 799 . 0 ) 14 . 9 / ) 31 . 65 (( 1 / 6 .
106
e x R
yKsh
C
Days after transplanting
0 20 40 60 80 100 120 140
C a ac cu m u la te d , m g p la n t -1 0 50 100 150 200 250 300
Ca in the shoots Ca in the bulbs Ca total in the plant
* *
2 0.975
) 99 . 12 / ) 65 . 107 (( 1 / 38 .
274
e x R
yCapl * * 2 979 . 0 ) 42 . 6 / ) 25 . 115 (( 1 / 99 .
119
e x R
yCabb
* *
2 0.972
) 42 . 12 / ) 21 . 97 (( 1 / 4 .
137
e x R
yCash
D
Days after transplanting
0 20 40 60 80 100 120 140
M g a cc u m u la te d , m g p la n t -1 0 20 40 60 80 100
Mg in the shoots Mg in the bulbs Mg total in the plant
* *
2 0.967
) 67 . 9 / ) 62 . 100 (( 1 / 48 .
78
e x R
yMgpl
* *
2 0.979
) 36 . 7 / ) 29 . 110 (( 1 / 61 .
45
e x R
yMgbb
* * 2 0.932
) 15 . 8 / ) 37 . 89 (( 1 / 33 .
33
e x R
yMgsh
E
Days after transplanting
0 20 40 60 80 100 120 140
S a cc u m u la te d , m g p la n t -1 0 20 40 60 80 100 120
S in the shoots S in the bulbs S total in the plant
* * 2 0.988
) 91 . 15 / ) 68 . 103 (( 1 / 43 .
122
e x R
ySpl
* * 2 0.995
) 82 . 9 / ) 07 . 110 (( 1 / 55 .
100
e x R
ySbb * * 2 841 . 0 ) 22 . 7 / ) 83 . 61 (( 1 / 83 .
18
e x R
ySsh
F
Days after transplanting
0 20 40 60 80 100 120 140
C u a cc u m u la te d , m ic ro g ra m p la n t -1 0 50 100 150 200 250
300 Cu in the shoot
Cu in the bulbs Cu total in the plant
* * 2 0.985
) 02 . 8 / ) 41 . 92 (( 1 / 88 .
234
e x R
yCupl
* * 2 0.996
) 21 . 5 / ) 80 . 101 (( 1 / 91 .
169
e x R
yCubb
B
* * 2 0.811
) 36 . 3 / ) 47 . 77 (( 1 / 52 .
58
e x R
yCush
Days after transplanting
0 20 40 60 80 100 120 140
F e ac cu m u la te d , m ic ro g ra m p la n t -1 0 2000 4000 6000 8000
10000 Fe in the shoot
Fe in the bulbs Fe total in the plant
* * 2 959 . 0 ) 84 . 20 / ) 2 . 377 (( 1 /
283400000
e x R
yFepl
* *
2 0.978
) 01 . 25 / ) 9 . 160 (( 1 /
17340
e x R
yFebb
C
* * 2 976 . 0 ) 88 . 31 / ) 2 . 507 (( 1 /930000000
e x R
yFesh
Days after transplanting
0 20 40 60 80 100 120 140
Z n a cc u m u la te d , m ic ro g ra m p la n t -1 0 200 400 600
800 Zn in the shoot
Zn in the bulbs Zn total in the plant
* * 2 0.975
) 99 . 12 / ) 65 . 107 (( 1 / 38 .
274
e x R
yZnpl
* *
2 0.979
) 42 . 6 / ) 25 . 115 (( 1 / 99 .
119
e x R
yZnbb
D
* * 2 972 . 0 ) 42 . 12 / ) 21 . 97 (( 1 / 4 .137
e x R
yZnsh
Days after transplanting
0 20 40 60 80 100 120 140
M n a cc u m u la te d , m ic ro g ra m p la n t -1 0 50 100 150 200 250
300 Mn in the shoot
Mn in the bulbs Mn total in the plant
* *
2 0.944
) 029 . 14 / ) 84 . 90 (( 1 / 99 .
279
e x R
yMnpl * * 2 973 . 0 ) 38 . 6 / ) 90 . 104 (( 1 / 24 .
161
e x R
yMnbb
E
* *2 0.812
) 60 . 13 / ) 68 . 69 (( 1 / 20 .
110
e x R
yMnsh
F
0 10 20 30 40 50 60 70 80 90 100N P K Ca Mg S B Cu Fe Mn
A cc u m u latio n , % Nutrients Bulbs Leaves
Days after transplanting
0 20 40 60 80 100 120 140
B a cc u m u la te d , m ic ro g ra m p la n t -1 0 200 400 600 800
1000 B in the shoot
B in the bulbs B total in the plant
* *
2 0.997
) 56 . 11 / ) 79 . 101 (( 1 / 81 .
947
e x R
yBpl
* *
2 0.999
) 98 . 8 / ) 89 . 110 (( 1 / 46 .
736
e x R
yBbb
A
* *
2 0.923
) 15 . 8 / ) 48 . 80 (( 1 / 05 .
235
e x R
yBsh
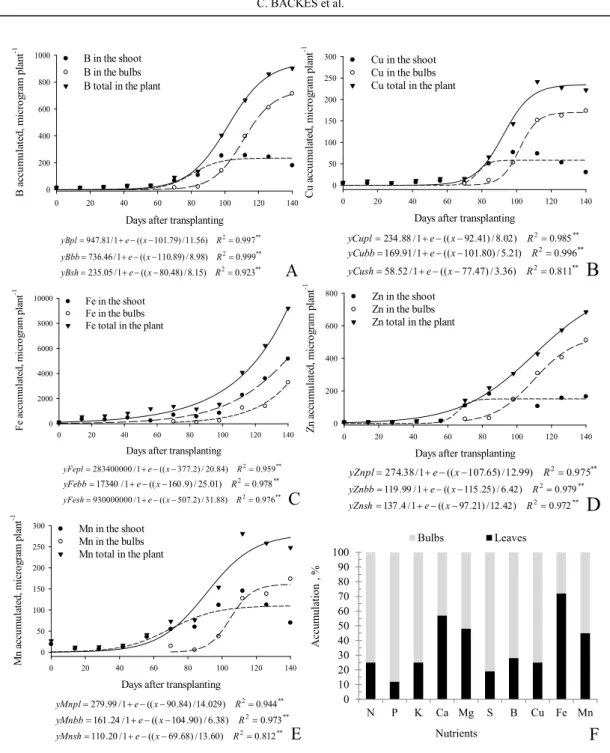
Figure 4. Accumulation of boron (A), copper (B), iron (C), zinc (D), and manganese (E) as a function of sampling dates, and percentage of accumulation of nutrients (F) in the bulbs and leaves of Bella Vista onion plants. pl = plant; bb = bulbs; sh = shoots.
The amounts of nutrients contained in the bulbs differed largely from those in the leaf; in
descending order (mg per plant), they were K = 387.6, N = 369.8, Ca = 113.3, S = 94.3, P = 66.6, and Mg = 45.2. The accumulation sequence
of micronutrients (µg per plant) was Fe = 3,286.5, B = 714.5, Zn = 511.2, Mn = 173.7, and Cu = 173.5. The increase in bulb dry matter had a direct influence on the amount of nutrients in these organs, leading to a larger accumulation of most nutrients in the final collection.
Potassium was the nutrient accumulated in largest amount in the plant (521.6 mg) (Figure 3B). The high K requirement by crops that store organic compounds in the bulbs, as is the case of onion, can
also be explained by its important function in the transportation of photoassimilates from the leaves to the reserve organs (CAKMAK; HENGELER; HOSSAIN, 1994). Nitrogen was the second largest
nutrient accumulated in the onion plants (465.7 mg per plant) (Figure 3A). In the shoots, 56 to
84 DAT can be considered as the period of largest N requirements; in the bulbs, this period was from 94 to 126 DAT. The fact that the bulbs accumulated a larger amount of Nthan the shoots at the end of the cycle can be attributed to the remobilization of the N from shoots to bulbs. As observed by Pôrto et al. (2007), the periods of highest N requirements also differed in both parts of the Superex onion plant.
Rev. Caatinga, Mossoró, v. 31, n. 1, p. 246 – 254, jan. – mar., 2018
plant (shoots + bulbs), in descending order (mg per plant), were Ca = 253.3, S = 109.0, Mg = 86.9, and P = 76.5 (Figure 3). For the micronutrients, the
following order was observed (µg per plant): Fe = 6,227.5, B = 902.3, Zn = 573.7, Mn = 573.7,
and Cu = 241.4 (Figures 4A to 4E).
One method to determine the distribution of nutrients in the plant is to analyze the percentage of nutrients accumulated in the leaves relative to the bulbs (Figure 4F). Quantifying the distribution of nutrients in the plant parts is important for estimating their export and recycling, according to the parts that are removed from the cultivation area. The nutrients N, P, K, Mg, S, B, Cu, Mn, and Zn are accumulated preferably in the bulbs, whereas Ca and Fe are accumulated in the shoots. The quantities exported by the bulbs were N = 104 kg ha‒1 (75%),
P = 20 kg ha‒1 (88%), K = 116 kg ha‒1 (75%),
Ca = 32 kg ha‒1 (43%), Mg = 13 kg ha‒1 (53%), and
S = 26 kg ha‒1 (81%).
The higher percentages of accumulation of P and S in the bulbs in relation to the whole plant were found to be 88% and 81%, respectively. This fact was also observed by Nasreen, Haq and Hossain (2003), who found greater sulfur accumulation in the bulbs at the end of the crop cycle. According to the authors, of the total sulfur accumulated in the whole plant, at 90 DAT, 12% were found in the leaves and 82% in the bulbs. The onion is a high S-demanding
plant, and this nutrient usually occupies the third or fourth position in the descending order of accumulation. Sulfur affects the taste and aroma of condiment greens like onion, chive, and garlic, because it is involved in the constitution of compounds such as methionine, cystine, and cysteine. These amino acids are responsible for the aroma and taste in onion. Vidigal, Moreira and Pereira (2010) found the percentages of P in the bulbs to be greater than 80% (84%).
The maximum amount of macronutrients extracted (in kg ha‒1) in 300,000 plants ha‒1,
referring to the estimated average yield of 86.2 t ha‒1, was N = 139.7, P = 23.0, K = 156.5,
Ca = 76.0, Mg = 26.1, and S = 32.7. For the micronutrients, the maximum extracted amounts were 271, 72, 2760, 84, and 296 g ha‒1 for B, Cu, Fe,
Mn, and Zn, respectively. The amounts of macronutrients accumulated were higher than those found by Vidigal, Moreira and Pereira (2010), Aguiar Neto et al. (2014), and Kurtz et al. (2016), except for P, which was similar to that found in this experiment. The amount of nutrients extracted by the onion plant varies with the obtained yield and with the genetic material cultivated. However, some available cultivars are more efficient in converting nutrients in bulbs than others. Therefore, the
extraction results are rather variable and should be used to calibrate the doses used in fertilization. In the fertilizer recommendations for the onion crop in the state of Santa Catarina (TEDESCO et al., 2004), the maximum recommended N dose is 95 kg ha‒1, which
is lower than the amount of N extracted by cultivar Bella Vista in the present study. Trani, Breda Júnior and Factor (2014) mentioned that the highest yield
from onion was obtained with the N rate of 200 kg ha‒1, which is higher than that used in our
experiment (173 kg ha‒1 N). The application of
135 kg ha‒1 N promoted higher percentages of bulbs
in class-3 onions (RODRIGUES et al., 2015). These
authors also recommend up to 160 kg ha‒1 K2O,
which is lower than the quantity accumulated by the onion plants in the current study (188 kg ha‒1 K2O).
The estimated average yield of 86.2 t ha‒1 was
greater than that obtained by Cecílio Filho et al. (2009) for cultivars Optima and Superex (72 and 79 t ha‒1, respectively) and much higher than that
reported by the same authors for producers in the region of São José do Rio Pardo (45 t ha‒1).
Considering the obtained yield, we can infer that the onion plant extracted approximately 1.6 kg N, 0.3 kg P, 1.8 kg K, 0.9 kg Ca, 0.3 kg Mg, and 0.4 kg S for each ton of bulbs harvested. In this way, it is possible to adjust the amount of nutrients extracted according to the productivity in the region. These rates differ for other cultivation or cultivar conditions, as observed by Bettoni et al. (2016) in organic onion cultivation in the state of Paraná.
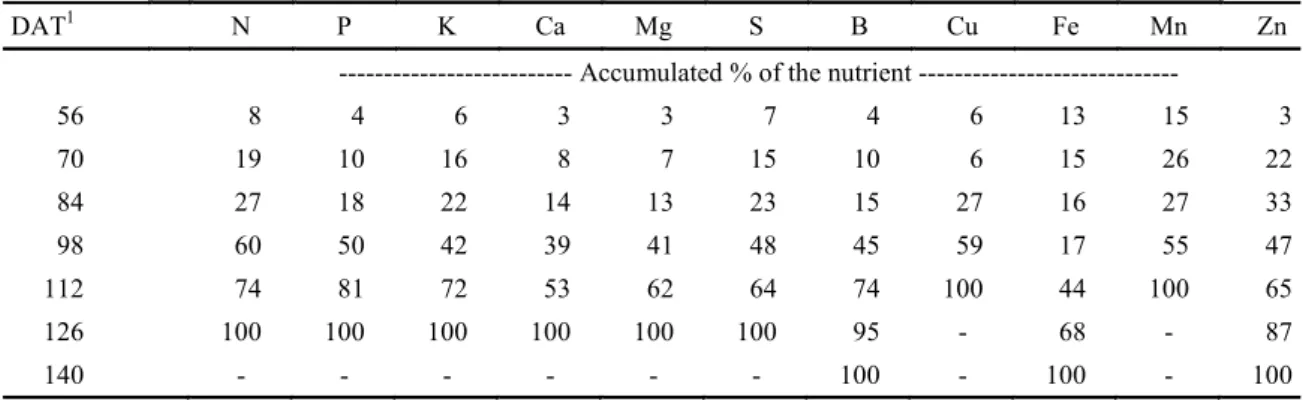
Accumulation was highly intense from 84 to 98 DAT and less intense from 99 to 112 DAT and 113 to 126 DAT (Table 1). Until 70 DAT, the accumulation of macronutrients did not exceed 19% of the total (N), whereas micronutrient accumulation reached its maximum in this period, with manganese constituting 26% of the total accumulation. Among the nutrients, only B, Fe, and Zn continued to accumulate from 126 to 140 DAT, while Cu and Mn reached the maximum accumulation at 112 DAT.
Table 1. Percentage distribution of nutrients accumulated in Bella Vista onion plant as a function of the crop cycle.
DAT1 N P K Ca Mg S B Cu Fe Mn Zn
--- Accumulated % of the nutrient ---
56 8 4 6 3 3 7 4 6 13 15 3
70 19 10 16 8 7 15 10 6 15 26 22
84 27 18 22 14 13 23 15 27 16 27 33
98 60 50 42 39 41 48 45 59 17 55 47
112 74 81 72 53 62 64 74 100 44 100 65
126 100 100 100 100 100 100 95 - 68 - 87
140 - - - 100 - 100 - 100
1Days after transplanting.
CONCLUSIONS
The growth and nutrient accumulation curves of onion cultivar Bella Vista fit the sigmoidal model.
Potassium was the nutrient accumulated in largest quantity per plant (521.6 mg), followed by N (465.7 mg), Ca (253.3 mg), S (109.0 mg), Mg (86.9 mg), P (76.5 mg), Fe (6,227.5 µg), B (902.3 µg), Zn (573.7 µg), Mn (573.7 µg), and Cu (241.4 µg).
ACKNOWLEDGMENTS
On behalf of Mr. Ricardo Lima dos Santos and Mr. Rômulo Fujito Kobori, we wish to thank Sakata Seeds.
REFERENCES
AGUIAR NETO, P. et al. Crescimento e acúmulo de macronutrientes na cultura da cebola em Baraúna
(RN) e Petrolina (PE). Revista Brasileira de Engenharia Agrícola e Ambiental, Campina
Grande, v. 18, n. 4, p. 370-380. 2014.
AUGOSTINHO, L. M. A. et al. Acúmulo de massa seca e marcha de absorção de nutrientes em mudas de goiabeira ‘Pedro Sato’. Bragantia,Campinas, v.
67, n. 3, p. 577-585. 2008.
BETTONI, M. M. et al. Extração e partição de nutrientes em cebola cultivada no sistema orgânico.
Revita Ceres, Viçosa, v. 63, n. 5, p. 683-690. 2016.
CAKMAK, I.; HENGELER, C.; MARSCHNER, H. Changes in phloem export of sucrose in leaves in response to phosphorus, potassium and magnesium deficiency in bean plants. Journal of Experimental Botany, Lancaster, v. 45, n. 9, p. 1251-1257. 1994.
CASTOLDI, R. et al. Crescimento, acúmulo de nutrientes e produtividade da cultura da couve-flor.
Horticultura Brasileira, Brasília, v. 27, n. 4, p. 438
-446. 2009.
CECÍLIO FILHO, A. B. et al. Crescimento da cebola em função de doses de nitrogênio, potássio e da população de plantas em semeadura direta.
Horticultura Brasileira, Brasília, v. 27, n. 1, p. 49
-54. 2009.
CHARLO, H. C. O. et al. Growth analysis of sweet pepper cultivated in coconut fiber in a greenhouse.
Horticultura Brasileira, Brasília, v. 29, n. 3, p. 316
-323. 2011.
CHARLO, H. C. O. et al. Accumulation of nutrients in sweet peppers cultivated in coconut fiber.
Horticultura Brasileira, Brasília, v. 30, n. 1, p. 125
-131. 2012.
HALVORSON, A. D. et al. Nitrogen fertilizer use efficiency of furrow-irrigated onion and corn. Agronomy Journal, Madison, v. 24, n. 3, p. 442
-449. 2002.
KURTZ, C.; ERNANI, P. R. Produtividade de
cebola influenciada pela aplicação de
micronutrientes. Revista Brasileira de Ciência do Solo, Viçosa, v. 34, n. 1, p. 133-142. 2010.
KURTZ, C. et al. Crescimento e absorção de nutrientes pela cultivar de cebola Bola Precoce.
Horticultura Brasileira, Brasília, v. 34, n. 2, p. 279 -288. 2016.
MALAVOLTA, E.; VITTI, G. C.; OLIVEIRA, S. A.
Avaliação do estado nutricional das plantas: princípios e aplicações. 2. ed. Piracicaba, SP:
POTAFOS, 1997. 319 p.
Rev. Caatinga, Mossoró, v. 31, n. 1, p. 246 – 254, jan. – mar., 2018
NASREEN, S.; HAQ, S. M. I.; HOSSAIN, M. A. Sulphur effects on growth responses and yield of onion. Asian Journal of Plant Sciences, Dubai, v. 2, n. 12, p. 897-902. 2003.
PÔRTO, D. R. Q. et al. Acúmulo de macronutrientes pela cebola ‘Optima’ estabelecida por semeadura direta. Horticultura Brasileira, Brasília, v. 24, n. 4, p. 470-475. 2006.
PÔRTO, D. R. Q. et al. Acúmulo de macronutrientes pela cultivar de cebola "Superex" estabelecida por semeadura direta. Ciência Rural, Santa Maria, v. 37, n. 4, p. 949-955. 2007.
RODRIGUES, G. S. O. et al. Qualidade de cebola em função de doses de nitrogênio e épocas de plantio. Revista Caatinga, Mossoró, v. 28, n. 3, p. 239-247. 2015.
SANTOS, H. G. Sistema brasileiro de classificação de solos. Rio de Janeiro, RJ: EMBRAPA-SPI, 2006.
306 p.
VIDIGAL, S. M.; PEREIRA, P. R. G.; PACHECO, D. D. Nutrição mineral e adubação de cebola. In: LACERDA, V. (Ed.). Informe Agropecuário, Belo
Horizonte, v. 23, n. 218, p. 36-50, 2002.
VIDIGAL, S. M.; MOREIRA, M. A.; PEREIRA, P. R. G. Crescimento e absorção de nutrientes pela planta cebola cultivada no verão por semeadura direta e por transplantio de mudas. Bioscience Journal, Uberlândia, v. 26, n. 1, p. 59-70. 2010.
TEDESCO, M. J. et al. Manual de adubação e de calagem para o Estado do Rio Grande do Sul e Santa Catarina. Porto Alegre, RS: SBCS/Núcleo
Regional Sul, UFRGS, 2004. 400 p.
TRANI, P.; BREDA JÚNIOR, J. M.; FACTOR, T. L. Calagem e adubação da cebola (Allium cepa
L.). Campinas, SP: Instituto Agronômico de
Campinas, 2014. 35 p.