Rev. Caatinga
EROSIVE PROCESS CONTROL IN THE BRAZILIAN SEMIARID REGION
1JÚLIO CÉSAR NEVES DOS SANTOS2*, EUNICE MAIA DE ANDRADE3, HELBA ARAÚJO DE QUEIROZ
PALÁCIO4, JOSÉ RIBEIRO DE ARAÚJO NETO3, JACQUES CARVALHO RIBEIRO FILHO5
ABSTRACT – The adoption of measures to prevent and control erosive processes requires information about the factors affecting the erosion and the sediment transport conditions. However, the sediment yield of a basin depends on the availability of eroded material and the sediment transport capacity. Thus, the objective of this study was to identify the factors that affect the sediment transport capacity at different spatial scales in an area with caatinga vegetation. The study was carried out in the Iguatu Experimental Basin, in the state of Ceará, Brazil, from 2009 to 2014, by monitoring two scale levels: watershed with 2.06 ha, and erosion plot with 20 m². The variables evaluated for the rainfall events were precipitation, intensity of rainfall, antecedent soil moisture, precipitation of the antecedent five days, consecutive dry days, peak flow, runoff depth, and sediment yield. During the study period, 263 rainfall events (>2 mm) and 86 events generating runoff were recorded. Three Principal Components (PC) were developed using the Principal Component Analysis, which explained more than 79% of the total variance. Variables connected to the kinetic energy capacity of the rainfall to disaggregate soil particles, the energy for sediment transport, and the soil water content were framed in the CP1, CP2, and CP3, respectively. In the evaluated scales, the sediment yield presented a high correlation with the runoff depth, which indicates limiting conditions for sediment yield by the mass flow energy.
Keywords: Hydrology. Water erosion. Sediment yield.
FATORES CONTROLADORES DE PROCESSOS EROSIVOS NO SEMIÁRIDO BRASILEIRO
RESUMO- A adoção de medidas preventivas ou de controle dos processos erosivos requer um entendimento
não somente dos fatores que influenciam a erosão, mas também das condições de transporte. Contudo a produção de sedimentos de uma bacia é função da disponibilidade de material erodido e da capacidade de transporte. Assim, objetivou-se com esse estudo identificar os fatores relacionados com a capacidade de transporte de sedimentos em área com vegetação de caatinga, em escalas espaciais distintas. O estudo foi desenvolvido na Bacia Experimental de Iguatu, Ceará, com monitoramento nas escalas de microbacia com 2,06 ha e parcela de 20 m2. As variáveis investigadas no período de 2009 a 2014 foram: altura pluviométrica,
intensidades das chuvas, umidade antecedente do solo, precipitação antecedente dos últimos 5 dias, dias consecutivos secos, vazão de pico, lâmina escoada e produção de sedimentos. No período de estudo foram registrados 263 eventos de chuvas (> 2 mm) e 86 eventos geradores de escoamento. Com auxílio de Análises das Componentes Principais, foram formadas três Componentes Principais (CP) explicando mais de 79 % da variância total. Nas CP1, CP2 e CP3 foram enquadradas, respectivamente, variáveis relacionadas ao poder energético da chuva em desagregar partículas de solo; a energia para o transporte de sedimentos e ao conteúdo de água no solo. Nas escalas estudadas a produção de sedimentos apresentou elevada correlação com a lâmina escoada, indicando condições limitantes de produção de sedimento pela energia do fluxo de massa.
Palavras-chave: Hidrologia. Erosão hídrica. Produção de sedimentos.
____________________ *Corresponding author
1Received for publication in 01/19/2017; accepted in 08/07/2017.
2Departament of Education, Instituto Federal do Triângulo Mineiro, Uberlândia, MG, Brazil; [email protected] – ORCID: 0000
-0001-9466-5158.
3Agricultural Engineering Departament, Universidade Federal do Ceará, Fortaleza, CE, Brazil; [email protected] – ORCID: 0000-0002
-9750-0364; [email protected] – ORCID: 0000-0001-7118-1644.
4Departament of Education, Instituto Federal do Ceará, Iguatu, CE, Brazil; [email protected] – ORCID: 0000
-0002-5105-4821.
5Departament of Environmental and Tecnological Sciences, Universidade Federal Rural do Semi-Árido, Mossoró, RN, Brazil;
INTRODUCTION
Soil degradation is a serious worldwide problem, especially in arid and semiarid regions (WANG et al., 2016), because of the limiting natural resources in these environments. The effects of soil erosion include reduced fertility (BAKKER et al., 2005; CERDAN et al., 2010), reduced soil water storage capacity (SANTOS et al., 2016), and pollution and sedimentation of bodies of water (BAKKER et al., 2005; DE ARAÚJO; GUENTNER; BRONSTERT, 2006; SANTOS et al., 2014). Negative factors such as these can cause land to be abandoned, and lead to the decline of rural communities (BAKKER et al., 2005), because of their economic, social, cultural, productive, and environmental effects.
It is impossible to directly transfer soil loss data linearly between scales due to the predominance of different processes connected to the generation of runoff, disintegration, and sediment transport in a specific spatial scale (CAMMERAAT, 2002; SANTOS et al., 2016). In large slope scales, processes such as the formation of ravines and gullies intensify sediment yield (POESEN et al., 2003), while vegetation barriers and areas with low slopes can cause the deposition of part of the transported sediments (FRYIRS et al., 2007). In river basin scales, sediment yield is strongly affected by the conditions of its transport, which highlights the deposition processes (GARCIA-ESTRINGANA et al., 2013).
Sediment transport in small watersheds is more dependent on some extreme events than in larger basins where the effects of hydrological and sedimentological connectivity are more complex, according to González-Hidalgo, Batalla e Cerda (2013). An adequate description of the sediment flows requires an understanding of the factors that affect the erosion and transport conditions of the eroded material; this is necessary for the adoption of measures to prevent and control erosion (MEDEIROS et al., 2010).
Identifying the main cause of sediment transport limitation and its effects on scales is one of the main problems for the description and modeling of sediment transport in arid and semiarid regions. Researchers must define the most significant variables to portray the problem by using appropriate statistical methods. Thus, it is necessary to use techniques that can systematically summarize the significant correlation existing in multivariate processes (ELMI et al., 2004; ANDRADE et al., 2008; GUEDES et al., 2010; AMANAJÁS; BRAGA; 2012), such as the sediment transport. According to Medeiros et al. (2010), an accurate assessment of the sediment’s flow along its trajectory is important to identify potentially erosive
areas and sites where deposition processes are predominant.
However, the identification of determining factors of sediment transport processes is difficult and understudied. Therefore, a series of data – with many variables involved in the processes, such as different spatial and biomes – is essential. Thus, the objective of this study was to identify the factors that affect sediment transport capacity at different spatial scales in a semiarid region with caatinga vegetation in Ceará, Brazil.
MATERIAL E METHODS
The study was carried out in the Iguatu Experimental Basin (IEB), located in the municipality of Iguatu, in the state of Ceará, Brazil (6°23'36'' to 6°23'57''S and 39°15'15'' to 39° 15'30''W). The region’s climate is BSh’w’ (hot semiarid), according to the Köppen classification, with an average temperature always above 18ºC, even in the coldest month. The aridity index, according to Thornthwaite is 0.44 and classified as semiarid. The average potential evapotranspiration is 1,988 mm year-1. The average historical precipitation
from 1932 to 2013 is 864±304 mm with 85 % concentration in January-May and 30% um March; therefore, the rainfall concentration is expressed during these five months out of the year.
The predominant soil type in the evaluated watershed was classified, directly by trench opening, as typical carbonate ebony Vertisol. The soil presentes high silt (42.5%) and clay (26%) contenst in its surface and subsurface layers. Surface cracks develop during dry periods due to the montmorillonite clay. The rainfall data were obtained from an automatic meteorological station placed in the study area with data acquisition every 5 minutes. The kinetic energy (KE) (MJ ha-1 mm-1)
associated with the rainfall was calculated from the precipitation data by using the equation proposed by Wischmeier and Smith (1978) and modified by Foster et al. (1981):
(1) Wherein:
KE is the kinetic energy of the rainfall (MJ ha-1 mm-1);
I is the average intensity of the rainfall (mm h-1).
The values obtained by the equation (1) were used to calculate the erosivity index EI30 from the following equation:
(2) Wherein:
EI30 is the erosivity index (MJ mm ha-1 h-1);
I30máx is the average maximum rainfall
intensity in 30 minutes (mm h-1); KE =0.119+0.0873 Log I
Rev. Caatinga
P is the amount of the rainfall (mm).
This study was carried out for six years from 2009 to 2014, in which 293 rainfall events (> 2 mm) were recorded and 86 of these events generated runoff. The hydrosedimentological processes occur in different ways at different spatial scales; thus, the measurements of runoff and sediment yield were quantified at two different levels of scale: watershed with area pf 2.06 ha and erosion plot with 20 m².
Watershed
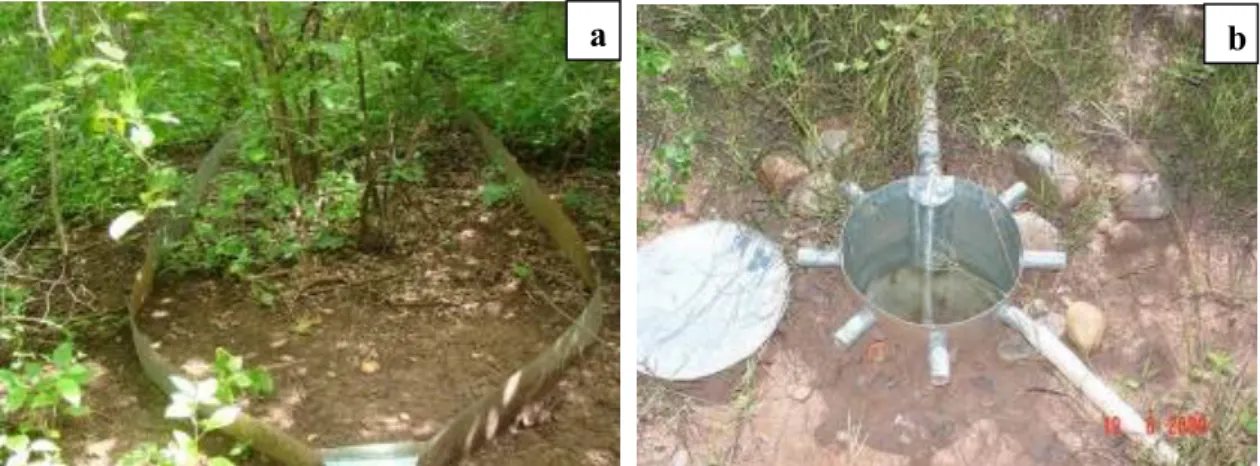
The evaluated watershed was maintained with a typical caatinga vegetation cover with regeneration for over 35 years (Figure 1). Surface runoff and soil losses were monitored by using a hydrosedimentological by using a glass-fiber Parshall flume with water level monitored by a logger that records the height of the water every 5 min.
a
b
Figure 1. The experimental watershed with a typical caatinga vegetation cover with regeneration for over 35 years in the rainy season (a) and dry season (b).
A collection tower for suspended sediments was installed upstream of the Parshall flume, in order to quantify the watershed solid discharge in suspension (Figure 2a). This tower had 100 mL bottles disposed equidistant at 0.075 m; the first one was placed 0.15 m from the soil. The samples were collected soon after events that generated sufficient surface runoff for the water to reach the height of the tower opening for collection. The soil losses due to
the dragged sediment in the watershed bed were measured with a pit that was 1 m long, 0.4 m wide, and 0.462 m deep to collect and retain the entire volume of dragged sediments. This pit was installed upstream of the flume and had a total capacity of 185 L (Figure 2b). After the events that generated runoff, the water was homogenized with sediments in the pit, and a sample was collected.
b a
Figure 2. The tower to collect suspended sediments (a) and pit to collect dragged sediments in the watershed bed (b).
Erosion plot with 20 m2
The surface runoff and erosion were quantified in an experimental erosion plot with an area of 20 m² (2x10m); the largest length obeyed the
system, which consisted of three tanks with capacity of 30 L, 100 L, and 200 L. The first tank (Figure 3b) was composed of seven-window system. After filling the first tank, 1/7 of the surface runoff the plot was piped to the second tak; once it was filled, the surplus was conducted to the third tank.
Data analysis
The identification of the agents determining the variability of the erosive processes and the sediment transport capacity at the two spatial scales was performed using the multivariate statistical model: Factor Analysis (FA) / Principal Component Analysis (PCA).
a
b
Figure 3. Plot of 20 m² (a) installed in the experimental watershed with a typical caatinga vegetation cover with regeneration for over 35 years, from the Iguatu Experimental Basin (IEB); first collector tank (b).
The variables evaluated for the rainfall events were precipitation (PPT; mm); maximum intensities in 5 min (I5), 10 min (I10), 15 min (I15), 20 min (I20), 30 min (I30), 45 min (I45), and 60 min (I60)
(mm h-1); rainfall erosivity index (EI30;
MJ mm ha-1 h-1); antecedent soil moisture based on
mass (ASM; %); precipitation of the antecedent five days (PPT5; mm); consecutive dry days (CDD; days with PPT < 1 mm); peak flow (Qmax; L s-1); runoff
depth (RD; mm); sediment yield (SY; kg ha-1).
The original data – in matrix form – were expressed by: X – (xij), wherein I = 1…n samplings
and j = 1…p variables. In the application of the FA/PCA technique, the first step is to transform the original data matrix into a correlation matrix [R] (pxp) with p equal to the 15 variables evaluated in this study. The main reason to use the correlation matrix is to eliminate the problem of scales and differentiated units in which the variables are measured. The efficiency of the new data description through the component will depend on the percentage of total variation that each component contains, which is represented by the eigenvalues (MOITA NETO, 1997).
The purpose of the PCA was to obtain components that help explain the correlations. Therefore, after the definition of the correlation matrix, an inspection was performed between the variables to identify the most specific. The general consistency of the data was measured by the Kayser Mater Olkim (KMO) method; this method compares the magnitude of the observed correlation coefficients with the partial correlation coefficients,
2007). A KMO < 0.5 indicates that the model does not apply to the data under study (NORUSIS, 1990). The selection of the number of components extracted followed the precepts presented by Norusis (1990), in which only components with variance greater than 1 are considered. This criterion is because any factor must explain a variance higher than what is presented by a simple variable.
The results can be difficult to interpret, even with the components matrix obtained in the extraction phase, in which the result describes the relationship between the factors and the individual variables. To overcome this limitation, the orthogonal transformation procedure – or, simply, the rotation of the matrix of factorial loads – was used to generate a new matrix of factorial loads, which presents a better interpretative, meaning to the factors. Thus, this study used the orthogonal rotation, Varimax method, which is widely used in the evaluation of the spatial and temporal variability of water quality (ANDRADE et al., 2007).
RESULTS AND DISCUSSION
Rev. Caatinga (2004) in studies on water quality.
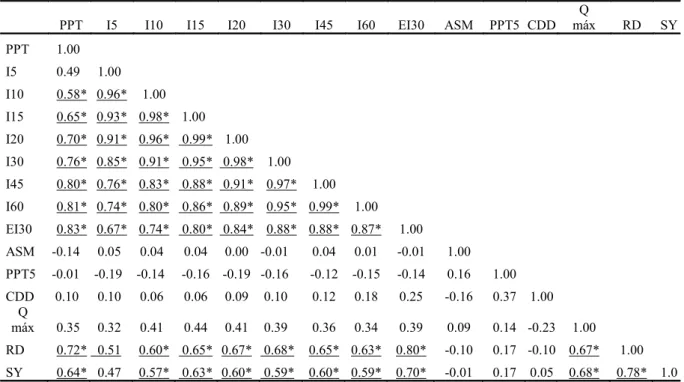
The correlation matrix of the variables evaluated for the watershed (Table 1) presented a high correlation (p < 0.001) of Sediment yield (SY) with Runoff Depth (RD) of 0.78. The SY also presented a good correlation with the Peak Flow (Qmax), which indicated the dependence of the
sediment transporto n the mass flow energy. Higher runnof depths may lead to an increased transport energy, which-with disaggregated sediments – increases the SY (PENG; WANG, 2012; GARCIA-ESTRINGANA et al., 2013; SANTOS et al., 2016).
Table 1. Correlation matrix of the variables related to the hydrosedimentological processes in the scale of the watershed.
PPT I5 I10 I15 I20 I30 I45 I60 EI30 ASM PPT5 CDD
Q
máx RD SY
PPT 1.00
I5 0.49 1.00
I10 0.58* 0.96* 1.00
I15 0.65* 0.93* 0.98* 1.00
I20 0.70* 0.91* 0.96* 0.99* 1.00
I30 0.76* 0.85* 0.91* 0.95* 0.98* 1.00
I45 0.80* 0.76* 0.83* 0.88* 0.91* 0.97* 1.00
I60 0.81* 0.74* 0.80* 0.86* 0.89* 0.95* 0.99* 1.00
EI30 0.83* 0.67* 0.74* 0.80* 0.84* 0.88* 0.88* 0.87* 1.00
ASM -0.14 0.05 0.04 0.04 0.00 -0.01 0.04 0.01 -0.01 1.00
PPT5 -0.01 -0.19 -0.14 -0.16 -0.19 -0.16 -0.12 -0.15 -0.14 0.16 1.00
CDD 0.10 0.10 0.06 0.06 0.09 0.10 0.12 0.18 0.25 -0.16 0.37 1.00 Q
máx 0.35 0.32 0.41 0.44 0.41 0.39 0.36 0.34 0.39 0.09 0.14 -0.23 1.00
RD 0.72* 0.51 0.60* 0.65* 0.67* 0.68* 0.65* 0.63* 0.80* -0.10 0.17 -0.10 0.67* 1.00
SY 0.64* 0.47 0.57* 0.63* 0.60* 0.59* 0.60* 0.59* 0.70* -0.01 0.17 0.05 0.68* 0.78* 1.0
PPT – precipitation (mm); I5 – maximum intensity in 5 min (mm h-1); I10 – maximum intensity in 10 min (mm h-1); I15 – maximum intensity in 15 min (mm h-1); I20 – maximum intensity in 20 min (mm h-1); I30 – maximum intensity in 30
min (mm h-1); I45 – maximum intensity in 45 min (mm h-1); I60 – maximum intensity in 60 min (mm h-1); EI30 – rainfall erosivity index (MJ mm ha-1 h-1); AMS – antecedent soil moisture based on mass (%); PPT5 – precipitation of the antecedent five days (mm); CDD – consecutive dry days (days with PPT < 1 mm); Qmax. – peak flow (L s-1); RD – runoff depth (mm); SY – sediment yield (kg ha-1). * - (p < 0.001).
Variables connected to the energy for soil particle disaggregation (Table 1), such as precipitation (PPT), maximum intensities (I5, I10, I15, I20, I30, I45 and I60), and rainfall erosivity index (EI30) showed high correlations (p < 0.001) with RD and SY. Thus, the weight of the variables – Connected to the disaggregation and transport of sediments – in the runoff and displacement of eroded material in the watershed scale is clearly observed. Similar results have been reported in other studies (CAMMERAAT, 2002; GARCIA-ESTRINGANA et al., 2013).
The SY and RD also presented a high correlation index of 0.73 (p < 0.001) in the erosion plot (Table 2). Thus, similar to the variability found for the watershed (Table 1), the final SY is dependent on the transport energy that is connected to the flow magnitude (CAMMERAAT, 2002; FRYIRS et al., 2007; PENG; WANG, 2012;
SANTOS et al., 2017). These high correlations of the SY with RD, for both spatial scales evaluated, indicated that the SY for the studied area is limited by the transport conditions and not by the availability of disaggregated sediments. Thus, with no disaggregated sediment limitation, the higher the flow energy to transport the sediments, the higher the sediment contribution ratio.
The RD and the maximum intensities of the erosion plot had high correlations (Table 2); the I15
and I45 had the highest correlation (r = 0.57; p = 0.001). These results were similar to that found
Table 2. Correlation matrix of the variables related to the hydrosedimentological processes in the of scale of the 20 m² erosion plot.
PPT I5 I10 I15 I20 I30 I45 I60 EI30 AMS PPT5 CDD RD PY
PPT 1.00
I5 0.47 1.00
I10 0.50 0.98* 1.00
I15 0.55 0.95* 0.98* 1.00
I20 0.58 0.94* 0.97* 0.99* 1.00
I30 0.61 0.86* 0.89* 0.94* 0.97* 1.00
I45 0.61 0.73* 0.77* 0.83* 0.87* 0.95* 1.00
I60 0.53 0.64* 0.68* 0.75* 0.79* 0.90* 0.98* 1.00
EI30 0.80 0.69* 0.72* 0.78* 0.81* 0.84* 0.79* 0.72* 1.00
AMS 0.06 0.08 0.12 0.15 0.14 0.13 0.17 0.18 0.08 1.00
PPT5 0.13 -0.06 -0.06 -0.04 -0.06 0.02 0.09 0.13 -0.08 0.06 1.00
CDD 0.01 -0.07 -0.08 -0.08 -0.06 -0.07 -0.07 -0.06 0.24 -0.03 -0.37 1.00
RD 0.49 0.49 0.54 0.57 0.54 0.54 0.57 0.52 0.58 0.08 0.17 0.24 1.00
PY 0.24 0.16 0.19 0.21 0.19 0.17 0.17 0.15 0.43 -0.03 -0.15 0.65* 0.73* 1.0
PPT – precipitation (mm); I5 – maximum intensity in 5 min (mm h-1); I10 – maximum intensity in 10 min (mm h-1); I15 – maximum intensity in 15 min (mm h-1); I20 – maximum intensity in 20 min (mm h-1); I30 – maximum
intensity in 30 min (mm h-1); I45 – maximum intensity in 45 min (mm h-1); I60 – maximum intensity in 60 min (mm h-1); EI30 – rainfall erosivity index (MJ mm ha-1 h-1); AMS – antecedent soil moisture based on mass
(%); PPT5 – precipitation of the antecedent five days (mm); CDD – consecutive dry days (days with PPT < 1 mm); RD – runoff depth (mm); SY – sediment yield (kg ha-1). * - (p < 0.001).
The SY of the watershed (Table 1) had significant correlations (p < 0.001) with the PPT, intensities of the rains (I10 to I60), EI30, Qmáx and RD. Contrastingly, the SY of the erosion plot had only significant correlations (p < 0.001) With the consecutive dry days (CDD) and RD. The only common correlation for these variables in the scales evaluated was SY and RD, which indicates the limitation of SY by the transport energy, represented by RD. The scale of the watershed a better representativeness of the system’s heterogeneity – soil and vegetation cover characteristics -, which increases the variables connected to the generation of runoff and transport of disaggregated sediments. In the scale of the 20 m² erosion plot, predicting the occurrence of runoff with high transport power is not possible when using only information about the amount or intensity of rain. The antecedent soil moisture conditions (AMS), which is indirectly represented by the CDD, is the key factor for the generating flow and its magnitude.
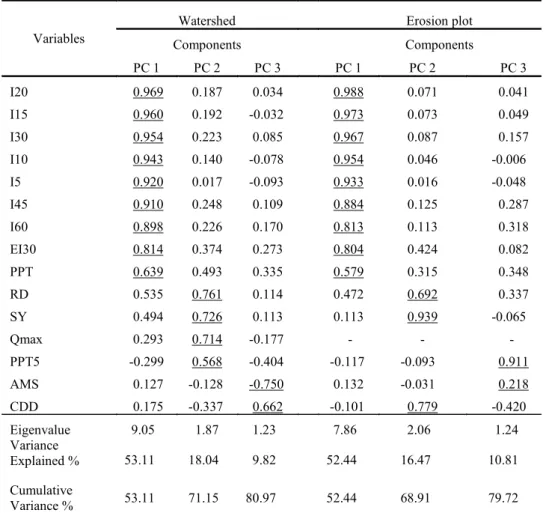
The PCA resulted in three PCs, which explained 80.97% of the total variance in the watershed and 79.72% in the erosion plot (Table 3). These results indicated that in both scales, the PCs
expressed the same explicability in the generating runoff, disaggregation, and sediment transport processes. These components (PC1, PC2 and PC3) express the connection of factors and variables and allow identification of variables with greater interconnections in each component. The high values of the factorial weights indicate the most significant variables in each factor (PALÁCIO, 2004).
The PC1 the two spatial scales evaluated (Table 3) – With factorial weights reaching 0.988 – is represented by the variables related to rainfall, such as the PPT and different maximum intensities. These variables represent the kinetic energy capacity of the rainfall to disaggregation; this explains more than 53.44% of the total variance.
Rev. Caatinga
Table 3. The matriz of the factorial weight of the variables in the principal components (PC) after rotation by the Varimax algorithm.
Variables
Watershed Erosion plot
Components Components
PC 1 PC 2 PC 3 PC 1 PC 2 PC 3
I20 0.969 0.187 0.034 0.988 0.071 0.041
I15 0.960 0.192 -0.032 0.973 0.073 0.049
I30 0.954 0.223 0.085 0.967 0.087 0.157
I10 0.943 0.140 -0.078 0.954 0.046 -0.006
I5 0.920 0.017 -0.093 0.933 0.016 -0.048
I45 0.910 0.248 0.109 0.884 0.125 0.287
I60 0.898 0.226 0.170 0.813 0.113 0.318
EI30 0.814 0.374 0.273 0.804 0.424 0.082
PPT 0.639 0.493 0.335 0.579 0.315 0.348
RD 0.535 0.761 0.114 0.472 0.692 0.337
SY 0.494 0.726 0.113 0.113 0.939 -0.065
Qmax 0.293 0.714 -0.177 - - -
PPT5 -0.299 0.568 -0.404 -0.117 -0.093 0.911
AMS 0.127 -0.128 -0.750 0.132 -0.031 0.218
CDD 0.175 -0.337 0.662 -0.101 0.779 -0.420
Eigenvalue 9.05 1.87 1.23 7.86 2.06 1.24 Variance
Explained % 53.11 18.04 9.82 52.44 16.47 10.81
Cumulative
Variance % 53.11 71.15 80.97 52.44 68.91 79.72
The PC2 of the two spatial scales (Table 3) was composed mainly by the Qmax, RD, and SY. The variables Qmax and RD are directly connected to the mass flow energy, which is responsible for the transportation of disaggregated sediments. Both Qmax and RD presented high correlations with the SY (Tables 1 and 2); thus, the PC2 expressed the sediment transport energy. The framework of the SY in the component connected to the mass transport flow indicates the limitation of the sediment delivery by the transport capacity. According to Medeiros et al. (2010), the SY in the Brazilian semiarid regions is limited by the transport conditions and not by the availability of eroded material. The natural vegetation cover in arid and semiarid regions is scarce; therefore, the events generating runoff can carry large amounts of sediment when there is abundant disaggregated material (AKSOY; KAVVAS, 2005).
The PC3 was composed by variables connected to the soil water content (Table 3). These variables were the MAS, CDD (in the watershed), and precipitation of the antecedent five days (in the erosion plot). This component indicates the soil wetting conditions, which affects the instantaneous infiltration potential of water in the soil that can
generate greater or less runoff flow and, consequently, the generation of energy for sediment transport. Higher ASM content results in closure of part the cracks formed in soils with a vertical character (ZHANG et al., 2014; SANTOS et al., 2016), increasing the possibility of generating runoff with high connectivity in the basin (FRYIRS et al., 2007).
CONCLUSIONS
The sediment yield presented a high correlation with the runoff depth in the two spatial scales evaluated: watershed and erosion plot; this indicates a strong connection between the sediment transport and the mass flow energy.
The mass flow energy was the limiting factor for sediment transport in the scales evaluated.
The maximum intensity of rainfall in 20 minutes (I20) presented the highest factorial
weight, which indicates the need for more attention to this variable by hydrological studies on the Brazilian semiarid region.
and maximum intensities), the energy for the sediment transports (peak flow and runoff depth), and the soil water content (antecedent soil moisture, precipitation over the last 5 days, and consecutive dry days) were framed in the Principal Components developed – PC1, PC2 and PC3, respectively.
REFERENCES
AKSOY, H.; KAVVAS, M. L. A review of hillslope and watershed scale erosion and sediment transport models. Catena, Amsterdam, v. 64, n. 3, p. 247–271, 2005.
AMANAJÁS, J. C.; BRAGA, C. C. Padrões espaço-temporal pluviométricos na Amazônia oriental utilizando Análise multivariada. Revista Brasileira de Meteorologia, São José dos Campos, v. 27, n. 4, p. 423-434, 2012.
ANDRADE, E. M. et al. Fatores determinantes da qualidade das águas superficiais na bacia do Alto Acaraú, Ceará, Brasil. Ciência Rural, Santa Maria, v. 37, n. 6, p. 1791-1797, 2007.
ANDRADE, E. M. et al. Land use effects in groundwater composition of an alluvial aquifer (Trussu River, Brazil) by multivariate techniques. Environmental Research, Amsterdam, v. 106, n. 2, p. 170-177, 2008.
BAKKER, M. M. et al. Soil erosion as a driver of land-use change. Agriculture, Ecosystems & Environment, Amsterdam, v. 105, n. 3, p. 467–481, 2005.
CAMMERAAT, L. H. A review of two strongly contrasting geomorphological systems within the context of scale. Earth Surface Processes and Landforms, Medford, v. 27, n. 11, p. 1201–1222, 2002.
CERDAN, O. et al. Rates and spatial variations of soil erosion in Europe: A study based on erosion plot data. Geomorphology, Amsterdam, v. 122, n. 1, p. 167-177, 2010.
DE ARAÚJO, J. C.; GUENTNER, A.; BRONSTERT, A. Loss of reservoir volume by sediment deposition and its impact on water availability in semiarid Brazil. Hydrological Sciences Journal, Oxoford, v. 51, n. 1, p. 157-170, 2006.
ELMI, A. A. et al. Water and fertilizer nitrogen management to minimize nitrate pollution from a cropped soil in southwestern Quebec, Canada. Water, Air and Soil Pollution, Dordrecht, v. 151, n.
FOSTER, G. R. et al. Conservation of the Universal Soil Loss Equation the SI metric units. Journal of Soil and Water Conservation, Ankeny, v. 36, n. 6, p. 355-359, 1981.
FRYIRS, K. A. et al. Buffers, barriers and blankets: the (dis) connectivity of catchment-scale sediment cascades. Catena, Amsterdam, v. 70, n. 1, p. 49-68, 2007.
GARCIA-ESTRINGANA, P. et al. Use of Mediterranean legume shrubs to control soil erosion and runoff in central Spain. A large-plot assessment under natural rainfall conducted during the stages of shrub establishment and subsequent colonization. Catena, Amsterdam, v. 102, n. 1, p. 3–12, 2013.
GONZÁLEZ-HIDALGO, J. C.; BATALLA, R. J.; CERDA, A. Catchment size and contribution of the largest daily events to suspended sediment load on the continental scale. Catena, Amsterdam, v. 102, n. 1, p. 40–45, 2013.
GUEDES, R. S. et al. Análise em componentes principais da precipitação pluvial no estado do Piauí e agrupamento pelo método de Ward. Revista de Geografia, Recife, v. 27, n. 1, p. 218-233, 2010.
MEDEIROS, P. H. A. et al. Modelling spatio-temporal patterns of sediment yield and connectivity in a semi-arid catchment with the WASA-SED model. Hydrological Sciences Journal, Oxoford, v. 55, n. 4, p. 636-648, 2010.
MOITA NETO, J. M. Uma introdução à análise exploratória de dados multivariados. Química Nova, São Paulo, v. 24, n. 4, p 467-469, 1997.
NORUSIS, M. J. SPSS Base System user’s guide. Chicago: SPSS, 1990. 520 p.
PALÁCIO, H. A. Q. Índice de qualidade das águas na parte baixa da bacia hidrográfica do rio Trussu, Ceará. 2004. 96 f. Dissertação (Mestrado em Engenharia Agrícola: Área de concentração em Irrigação e Drenagem) – Universidade Federal do Ceará, Fortaleza, 2004.
PENG, T.; WANG, S. Effects of land use, land cover and rainfall regimes on the surface runoff and soil loss on karst slopes in southwest China. Catena, Amsterdam, v. 90, n. 2, p. 53–62, 2012.
POESEN, J. et al. Gully erosion and environmental change: importance and research needs. Catena, Amsterdam, v. 50, n. 2, p. 91–133, 2003.
Rev. Caatinga 44, 2014.
SANTOS, J. C. N. et al. Effect of dry spells and soil cracking on runoff generation in a semiarid micro watershed under land use change. Journal of Hydrology, Amsterdam, v. 541, n. 4, p. 1057-1066, 2016.
SANTOS, J. C. N. et al. Land use impact on soil erosin at different scales in the Brazilian semi-arid. Revista Ciência Agronômica, Fortaleza, v. 48, n. 2, p. 251-260, 2017.
TAYFUR, G. et al. Coupling soil moisture and precipitation observations for predicting hourly runoff at small catchment scale. Journal of Hydrology, Amsterdam, v. 510, n. 3, p. 363–371, 2014.
WANG, X. et al. Assessment of soil erosion change and its relationships with land use/cover change in China from the end of the 1980s to 2010. Catena, Amsterdam, v. 137, n. 3, p. 256–268, 2016.
WEI, W. et al. Effects of surficial condition and rainfall intensity on runoff in a loess hilly area, China. Journal of Hydrology, Amsterdam, v. 513, n. 2, p. 115-126, 2014.
WISCHMEIER, W. H.; SMITH, D. D. Predicting rainfall erosion losses: A guide to conservation planning. Washington: USDA, 1978. 58 p. (Agriculture Handbook, 537).
ZHANG, Z. B. et al. Characteristics of cracks in two paddy soils and their impacts on preferential flow. Geoderma, Amsterdam, v. 228, n. 4, p. 114–121, 2014.