Mapeando Nossa Escola
Rita A. Hagevik
1AbstrAct
Mapping Our School Site (MOSS) is a program in which students practice spatial cognition skills by ield mapping and analysis using Geographic Information Systems (GIS). Middle school students’ spatial ability was evaluated using a Spatial Experience Survey (SES) and the revised Purdue Spatial Visualization Test: Rotations (PSVT:R). Other sources of data included interviews, group presentations, individual written conclusions, and mapping analyses. Students’ problem solving identiication and ability dramatically improved as they collected, evaluated, reported, and synthe-sized environmental data. The MOSS program combined an out of door experience with an indoor experience on the computer. This was found to be an effective approach to this type of ield study.
Key words: ield study; Geographic Information System (GIS); spatial
skills.
resumo
Mapeando Nossa Escola (MOSS) é um programa no qual estudantes praticam habilidades de cognição espacial com mapeamento de campo e análises usando o Sistema de Informação Geográica (GIS/SIG). Habi -lidades espaciais de estudantes da segunda fase do Ensino Fundamental foram avaliadas usando o Levantamento de Experiências Espaciais (SES) e o teste de Visualização Espacial de Purdue (PSVT:R). Outras fontes de dados incluíram entrevistas, apresentação de grupos, conclusões escritas individualmente e análises de mapeamentos. A identiicação e habilidade
HAGEVIK, R. A. Mapeando Nossa Escola...
Educar em Revista, Curitiba, Brasil, n. 40, p. 19-33, abr./jun. 2011. Editora UFPR 20
de resolução de problemas aumentaram dramaticamente entre os estudantes conforme eles coletaram avaliaram, relataram e sintetizaram dados am-bientais. O programa MOSS combina experiências fora da sala de aula e dentro da sala com o uso de computadores. Esta abordagem foi considerada efetiva para este tipo de estudo de campo.
Palavra-chave: estudo de campo; Sistema de Informação Geográica (GIS); habilidades espaciais.
Introduction
Baker & Piburn (1997) deine spatial reasoning as the ability to see your world in your mind, to manipulate it, and to explore it. During the last 100 years, psychologists have attempted to measure spatial ability through a battery of tests similar to ones used to evaluate intelligence. Until recently, few studies focused on inding the best way to measure an individual’s spatial visualization ability. However, for the last decade, researchers have evaluated methods for measuring spatial ability and techniques for improving it (BERTOLINE; MILLER, 1990; DENO, 1995; MILLER, 1992; SORBY; BAARTMANS, 1996; WIEBE, 1993).
According to McGee (1979) and Tartre (1990) there is more than one type of spatial ability. Spatial visualization involves being able to mentally manipu-late, rotate, twist or invert pictures when presented with a visual stimulus. One must be able to recognize, retain, and recall the coniguration of an object that has been manipulated in three-dimensional space. Spatial orientation, on the other hand, involves the arrangement of components within a visual stimulus pattern or the ability to remain unconfused when the orientation of the stimuli changes. Spatial orientation is “the ability to determine spatial relations in which the body orientation of the observer is an essential part of the problem” (Mc-GEE, 1979, p.3-4). This study used the revised PSVT:R developed by Branoff (BRANOFF, 2000) to measure the spatial visualization of middle school students. Using labeled coordinate axes eliminates gender differences previously found using this test. In addition, to eliminate age differences, participants taking the test were given unlimited time to complete the test, though most participants completed the 30 item test in one class period or 55 minutes.
Pennsylvania State University (NEWCOMBE, 1982; NEWCOMBE; HUTTEN -LOCHER, 2000) and the University of Maryland (OLSON, 1985). Similar to Deno’s study, Parolini’s SES also includes spatial experiences in school such as courses in drafting, art, design, and shop as well as geometry mathematics courses. An important addition to Parolini’s SES is the inclusion of computer and video games. Tartre (1990), in a study of 58 Harvard students, found that after playing video games for only 5 hours, spatial visualization scores of fe-male subjects increased dramatically. In 1993, 1,012 engineering freshman took Parolini’s SES, which consisted of a 14 item questionnaire. Results were corre -lated to scores on the PSVT: R for spatial visualization. Experiences in courses such as mechanical drawing, drafting, CAD drawing, and art were shown to be predictors of success on the PSVT:R. In addition, experience with toys such as blocks, LEGO bricks, and other building toys, as well as time spent playing video/computer games were found to be important predictors of success. Gender was signiicant but this could have been due to the unrevised, gender-biased PSVT:R test used rather than the SES (BRANOFF, 1998).
In this study, a Spatial Reasoning Survey (SES) was developed from the results of these two studies and administered to students along with the 30 item revised PSVT:R. Items on the SES were broken down into the following three categories, background experiences such as academic courses (geometry, drafting classes), non-academic activities (toys, computer games), and sports activities. Gender, age and handedness were included.
mapping our school site (moss) program
Hagevik (2003) developed the Mapping Our School Site (MOSS) pro -gram, a ield-based unit of study that explores and enhances students’ learning of earth and environmental concepts such as regional geology; components of the ecosystem such as animals, trees and vegetation cover and aspects of the microclimate such as soil, air and water chemistry.
HAGEVIK, R. A. Mapeando Nossa Escola...
Educar em Revista, Curitiba, Brasil, n. 40, p. 19-33, abr./jun. 2011. Editora UFPR 22
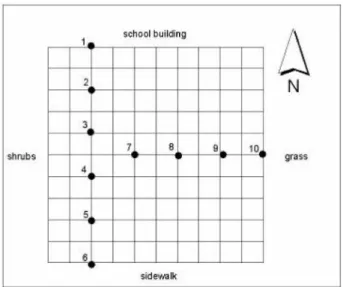
The grid is not georeferenced to real world coordinates. However, it is possible to subsequently georeference the grid to an aerial photograph. As a irst step, students collect data following established procedures such as vegetation/ ground cover, animals, pitfall traps, trees, and abiotic (STUBBS; HAGEVIK; HESSLER, 2003). These characteristics and procedures, see Table 1, can be viewed in detail on the MOSS website (HAGEVIK, 1999).
TABLE 1 - CHARACTERISTICS AND PROCEDURES OF MOSS
Characteristics Procedures
Instruction is situated in authentic problems
What is the relationship between the biotic and abiotic components of the environment?
A focus on the grappling with data
Microclimates, animals, pitfall traps, trees, shrubs and ground cover, students’ choices
Collaboration of students and teacher
Student groups engage in directed inquiry or student research
Connections with
society Impact of human activities on the environment
Teacher modeling
behavior of a scientist Students perform steps of scientiic problem solving
Development of student ownership
Collaboration of conceptual learning through shared experiences
FIGURE 1 - 10 METER BY 10 METER STUDY SITE
Students use the ArcGIS (ENVIRONMENTAL SYSTEMS RESEARCH
INSTITUTE, 2004)brand of desktop Geographic Information Software (GIS) to analyze spatial patterns and formulate problem questions. Then, the students develop additional protocols based on existing scientiic models for example the GLOBE Program (UCAR/CSU, 2004) to collect additional data in order to answer their problem questions. After performing additional spatial analysis, students present their conclusions in a report and presentation to their peers.
GIS, a visual-spatial technology, allows users to instantaneously visualize multiple layers of map representations and descriptions leading to an ininite number of connections and analyses (MacEACHREN, 1994). Students use GIS to visualize and analyze their spatial data, revealing spatial patterns and trends. This type form of computer-aided instruction compels students to collect data precisely and accurately, teaches them to design spatial data tables, and to thoroughly test hypotheses. Students receive immediate feedback because GIS allows instantaneous multiple map representations.
The student subjects for the study were recruited through three teachers trained in a MOSS workshop. All three teachers were experienced, certiied teachers who had been at their schools for over ten years. Data was collected from 164 seventh and eighth grade students (ages 12-15), ninety-six from one public urban middle school and sixty-eight from another public urban middle school in a different county. All students in the study completed the online Spatial Experience Survey (SES) and the revised Purdue Spatial Visualization Test: Rotations (PSVT:R), before beginning the mapping technology units. These scores were used to measure spatial ability. Other data sources included interviews, group presentations, individual written conclusions, and mapping analyses. Interviews, mapping analyses, and student interviews as well as the teachers interviews were videotaped, transcribed and analyzed using ATLAS. tiTM qualitative software (National Research Council, 1996; Scientiic Software Developments, 2003). Statistical measures were used to compare the spatial ability scores to the SES.
spatial ability and student experience
HAGEVIK, R. A. Mapeando Nossa Escola...
Educar em Revista, Curitiba, Brasil, n. 40, p. 19-33, abr./jun. 2011. Editora UFPR 24
games (p < .05) were signiicantly different when compared to spatial reasoning scores. Males scored higher than females on the spatial reasoning test, students that played computer games scored higher than those who never played com-puter games, and the fewer shop classes taken the higher they scored (Table 2). Most students (60%) seemed to play computer games weekly or daily. School, handedness, sports, age, toys, or geometry and 3-D classes did not signiicantly affect the spatial reasoning test scores. Most students reported playing with spatial toys such as LEGO® bricks and building sets when they were younger.
Additional data regarding student computer use was collected during the interviews. A random sample of the twenty-three of the twenty-four students interviewed, or approximately two from each class period, reported that they liked computers and used them regularly. This agrees with the results of the SES in which most students (60%) seemed to play computer games weekly or daily. Students reported a wide variety of computer uses with 63% playing computer games, 54% using the Internet and emailing their friends, 38% doing their homework, and 33% doing research projects. Table 2 shows that males score higher than females even though a non gender-biased spatial reasoning test was used. Playing computer games at least once a week is signiicant.
TABLE 2 - COMPARISON OF SPATIAL REASONING TO SES
Observably, spatial reasoning skills are important to success in today’s knowledge-based society, yet, as a result of tight school budgets, activities in schools that foster spatial skills are disappearing. Courses like art, shop, dance,
6
computer games weekly or daily. School, handedness, sports, age, toys, or geometry and 3-D
playing with spatial toys such as LEGO
with the results of the SES in which most students (60%) seemed to play computer games weekly or daily. Students reported a wide variety of computer uses with 63% playing computer games, 54% using the Internet and emailing their friends, 38% doing their homework, and 33% doing research projects. Table 2 shows that males score higher than females even though a non
gender-TABLE 2 COMPARISON OF SPATIAL REASONING TO SES
Source F p
Group 0.11 0.74 Age 0.06 0.98 Sex 14.68 0.000**** GIS
Experience.
0.11 0.73
Geometry 0.59 0.55 3-D courses 0.08 0.97 Handedness 2.10 0.127
Toys 1.76 0.126 Shop Class 3.54 0.03**
Computer
Games 2.97 0.02** Sports 1.52 0.14
*p < 0.1 **p < .05. ***p < .01. ****p < .001.
Observably, spatial reasoning skills are important to success in today’s knowledge-based
and drama are being dropped from the curriculum. The fewer shop classes taken, the higher the spatial reasoning score. One proposed explanation for this see-mingly contradictory inding is that most of the students in this study, because of a lack of funding, had taken no or one semester of shop class.
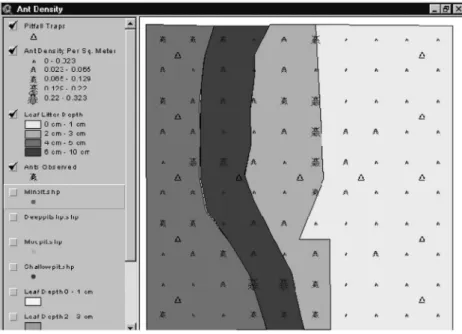
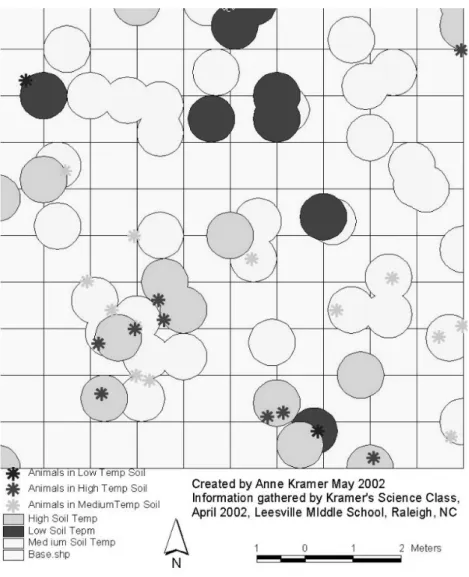
This study was unable to measure a change in spatial reasoning skills. Spatial reasoning skills develop over time with repeated exposure and practice (KOTULAK, 2000). The MOSS program provides opportunities for students to practice and sharpen these skills in a ield-based geosciences program in schools. Students engage in spatial reasoning skills using the computer to solve real world questions. Student success can be measured by the real data collected, evaluated, and reported. Figure 2 shows a student map created using GIS to analyze where ant density is highest as related to vegetation, soil temperature, moisture, and texture, and air temperature. Figure 3 is a class map comparing animal diversity to soil temperature.
HAGEVIK, R. A. Mapeando Nossa Escola...
Educar em Revista, Curitiba, Brasil, n. 40, p. 19-33, abr./jun. 2011. Editora UFPR 26
What students said about moss
Students in general said that GIS helped you to organize lots of data and to understand and compare all the information in order to solve problems. For example, one student remarked, “It helps you to organize lots of data and to it everything together.” Students overall liked GIS and MOSS. They said that it was interesting and very different from what they would normally do in science class. For example, Tony said, “It is cool and you are going to get to use the computer.” Students said that they enjoyed going outside (50%), being on the computer and plotting things (30%), collecting the data (15%), and formulating an individual problem question (5%). Jacinta said, “The GIS part of it was cool and I liked making maps on the computer.” Overall students seemed to enjoy the MOSS because they got to go outside, collect data, and use the computers. Students did not enjoy the more tedious and repetitive tasks of data entry, which required accuracy. When asked how MOSS compared to what they normally did in science class, one student responded, “It was a big leap. We started off with little labs and the next thing you know we were outside every day working on the ground. Most of our labs were very small. This was a big jump to go from a one-day thing to a one-month thing. I had never done it before but I liked it.” Students said that in science class they usually read the book, took notes, watched ilms, answered questions, and did worksheets. When they did labs, they were one period in length. They never went outside nor used the computer in science class.
Students said that MOSS was different from what they normally did in science class because they:
- went outside - used the computer - did more mathematics
- worked longer and more in-depth.
HAGEVIK, R. A. Mapeando Nossa Escola...
Educar em Revista, Curitiba, Brasil, n. 40, p. 19-33, abr./jun. 2011. Editora UFPR 28
What teacher said about moss
Teachers said they felt their students learned and beneited or as one teacher stated, “I think that a lot of the things that we were learning, we were not even aware that we were learning them.” The teachers said that they felt the students became more observant and were able to identify relationships and patterns. Carolyn felt that her students learned to ask problem questions. N.D. said that his students learned to collect data from the ield and to manipulate
it using the computer. Pat explained that she thought that the difference between taking the data outside to creating representations on the computer was an important spatial reasoning skill. She also felt that the technology skills learned were valuable such as creating “creating a spreadsheet and being aware that you can convert a spreadsheet into different types of iles”. Overall, teachers seemed conident that their students had learned a great deal and beneited from the project.
N.D. said that, “not only have the students’ computer skills improved but their total awareness of the environment overall. He overheard his students saying, “I have learned more in this study than any of the current things we are doing in school.” His principal in a faculty meeting recognized N.D. for his work and a fellow teacher whose child was in his class thanked him saying that her child had learned more in his class than any of the other classes at the school.
computer to help him solve problems and that, “It teaches you a lot about the environment and how you should take care of it”. Teachers said that “you could take that project anywhere you want and use it”. Overall the teachers were very positive about MOSS and GIS in general. They were excited about the possi -bilities for their students and themselves and looked forward to repeating the project next year at their schools.
Problem solving and moss
Students were able to explain many patterns that they noticed from their projects. Many students noticed that there were more insects in the sunnier areas or in the grass. Students were surprised because they thought that more animals would be in the woods where they could hide and be in the shade or in the trees and shrubs where they could eat leaves. One student group was surprised to ind that the soil temperature was colder than the air temperature. Students thought that the soil would be warmer than the air. Students also thought that the soil under the pine needles would be cooler since it was in the shade. They were surprised to ind that the soil temperature under the pine needles was warmer than the cooler fall air temperatures. Students were surprised by how many living things they found in a 10m x 10 m plot. One group counted over 500 ants and another thought there would be 3,000 blades of grass and instead found over 3,000,000 blades of grass.
The Carrington Middle study site contained a pond and students thought that more animals would be closer to the pond because “animals like water.” They were surprised to ind the opposite instead, “more animals were found further away from the pond where there was more sun.” Shanee wondered what happened to the animals in the pond when the weather got cold. So she “tried an experiment and put a bug in a bowl and then in the freezer. When I pulled it out the animal was still living and it was the same size. I was surprised it was still alive.” Jilla said, “Everything is linked together like the air and the temperature with the soil and the animals in the ground and what is on top of the ground.” Students were surprised by what they found outside their school campus. Students had previous ideas that were tested and often disproved by their results. They began to understand the connections between the different components in the environment.
HAGEVIK, R. A. Mapeando Nossa Escola...
Educar em Revista, Curitiba, Brasil, n. 40, p. 19-33, abr./jun. 2011. Editora UFPR 30
questions) more easily.” Donald further explained that he now understands the steps to solving problems when he said, “I can now think about how to solve problem questions. I know how to do it and the steps of how to do it.” Students commented that they solved problems over and over again during the MOSS project. Erik said, “I can now ask questions that make sense and have more depth.” Carl said, “I look at different ways to answer questions now.”
Three students expressed a deeper understanding of asking questions when they said, “I learned you should ask a lot more questions when you do something that is complicated.” Two students seemed to understand science better when they said, “I never knew there was that much stuff to science and I didn’t realize how important it was when I started the project.” While student comments did not clearly identify whether or not their ability to solve scientiic problems had changed, they did show that students now had an idea of how to go about sol-ving problems and that their ability to identify or formulate problem questions had improved. During the interviews, students were easily able to explain and discuss a variety of problem questions. When they began the unit and tried to write problem questions at the bottom of their quizzes, all of the classes needed further explanation on how to identify and write problem questions. There was a dramatic difference between problem identiication and the understanding of the steps of skillful problem solving from the beginning of the MOSS project to the end as explained by the students in these interviews.
conclusions
Students’ ability to identify and ask problem questions about the en -vironment dramatically improved. They learned how to orient themselves, representing data visually by drawing and by creating paper and digital maps. Many students were surprised when their hypotheses were not supported (79%). These anomalies created a greater awareness of the environment and led to a greater number of more complex and sophisticated questions by the end of the project. Students said that the MOSS program was different from what they normally did in science because they went outside, used the computer, did more mathematics, and worked longer and more in-depth.
ability and it can not be taught; and 3) that explicitly teaching spatial ability in classrooms is too time-consuming to make a real difference for students.
Instead, we propose that mapping makes a good vehicle for exploring and enhancing student learning in the earth and environmental sciences, spe-ciically regional geology, soils, vegetation cover and trees, at the same time, giving students practice in spatial cognition skills. The National Standards in science (NATIONAL RESEARCH COUNCIL, 1996), mathematics (NATIO -NAL COUNCIL OF TEACHERS OF MATHEMATICS, 1986) and technology (INTERNATIONAL SOCIETY FOR TECHNOLOGY IN EDUCATION, 2000) emphasize real-world problem solving. The MOSS program incorporates scien-ce, mathematics, and technology into one problem-solving unit of study that meets state requirements in earth and environmental science which are required for graduation. Students practice their spatial cognition in the out of doors ield environment and in the indoors computer environment. Students with higher spatial reasoning skills excel at science and mathematics. Programs like MOSS that allow students to practice spatial cognition skills over time while learning science, mathematics, and technology content, can aide students in learning skills that they will need know in order to be successful in these ields in the future.
reFereNces
BACKER, D.; PIBURN, M. Constructing Science In Middle And Secondary School Classrooms. Needham Heights, MA: Allyn & Bacon, 1997.
BERTOLINE, G. R.; MILLER, C. L. A Visualization And Orthographic Drawing Test Using The Macintosh Computer. Engineering Design Graphics Journal, v. 54, n. 1, p. 1-7, 1990.
BRANOFF, T. J. The Effects Of Adding Coordinate Axes To A Mental Rotations Task In Measuring Spatial Visualization Ability In Introductory Undergraduate Technical Graphics Courses. Engineering Design Graphics Journal, v. 62, n. 2, p. 16-34, 1998.
_____. Spatial Visualization Measurement: A Modiication Of The Purdue Spatial Visualization Test - Visualization Of Rotations. Engineering Design Graphics Journal,
v. 64, n. 2, p. 14-22, 2000.
DENO, J. A. The Relationship Of Previous Experiences To Spatial Visualization Ability.
HAGEVIK, R. A. Mapeando Nossa Escola...
Educar em Revista, Curitiba, Brasil, n. 40, p. 19-33, abr./jun. 2011. Editora UFPR 32
ENVIRONMENTAL SYSTEMS RESEARCH INSTITUTE. Arcgis 9.X. Redlands, CA: Environmental Systems Research Institute, Inc., 2004.
GUAY, R. B. Factors Affecting The Development Of Two Spatial Abilities Baasic To Technical Drawing. Journal Of Industrial Teacher Education, v. 14, n. 3, p. 38-43, 1977.
GUAY, R. B.; McDANIEL, E. D. Toward Explaining Sex Differences In Spatial Ability:
An Investigation Of Selected Cultural And Neurophysiological Factors. Arlington, VA: Army Research Institute, 1979.
HAGEVIK, R. Mapping Our School Site (MOSS). 1999. Retrieved 2011 <www.Ncsu.
Edu/Scilink/Studysite>.
_____. The Effects Of Online Science Instruction Using Geographic Information Systems (GIS) To Foster Inquiry Learning Of Teachers And Middle School Science Students. Unpublished Dissertation, North Carolina State University, Raleigh, 2003.
INTERNATIONAL SOCIETY FOR TECHNOLOGY IN EDUCATION. National Educational Technology Standards For Students: Connecting Curriculum And Technology. Eugene, Oregon: ISTE Press, 2000.
KOTULAK, R. Spatial Research Is Altering The Shape Of Early Learning. Chicago Tribune, p. 4 -6, 2000.
MACEACHREN, A. M. Visualization In Modern Cartography: Setting The Agenda. In: MACEACHREN, A. M.; TAYLOR, D. (Eds.). Visualization In Modern Cartography.
Oxford: Pergamon Press, 1994. (p. 1-12).
McGEE, M. Human Spatial Abilities: Sources Of Sex Differences. New York, NY:
Holt, Rinehart And Winston/BS, Inc., 1979.
MILLER, C. L. Enhancing Visual Literacy Of Engineering Students Through The Use Of Real And Computer Generated Models. Engineering Design Graphics Journal, v. 55, n. 3, p. 5-14, 1992.
NATIONAL COUNCIL OF TEACHERS OF MATHEMATICS. Curriculum And Evaluation For School Mathematics. Reston, VA: NCTM, 1986.
NATIONAL RESEARCH COUNCIL. National Science Education Standards.
Washington, DC: National Academy Press, 1996.
NEWCOMBE, N.; HUTTENLOCHER, J. Making Space: The Development Of Spatial Representation And Reasoning. Cambridge, MA: The MIT Press, 2000.
OLSON, D. M. The Inluence Of Sex, Experiential Factors And Cognition Processing
On Spatial Aptitude Performance. Published Dissertation, University Of Maryland, College Park, MD, 1985.
PAROLINI, L. L. Gender Differences On Predictors Of Success On The Purdue Spatial Visualization Test: Rotations. Masters Thesis, Michigan Technological University, Houghton, MI, 1994.
SCIENTIFIC SOFTWARE DEVELOPMENTS. ATLAS.Ti(Version 4.2). Berlin: The
Technical University, 2003.
SORBY, S. A.; BAARTMANS, B. J. A Course For The Development Of 3-D Spatial Visualization Skills. Engineering Design Graphics Journal, v. 60, n. 1, p. 13-20, 1996.
STUBBS, H.; HAGEVIK, R.; HESSLER, E. Investigating Ants: Projects For Curious Minds. Green Teacher, n. 71, p. 33-42, 2003.
TATRE, L. A. Spatial Skills, Gender, And Mathematics. In: FENNEMA, E. H.; LEDER, G. C. (Eds.). Mathematics And Gender. New York, NY: Teachers College
Press, 1990. p. 27-59.
UCAR/CSU. The GLOBE Program. Retrieved 2004. From: <www.Globe.Gov>.
WIEBE, E. N. Visualization Of Three-Dimensional Form: A Discussion Of Theoretical Models Of Internal Representation. Engineering Design Graphics Journal, v. 57, n. 1, p. 18-27, 1993.