ECOLOGICAL-ECONOMIC ZONING AS A BASIS FOR AGRICULTURAL
SUITABILITY OF LANDS IN MINAS GERAIS ELABORATED IN GIS
Mapa de solos, conhecimento de campo, inventário florestal e Zoneamento Ecológico-Econômico como base para a aptidão agrícola das terras em Minas Gerais elaborada em SIG
Vladimir Antonio Silva1, Nilton Curi2, João José Granate Marques3,
Luis Marcelo Tavares de Carvalho4, Walbert Júnior Reis dos Santos5
ABSTRACT
Lands (broader concept than soils, including all elements of the environment: soils, geology, topography, climate, water resources, flora and fauna, and the effects of anthropogenic activities) of the state of Minas Gerais are in different soil, climate and socio-economics conditions and suitability for the production of agricultural goods is therefore distinct and mapping of agricultural suitability of the state lands is crucial for planning guided sustainability. Geoprocessing uses geographic information treatment techniques and GIS allows to evaluate geographic phenomena and their interrelationships using digital maps. To evaluate the agricultural suitability of state lands, we used soil maps, field knowledge, forest inventories and databases related to Ecological-Economic Zoning (EEZ) of Minas Gerais, to develop a map of land suitability in GIS. To do this, we have combined the maps of soil fertility, water stress, oxygen deficiency, vulnerability to erosion and impediments to mechanization. In terms of geographical expression, the main limiting factor of lands is soil fertility, followed by lack of water, impediments to mechanization and vulnerability to erosion. Regarding agricultural suitability, the group 2 (regular suitability for crops) is the most comprehensive, representing 45.13% of the state. For management levels A and B, low and moderate technological level, respectively, the most expressive suitability class is the regular, followed by the restricted class and last, the adequate class, while for the management level C (high technological level) the predominant class is the restricted. The predominant most intensive use type is for crops, whose area increases substantially with capital investment and technology (management levels B and C).
Index terms: Geoprocessing, land suitable for agriculture, sustainability, multicriteria analysis.
RESUMO
As terras (conceito mais abrangente do que solos, incluindo todos os elementos do ambiente: solos, geologia, relevo, clima, recursos hídricos, flora e fauna, além dos efeitos da ação antrópica) do estado de Minas Gerais estão em diferentes condições de solo, clima e sócio-economia, portanto, são distintas as vocações para produção de bens agrícolas e o mapeamento da vocação agrícola das terras do estado é fundamental para o planejamento norteado da sustentabilidade. O geoprocessamento utiliza técnicas de tratamento da informação geográfica e o SIG permite avaliar com mapas digitais os fenômenos geográficos e suas inter-relações. Objetivando avaliar a vocação agrícola das terras do estado, utilizaram-se o mapa de solos, o conhecimento de campo, o inventário florestal e o banco de dados relacionados ao Zoneamento Ecológico-Econômico (ZEE) de Minas Gerais, para elaborar em SIG o mapa de aptidão agrícola. Para tal, combinaram-se os mapas de fertilidade do solo, deficiência de água, deficiência de oxigênio, vulnerabilidade à erosão e de impedimentos à mecanização. Em termos de expressão geográfica, o principal fator limitante das terras é a fertilidade do solo, seguido pela deficiência de água, impedimentos à mecanização e vulnerabilidade à erosão. Quanto à aptidão agrícola, o grupo 2 (aptidão regular para lavouras) é o de maior abrangência, representando 45,13% do estado. Para os níveis de manejo A e B, baixo e moderado nível tecnológico, respectivamente, a classe de aptidão mais expressiva é a regular, seguida pela classe restrita e por último a classe adequada, enquanto para o nível de manejo C (alto nível tecnológico), a classe predominante é a restrita. O tipo de utilização mais intensivo predominante é para lavouras, cuja área aumenta substancialmente com investimento de capital e tecnologia (níveis de manejo B e C).
Termos para indexação: Geoprocessamento, vocação agrícola das terras, sustentabilidade, análise multicritério.
(Received in july 24, 2013 and approved in september 18, 2013)
1Instituto Nacional de Colonização e Reforma Agrária/INCRA – Belo Horizonte – MG – Brasil
2Universidade Federal de Lavras/UFLA – Departamento de Ciência do Solo/DCS – Cx. P. 3037 – 37200-000 – Lavras – MG – Brasil – [email protected] 3Universidade Federal de Lavras/UFLA – Departamento de Ciência do Solo/DCS – Lavras – MG – Brasil
INTRODUCTION
Agriculture depends largely on nature and inappropriate use of land (broader concept than soil, including all elements of the environment: soils, geology, topography, climate, water resources, flora and fauna, and the effects of anthropogenic activities) is one of the major cause of environmental degradation, with loss of competitiveness of the agricultural sector and the quality of life (CURI et al., 1992). The state of Minas Gerais has regions with different soil, climate and socio-economic conditions, therefore, with different suitability to produce agricultural goods.
The evaluation of land suitability consists of the interpretation of the ecosystem qualities by estimating th e limitations of lan ds for agricultur al an d the possibilities for cor rection or reduction of these limitations, with different levels of management (NAIME et al., 2006). The use of lands according to their suitability prevents their overuse (RAMALHO FILHO; PEREIRA, 1999), situation that involve sustainability risks (NASCIMENTO; GIASSON; INDA JÚNIOR, 2004).
The system of Evaluation of Land Agricultural Suitability (sELAS) is a flexible method and may be adapted as needed (MOURA et al., 2007). It performs th e evaluation of lands from five en vir onmental par ameter s con sider ed essential for cr ops, in a synthesis of the ecosystem (RESENDE et al., 2007): natural fertility, water deficiency, oxygen deficiency, su scep t i bi l i t y t o er osi on a n d i m p ed i m en t s t o mechanization.
Geopr ocessi n g uses ma t h ema t ica l an d compu tat ion al tech n i ques for th e t r ea tmen t of geographic information. The use of the geographic information system (GIS) allows the spatial analysis of agricultural suitability of the lands and their main
limitations, reducing work time, when compared with manual methods (SILVA; NOGUEIRA; UBERTI, 2010).
Using sELAS, Amaral et al. (2004) performed the evaluation of lands suitability for agricultural in the state of Minas Gerais. Subsequently, a digital soil map (FUNDAÇÃO ESTADUAL DO MEIO AMBIENTE -FEAM, 2010) and a vast digital database related to Ecological-Economic Zoning (EEZ) of the state of Minas Gerais (SCOLFORO; OLIVEIRA; CARVALHO, 2008) were made available. The aim of this study was to develop a land suitability map of the lands of the state of Minas Gerais in GIS using digital data currently available, supported by field knowledge and soil survey bulletins.
MATERIAL AND METHODS
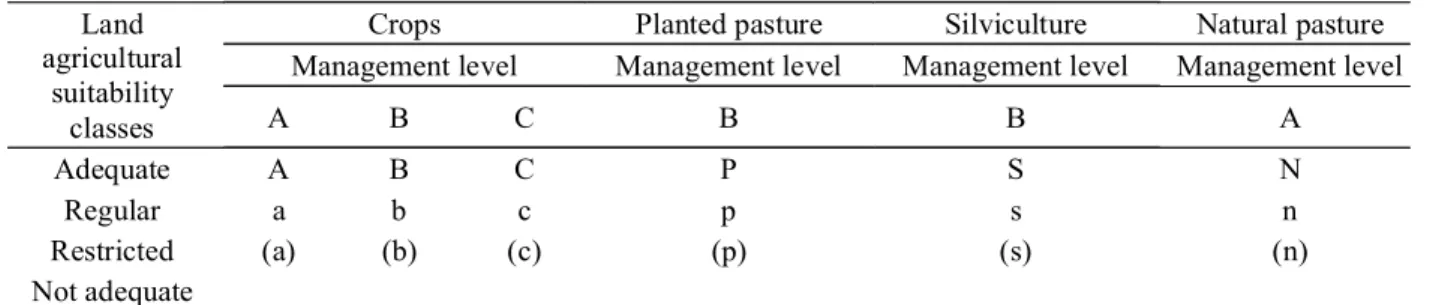
Th e state of Min as Ger ais is located in Southeastern Brazil and presents an area of 586,522.122 km2 (INSTITUTO BRASILEIRO DE GEOGRAFIA E ESTATÍSTICA - IBGE, 2010). The assessment of the lands suitability for agriculture followed the methodology formulated by Ramalho Filho and Beek (1995), with adaptations and adjustments, whose structure and symbolism are presented in table 1.
The databases were the soil map of the state of Minas Gerais (FEAM, 2010), the digital elevation model (DEM) obtained from the Shuttle Radar Topography Mission (SRTM) remote sensing image, climatic zoning of the state based on the Thornthwaite moisture index (CARVALHO et al., 2008b), the soils erosion vulnerability map (CURI et al., 2008), and forest inventory of Minas Gerais (CARVALHO; SCOLFORO, 2008). In situations where the databases did not reflect the accumulated knowledge, adjustments were made based on field experience. All maps were converted to the Albers continental projection system, raster and pixel format of 270 m.
Table 1 – Symbols corresponding to the land agricultural suitability classes. Land
agricultural suitability
classes
Crops Planted pasture Silviculture Natural pasture Management level Management level Management level Management level
A B C B B A
Adequate A B C P S N
Regular a b c p s n
Restricted (a) (b) (c) (p) (s) (n)
Not adequate
Source: Ramalho Filho, Beek (1995).
From soil map legends (FEAM, 2010), a table of attributes of the mapping units with information on base saturation, type of A horizon, clay fraction activity and native vegetation was generated in the ArcGis® program from ESRI (Environmental Systems Resources Institute). These attributes were combined in the 303 mapping units (2,923 polygons), for which weights from 1-5 were assigned, according to their degrees of limitation. In the case of soil associations (grouping of taxonomic units occurring together in the landscape), the mapping unit in function of majority component was considered. Subsequently, these attributes were converted to a raster format, generating
the respective auxiliary maps that were combined using the criteria in table 2, to obtain the soil fertility map.
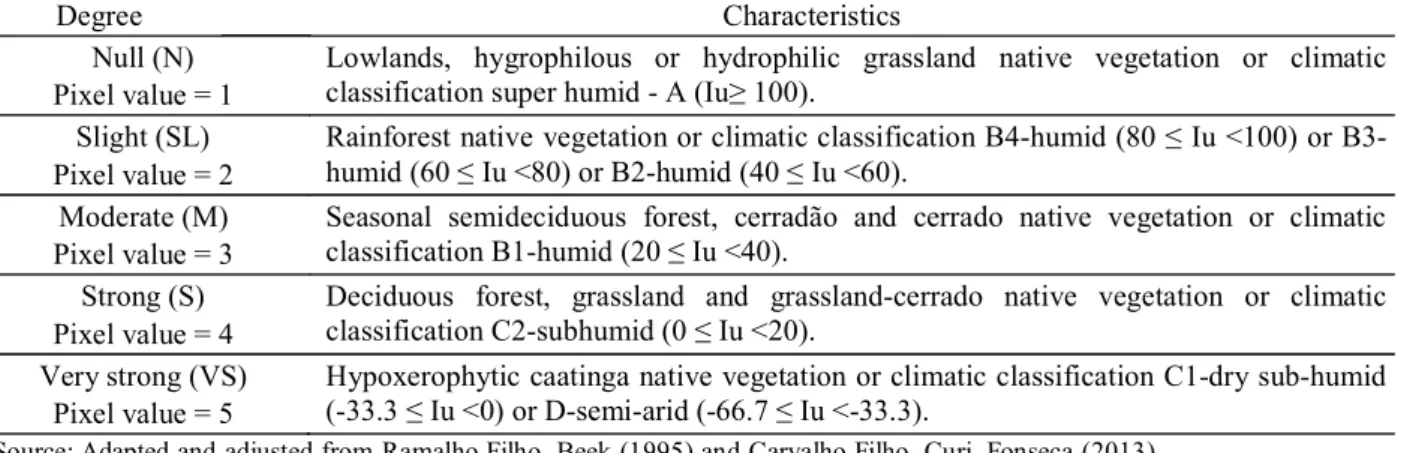
Combining the climatic zoning map of the state of Minas Gerais, based on the Thornthwaite moisture index (Iu) (CARVALHO et al., 2008), with the vegetation map (CARVALHO; SCOLFORO, 2008), taking the criteria defined in table 3 as a reference, the degrees of limitation were determined to generate the soil water deficiency map. The vegetation map was previously interpolated in order to reclassify the pixels in disturbed areas where there was no such information (‘others’ class) for the probable type of native vegetation.
Table 2 – Degrees of limitation by fertility deficiency.
Source: Adapted and adjusted from Ramalho Filho, Beek (1995) and Carvalho Filho, Curi, Fonseca (2013).
Table 3 – Degrees of limitation by water deficiency.
Source: Adapted and adjusted from Ramalho Filho, Beek (1995) and Carvalho Filho, Curi, Fonseca (2013).
Degree Characteristics
Null (N) Pixel value = 1
Eutrophic soils and the presence of high activity clay (Ta) or Tb (low activity clay) with chernozemic A without, however, presenting toxicity by soluble salts, exchangeable sodium or other elements to plants. Resembles the very low to low classes for aluminum saturation (m%) values and very good to good for values of V%.
Slight (SL) Pixel value = 2
Eutrophic soil and the presence of low activity clay (Tb), without, however, presenting toxicity by soluble salts, exchangeable sodium or other elements to plants. Resembles the classes low for m% values and medium to good for V% values.
Moderate (M) Pixel value = 3
Dystrophic soils and the presence of low activity clay (Tb) without, however, presenting toxicity by soluble salts, exchangeable sodium or other elements to plants. Resembles the classes low to medium for m% values and low for V% values.
Strong (S) Pixel value = 4
Dystrophic soils and the presence of low activity clay (Tb) without, however, presenting aluminum saturation (m%) high enough to make the adoption of A management level (low-tech) unfeasible. Resembles the classes high to very high for m% values and very low to low for V% values.
Very strong (VS) Pixel value = 5
Allic or dystrophic soils with very low T values, as in the case of perferric soils where the use under the A management level is not feasible. Also soils with salinity or sodicity problems.
Degree Characteristics
Null (N) Pixel value = 1
Lowlands, hygrophilous or hydrophilic grassland native vegetation or climatic classification super humid - A (Iu≥ 100).
Slight (SL) Pixel value = 2
Rainforest native vegetation or climatic classification B4-humid (80 ≤ Iu <100) or B3-humid (60 ≤ Iu <80) or B2-humid (40 ≤ Iu <60).
Moderate (M) Pixel value = 3
Seasonal semideciduous forest, cerradão and cerrado native vegetation or climatic classification B1-humid (20 ≤ Iu <40).
Strong (S) Pixel value = 4
Deciduous forest, grassland and grassland-cerrado native vegetation or climatic classification C2-subhumid (0 ≤ Iu <20).
Very strong (VS) Pixel value = 5
The oxygen deficiency map was generated from the soil map (FEAM, 2010), assigning the values for the degrees of limitation set out in table 4 to soil classes, based on drainage conditions. The soil drainage conditions map was adapted to the oxygen deficiency map.
For the erosion factor, the raster map of soil erosion vulnerability (CURI et al., 2008) was used and discussed later in this paper, which interrelates the erosion risk, rainfall intensity and soil exposure to direct raindrop impact maps. The five vulnerability classes (very low, low, medium, high and very high) were used to establish the degree of limitation by vulnerability to soil erosion, as shown in table 5.
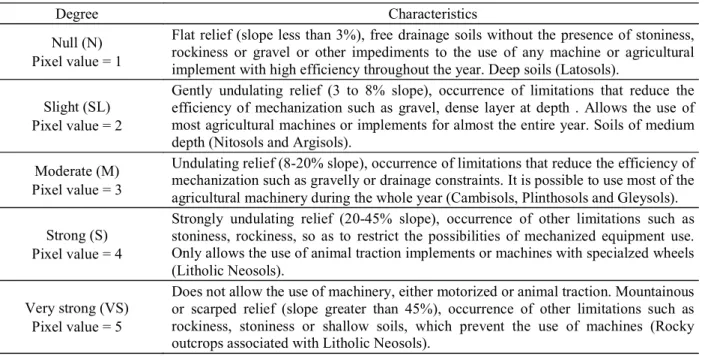
From the soil map and the relief classes map a raster map of impediments to mechanization was
generated. The map of relief classes suggested by Empresa Brasileira de Pesquisa Agropecuária, EMBRAPA (2006) was obtained from the derivation of the DEM with a 90 m pixel, obtained from the Shuttle Radar Topography Mission (SRTM). Subsequently, the relief map was resampled to a pixel size of 270 m according to that adopted in th e EEZ ( SCOLFORO; OLIVEIRA; CARVALHO, 2008). From the soil maps, auxiliary raster maps of soil texture, presence of stoniness in the soil profile and soil depth, were produced, assigning values for the degrees of limitation related to these attributes defined in table 6 to the mapping units. Combining the auxiliary and relief maps, an impediments to mechanization map was generated.
Degree Characteristics
Null (N) Pixel value = 1
Excessively drained soils without the presence of gleyed horizons or plinthite. Latosol and Quartzarênic Neosol.
Slight (SL) Pixel value = 2
Moderate to well drained soils with small aeration deficiency to sensitive crops, during by rainy season. Argisol, Haplic and Humic Cambisols, Chromic Luvisol, Nitosol.
Moderate (M) Pixel value = 3
Moderately to imperfectly drained soils with greater restriction to crops sensitive to aeration deficiency during the rainy season. Haplic Gleysol, Litholic and Fluvic Neosols, Fluvic Cambisol.
Strong (S) Pixel value = 4
Typical of hydromorphic mineral soils, poorly to very poorly drained, subject to frequent flooding, with gleyed layer at root system height of annual species. Generally, to be exploited, it involves feasible work within reach of the farmer. Melanic Gleysol.
Very strong (VS) Pixel value = 5
Basically mineral soils with the highest degree of hydromorphism. Drainage works are inadvisable and out of reach of the farmer. Haplic Planosol, Argiluvic Plinthosol.
Table 4 – Degrees of limitation by excess water or lack of oxygen, considering attributes and soil classes.
Source: Adapted and adjusted from Ramalho Filho, Beek (1995) and FEAM (2010).
Degree Characteristics
Null (N)
Pixel value = 1 Soils with very low vulnerability to erosion. Slight (SL)
Pixel value = 2 Soils with low vulnerability to erosion. Moderate (M)
Pixel value = 3 Soils with medium vulnerability to erosion. Strong (S)
Pixel value = 4 Soils with high vulnerability to erosion. Very strong (VS)
Pixel value = 5 Soils with very high vulnerability to erosion. Table 5 – Degrees of limitation by vulnerability to erosion.
The degrees of limitation (null = 1, slight = 2, moderate = 3, strong = 4, and very strong = 5) were attributed to the land under natural conditions and also after the use of improvement practices compatible with the different management levels in order to diagnose the behavior of lands under different technological levels, in accordance with the guide table. Three management levels were adopted: level A, level B and level C (RAMALHO FILHO; BEEK, 1995), as defined in table 7, wh ich r epresen t low, medium and h igh technological level in view of economically viable agricultural practices within reach of most farmers. It is important to mention that adoption of the level A is rare n owad ays, excep t wh er e t h e m ech a n i za ti on i s impedimental.
For planted pasture (P) and silviculture (S), management B is foreseen. In the case of natural pasture (N), management A is implied. The lands not suitable for agricultural use are classified as for preservation or restoration of flora and fauna. The possibility of irrigation is not considered, but practices that increase the soil retention water and/or facilitate its infiltration are encouraged (RAMALHO FILHO; BEEK, 1995).
Th e evaluation of th e classes, groups an d subgroups of agricultural suitability of lands was conducted in a GIS environment using ArcGIS® software.
A comparative study between the degree of limitation attributed to lands and those stipulated in the guide table (Table 8) was undertaken.
In ArcGIS® each limiting factor map was reclassified by the reclassify function so that pixels of the same value were grouped, i.e., those that had the same degree of limitation. Through the combine function, the maps of fertility deficiency, water deficiency, oxygen deficiency, vulnerability to erosion and impediments to mechanization were interrelated, generating a map with 642 different combinations of these plans according to the degree of limitation. In the table of attributes related to this map columns were added to the management level A, management level B for use with crops and planted pasture, management level B for use with silviculture and management level C. With the use of the select by attributes
tool, rules were applied that contemplate the conditions required in each line of the table guide, for the management level considered.
Selection rules were applied to the pixels from the most intensive land use, 1ABC, towards less intensive not adequate. Thus, all 68 framing possibilities of the lands were covered in the system, as shown in table 9. To each applied rule, pixels were selected that met them, defining the suitability class to which they belonged. Those that had already been selected in a previous rule, of more
Degree Characteristics
Null (N) Pixel value = 1
Flat relief (slope less than 3%), free drainage soils without the presence of stoniness, rockiness or gravel or other impediments to the use of any machine or agricultural implement with high efficiency throughout the year. Deep soils (Latosols).
Slight (SL) Pixel value = 2
Gently undulating relief (3 to 8% slope), occurrence of limitations that reduce the efficiency of mechanization such as gravel, dense layer at depth . Allows the use of most agricultural machines or implements for almost the entire year. Soils of medium depth (Nitosols and Argisols).
Moderate (M) Pixel value = 3
Undulating relief (8-20% slope), occurrence of limitations that reduce the efficiency of mechanization such as gravelly or drainage constraints. It is possible to use most of the agricultural machinery during the whole year (Cambisols, Plinthosols and Gleysols).
Strong (S) Pixel value = 4
Strongly undulating relief (20-45% slope), occurrence of other limitations such as stoniness, rockiness, so as to restrict the possibilities of mechanized equipment use. Only allows the use of animal traction implements or machines with specialzed wheels (Litholic Neosols).
Very strong (VS) Pixel value = 5
Does not allow the use of machinery, either motorized or animal traction. Mountainous or scarped relief (slope greater than 45%), occurrence of other limitations such as rockiness, stoniness or shallow soils, which prevent the use of machines (Rocky outcrops associated with Litholic Neosols).
Table 6 – Degrees of limitation by impediments to mechanization, considering attributes and soil classes.
intensive use, were removed from the selection, while the remaining ones received symbolization corresponding to the current selection, of less intensive use than the
previous. Once selected, they received the representative symbol of the suitability subgroup to which they belonged, for each management level considered.
Table 7 – Management levels considered. Management
level Characteristics
Level A
Agricultural practices that reflect low technological level. There is little capital investment and research findings for the management, conservation and improvement of land and crop conditions. Agricultural practices rely on manual labor and animal traction. The farmer is serviced by official technical assistance companies and rural extension.
Level B
Agricultural practices that reflect the moderate technological level: modest capital investment and research findings for the management, conservation and improvement of land and crop conditions. The farmer is attended by officials and companies participating in cooperatives or associations. Mechanization is based on animal traction or motor traction with small tractors, owned or rented.
Level C
Agricultural practices that reflect high technology: intensive use of capital and research findings for the management, conservation and improvement of land and crop conditions. There is mechanization in the various farming operation stages. The system includes company and technical assistance is self-administered or via specialized consulting.
Source: Adapted and adjusted from Ramalho Filho, Beek (1995).
Table 8 – Guide table for assessing the agricultural suitability of lands, considering the improvement viability. Agricultural suitability More restrictive degrees of limitation of agricultural conditions for management
levels A, B and C
Group Subgroup Class Fertility deficiency
Water deficiency
Oxygen deficiency
Susceptibility to erosion
Impediments to mechanization
A B C A B C A B C A B C A B C
1 1ABC Adequate SL SL SL SL SL SL SL M SL SL SL SL M SL N
2 2abc Regular M M M M M M M S M M M SL M M SL
3 3(abc) Restricted M M S M S M M S M S M M S M M
4
4P Adequate S M S M M
4p Regular S M S M S
4(p) Restricted S S S M S
5
5S Adequate M M SL M M
5s Regular S M SL M S
5(s) Restricted VS S M VS S
5N Adequate M M M S VS
5n Regular S S S S VS
5(n) Restricted VS VS S S VS
6 6 Not
adequate
FONTE: Adapted from Ramalho Filho, Beek (1995).
Seeking a refinement of the mapping of lands belonging to classes 5N, 5n and 5 (n), in order to consider only those lands whose native vegetation has the economical potential for pasture (it should be emphasized that the areas under forest and caatinga are not considered here as suitable for planted pasture, and their native vegetation, by conception, have no potential for natural pasture), an auxiliary vegetation map was drawn up based on the legend of the soils map (FEAM, 2010) and pixels with these suitability classes were reclassified according to the criteria presented in table 10.
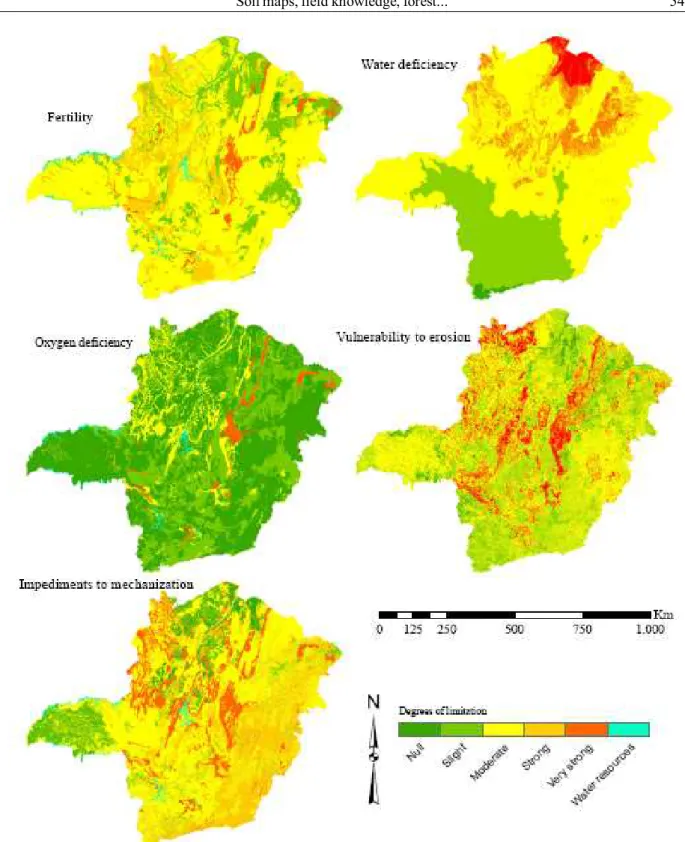
RESULTS AND DISCUSSION
We mapped the lands limitation degrees considering the five key environmental factors (Figure 1). From the joint analysis of figure 1 and table 11 it can be verified that the majority of Minas lands falls in the moderate class regarding limitation degrees by fertility, represented mainly by dominance of Latosols (CURI et al., 2008), thus requiring the considerable applications of correctives and fertilizers. The null degree, representing the most fertile lands, is the least expressive.
Group Characterization Subgroup
1 Lands with adequate suitability for short and / or long cycle crops in at least one of the management levels.
1ABC
1ABc, 1AB(c), 1AB 1aBC, 1(a)BC, 1BC
1Abc, 1Ab(c), 1A(bc), 1Ab, 1A(b), 1A 1aBc, 1aB(c), 1(a)Bc, 1(a)B(c) 1aB, 1Bc, 1(a)B, 1B(c), 1B
1abC, 1(a)bC, 1(ab)C, 1bC, 1(b)C, 1C
2 Lands with regular suitability for short and / or long cycle crops in at least one management level.
2abc 2ab(c), 2ab 2(a)bc, 2bc 2a(bc), 2a(b), 2a 2(a)b(c), 2(a)b, 2b(c), 2b 2(ab)c, 2(b)c, 2c
3 Lands with restricted suitability for short and / or long
cycle crops in at least one of the management levels. 3(abc), 3(ab), 3(bc), 3(a), 3(b), 3(c)
4 Lands with adequate, regular or restricted suitability for
planted pasture. 4P, 4p, 4(p)
5 Lands with adequate, regular or restricted suitability for silviculture or natural pasture.
5SN, 5Sn, 5S(n), 5S 5sN, 5sn, 5s(n), 5s 5(s)N, 5(s)n, 5(sn), 5(s) 5N, 5n, 5(n)
6 Lands not suitable for agricultural use. Not adequate Table 9 – Characterization of possible agricultural suitability of land groups and subgroups.
Table 10 – Economical potential of native vegetation for use as pasture.
Vegetation type Potential for pasture
Cerrado and grassy field. Adequate
Campo Cerrado, grassland, field, rupestrian field. Regular Forest and grassland, cerrado and caatinga, cerrado and forest, path. Restricted
Regarding vulnerability to erosion, the slight class predominates, influenced by soil erodibility, which reveals dominance of the low class in most of the state. When erodibility (attribute intrinsic to the soil) is crossed with slope, it results in a potential risk for erosion, revealing a more ameliorated situation for some regions of the state, because of the wide geographical expression of slopes of less than 20%. The vulnerability of soil to erosion considers the potential risk of erosion, rainfall intensity and soil exposure to the direct impact of raindrops, and the indications are more severe in the East, Central Zone and Northwest and more comfortable conditions in the North followed by the South (CURI et al., 2008).
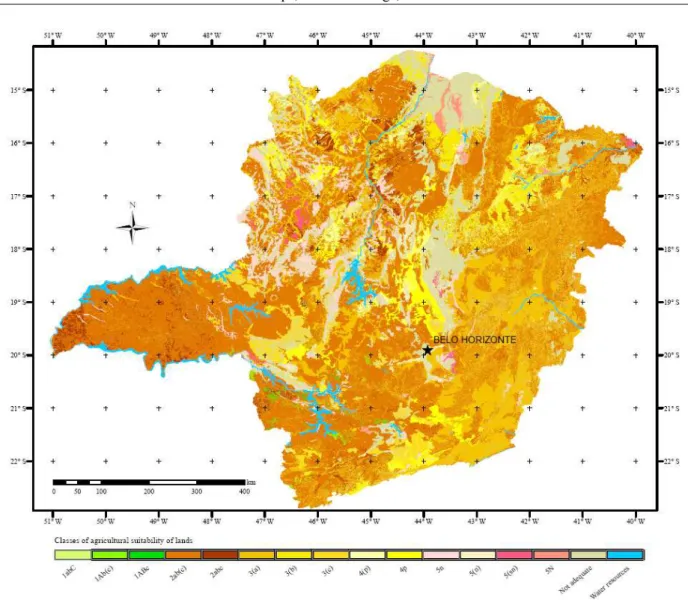
Remember in g, the limitations of lan ds by impediments to mechanization have pronounced influence of the relief, but the occurrence of stoniness, texture and soil depth can negatively influence this aspect, especially in mountainous regions. The limitations by oxygen deficiency reveal a null and slight degree of dominance in most of the state. Limitations by water deficiency are mainly moderate, however, in the North of the state lands with very strong degree are concentrated, related to the occurrence of dry sub-humid or semi-arid climatic regimes. From the limitation degree maps, the land agricultural suitability map of Minas Gerais was generated (Figure 2), and among the suitability groups, group 1 occupies only 0.37% of the total (Table 12) and corresponds to best lands in the state, which in essence, are represented simultaneously by eutrophic soils, dominant flat or gently undulating relief, without impediments to mechanization, without flooding problems and occurrences of humid to super-humid climate.
Group 2 is the most comprehensive, representing 45.13%, with predominance of suitability subgroup 2ab(c). Group 3 totals 30.50% and is represented mainly by lands with undulating to strongly undulated relief, usually resulting in problems for mechanization, due to the presence of both the accentuated relief and the presence
of stoniness or rockiness. Group 4 with 5.27% and Group 5 with 5.31% are little expressive and Group 6 represents 12.60% of the state.
The management level A has the regular suitability class as the most comprehensive, (48.74%), followed by the restricted class (23.11%) and lastly the adequate class (0.93%), as shown in table 13, due mainly to low soil fertility and economic unfeasibility of its correction at this level of management. For the management level B, the most frequent class is also the regular (48.73%), followed by restricted (7.31%) and finally the adequate suitability class (0.07%), as a consequence of both the limitations of natural fertility and the high degree of impediments to the use of agricultural implements in satisfactory conditions. For the management level C, the most expressive class is the restricted (46.04%), followed by regular (2.58%) and adequate (0.08%) classes, mainly related to the difficulties of intensive mechanization of great part of the state lands (Figure 1).
Considering the management, it can be seen that in level A the areas with suitability for crops represent 67.95%, however, with moderate technology (level B) results in 50.36%. In the even more technified management (level C), this value is 48.69%. Also in Table 12, subtracting the lands suitable for planted pasture (5.27%) and natural pasture (5.31%), the not adequate lands (12.60%) and the areas with water resources (0.82%) from the total area, 76.00% of the area of the state that can be used with crops in sustainable conditions, depending on the management level.
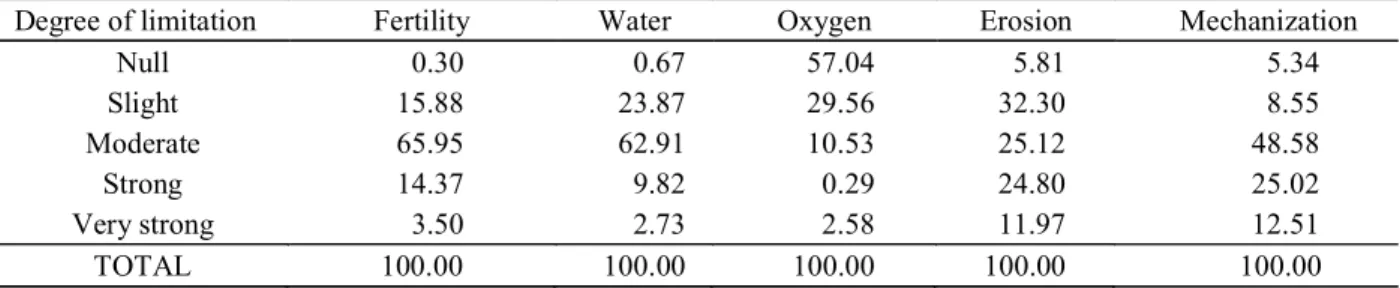
According to table 12, 0.48% of the lands has suitability for silviculture and natural pasture, restricted class 5 (sn), however, lands belonging to more intensive use economical potential suitability classes may be destined to those uses (Table 9), which only characterizes underutilization of land. The not adequate lands for agriculture totaled 12.60%, however, the aspects related to environmental legislation were not considered here, which should increase the scope of this suitability class. Table 11 – Percentage of lands in the state of Minas Gerais with their degrees of limitation on the environmental factors used in the agricultural suitability.
Degree of limitation Fertility Water Oxygen Erosion Mechanization
Null 0.30 0.67 57.04 5.81 5.34
Slight 15.88 23.87 29.56 32.30 8.55
Moderate 65.95 62.91 10.53 25.12 48.58
Strong 14.37 9.82 0.29 24.80 25.02
Very strong 3.50 2.73 2.58 11.97 12.51
CONCLUSIONS
The major land agricultural suitability group of Minas Gerais is the group 2 (regular suitability for crops) representing 45.13% of the total area of the state.
76% of the state area can be used with crops in sustainable conditions.
The geoprocessing in GIS allowed substantial agility on the spatial analysis of agricultural suitability of the lands of Minas Gerais.
ACKNOWLEDGMENTS
To Incra, Fapemig and CNPq, for financial support of the project.
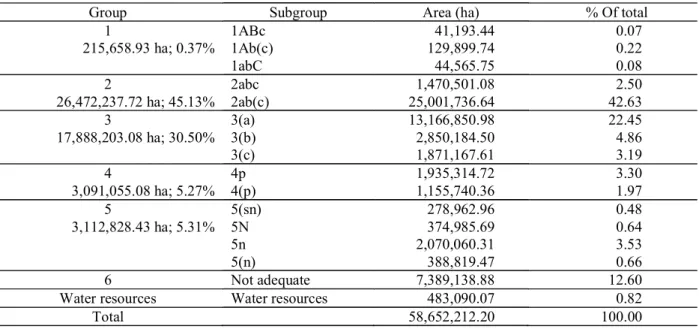
Table 12 – Extent and percentage of groups and subgroups of lands agricultural suitability of Minas Gerais state.
Table 13 – Agricultural suitability of the lands of Minas Gerais, stratified by management level for different types of indicated use.
Use type
Suitability class by management level (%)
Management level A Management level B Management level C
A a (a) B b (b) C c (c)
Crops 0.29 45.21 22.45 0.07 45.43 4.86 0.08 2.58 46.04
Planted pasture 3.30 1.97
Silviculture 0.48
Natural pasture 0.64 3.53 0.66
Total 0.93 48.74 23.11 0.07 48.73 7.31 0.08 2.58 46.04
REFERENCES
AMARAL, F. C. S. do et al. Mapeamento de solos e aptidão agrícola das terras do Estado de Minas Gerais. Rio de Janeiro: Embrapa Solos, 2004. 95 p.
CARVALHO FILHO, A. de; CURI, N.; FONSECA, S. da. Sistema informatizado e validado de avaliação da aptidão silvicultural das terras dos Tabuleiros Costeiros brasileiros para eucalipto. Lavras: Editora UFLA, 2013. 138 p.
CARVALHO, L. M. T.; SCOLFORO, J. R. Inventário florestal de Minas Gerais: monitoramento da flora nativa 2005-2007. Lavras: Editora UFLA, 2008. 357 p.
Group Subgroup Area (ha) % Of total
1 1ABc 41,193.44 0.07
215,658.93 ha; 0.37% 1Ab(c) 129,899.74 0.22
1abC 44,565.75 0.08
2 2abc 1,470,501.08 2.50
26,472,237.72 ha; 45.13% 2ab(c) 25,001,736.64 42.63
3 3(a) 13,166,850.98 22.45
17,888,203.08 ha; 30.50% 3(b) 2,850,184.50 4.86
3(c) 1,871,167.61 3.19
4 4p 1,935,314.72 3.30
3,091,055.08 ha; 5.27% 4(p) 1,155,740.36 1.97
5 5(sn) 278,962.96 0.48
3,112,828.43 ha; 5.31% 5N 374,985.69 0.64
5n 2,070,060.31 3.53
5(n) 388,819.47 0.66
6 Not adequate 7,389,138.88 12.60
Water resources Water resources 483,090.07 0.82
CARVALHO, L. G. de et al. (Ed.). Zoneamento ecológico-econômico do Estado de Minas Gerais: zoneamento e cenário exploratórios. Lavras: Editora UFLA, 2008. p. 89-101.
CURI, N. et al. Solos, geologia, relevo e mineração. In: SCOLFORO, J. R. S.; OLIVEIRA, A. D.; CARVALHO, L. M. T. (Ed.). Zoneamento ecológico-econômico do Estado de Minas Gerais: zoneamento e cenário exploratórios. Lavras: Editora UFLA, 2008. p. 73-88.
_________. Problemas relativos ao uso, manejo e conservação do solo em Minas Gerais. Informe Agropecuário, v. 16, n. 176, p. 5-16, 1992.
EMPRESA BRASILEIRA DE PESQUISA
AGROPECUÁRIA - EMBRAPA. Sistema brasileiro de classificação de solos. 2. ed. Rio de Janeiro: EMBRAPA-SPI, 2006. 306 p.
FUNDAÇÃO ESTADUAL DO MEIO AMBIENTE. Mapa de solos de Minas Gerais: legenda expandida. Belo Horizonte: Fundação Estadual do Meio Ambiente/UFV/ CETEC/UFLA/FEAM, 2010. 49 p.
INSTITUTO BRASILEIRO DE GEOGRAFIA E ESTATÍSTICA - IBGE. Censo demográfico 2010. Disponível em: <http://www.ibge.gov.br/estadosat/>. Acesso em: 21 maio 2013.
MOURA, L. do C. et tal. A aptidão agrícola das terras do município de Machado/MG e a cafeicultura. Caderno de Geografia, Belo Horizonte, v. 17, n. 28, p. 141-162, 2007.
NAIME, U. J. et al. Avaliação da aptidão agrícola das terras da Zona Campos das Vertentes-MG. 1. Ed. Rio de Janeiro: EMBRAPA Solos, 2006. 58 p. (Boletim de Pesquisa e Desenvolvimento, 91).
NASCIMENTO, P. C.; GIASSON, E.; INDA JÚNIOR, A.V. Aptidão de uso dos solos e meio ambiente. In:
AZEVEDO, A. C., DALMOLIN, R. S. D.; PEDRON, F. A. (Ed.). Solos & ambiente: I fórum solos & ambiente. Santa Maria: Pallotti, 2004. p. 41-57.
RAMALHO FILHO, A.; BEEK, K.J. Sistema de avaliação da aptidão agrícola das terras. 3. ed. Rio de Janeiro: Embrapa-CNPS, 1995. 65 p.
RAMALHO FILHO, A.; PEREIRA, L. C. Aptidão agrícola das terras do Brasil: potencial de terras e análise dos principais métodos de avaliação. Rio de Janeiro: EMBRAPA – SOLOS, 1999. 36 p.
RESENDE, M. et al. Pedologia: base para distinção de ambientes. 5. ed. Lavras: UFLA, 2007. 322 p.
SCOLFORO, J. R. S.; OLIVEIRA, D. A.; CARVALHO, L. M. T. Zoneamento ecológico-econômico do Estado de Minas Gerais: zoneamento e cenário exploratórios. Lavras: Editora UFLA, 2008. 136 p.