Audiovisual Quality of Live Music Streaming over Mobile
Networks using MPEG-DASH
Rafael Rodrigues · Peter Pocta · Hugh Melvin · Marco V. Bernardo · Manuela Pereira · Antonio M. G. Pinheiro
Received: 18 July 2019 / Accepted: 7 May 2020
Abstract The MPEG-DASH protocol has been rapidly adopted by most major network content providers and enables clients to make informed decisions in the context of HTTP streaming, based on network and device conditions using the available media representations. A review of the literature on adaptive streaming over mobile shows that most emphasis has been on adapting the video quality whereas this work examines the trade-off between video and audio quality. In particular, subjective tests were undertaken for live music streaming over emulated mobile networks with MPEG-DASH. A group of audio/video sequences was designed to emulate varying bandwidth arising from network congestion, with varying trade-off between audio and video bit rates. Absolute Category Rating was used to evaluate the relative impact of both audio and video quality in the overall Quality of Experience (QoE). One key finding from the statistical analysis of Mean Opinion Scores (MOS) results using Analysis of Variance indicates that providing reduced audio quality has a much lower impact on QoE than reducing video quality at similar total bandwidth situations. This paper also describes an objective model for audiovisual quality estimation that combines the outcomes from audio and video metrics into a joint parametric model. The correlation between predicted and subjective MOS was computed using several outcomes (Pearson and Spearman correlation coefficients, Root Mean Square
This research was co-funded by FEDER-PT2020, Portugal partnership agreement, under the project PTDC/EEI-PRO/2849/ 2014 - POCI-01-0145-FEDER-016693, Fundac¸˜ao para a Ciˆencia e a Tecnologia (FCT/MCTES) under the project UIDB/EEA/50008/2020 and the Instituto de Telecomunicac¸˜oes -Fundac¸˜ao para a Ciˆencia e a Tecnologia (project UID/EEA/50008/2013) under internal project QoEVIS. R. Rodrigues · M. V. Bernardo · M. Pereira · A. M. G. Pinheiro
Instituto de Telecomunicac¸˜oes and Universidade da Beira Interior Covilh˜a, Portugal
E-mail: [email protected] (+351 969401265) P. Pocta
Department of Multimedia and Information-Communication Technology, University of Zilina, Slovakia
H. Melvin
Error (RMSE) and epsilon-insensitive RMSE). The obtained results indicate that the proposed approach is a viable solution for objective audiovisual quality assessment in the context of live music streaming over mobile network.
Keywords MPEG-DASH · QoE · Multimedia Broadcasting · Mobile TV
1 Introduction
Although a relatively recent development, the evolution and penetration of HTTP Adaptive Streaming (HAS) has been rapid over the last years. This has been driven by the very strong commercial case, as evidenced by proprietary solutions that were initially developed by Apple, Adobe and Microsoft. The common objective across these solutions was to provide a media consumption platform that piggy-backed on existing web infrastructure, and that was client driven and adaptive. This allowed the client to make informed decisions based on a range of factors, principally real time network characteristic estimates, user device type/capabilities, and client preferences. The backend server provides the media for consumption, divided into short chunks of a few seconds and rendered multiple times. The server also provides metadata, both at a semantic level (e.g. genre) and physical level (e.g. media structure/formats/bit rates/video frame rates etc) on its stored media in the form of a Media Presentation Description file. The client first pulls this file and makes decisions based on this and the other variables, listed above. Such a model fits very well with best-effort Internet infrastructure and maps well to user demands to consume media on a wide variety of devices under differing scenarios. The proliferation of these proprietary solutions to meet user needs, and the resulting interoperability challenges, necessitated work on standardization, and culminated in the release of MPEG-DASH (Dynamic Adaptive Streaming over HTTP) standard in 2011 [1, 2]. With YouTube and Netflix as key adopters, it has received huge support and adoption rates. Consequently, HAS has been the subject of very significant research that has examined the many variables that make up the full system, and their interaction. A key objective of much of this research is driven by the need to maximize the end user Quality-of-Experience (QoE). In this research the QoE in a mobile network scenario is studied, considering the particular case of live music streaming. The limiting situation of a concert streaming in mobile devices was chosen, specifically because it represents a very special case where bandwidth limitations can easily appear. The specific influence of both audio and video content quality in the global audiovisual quality perceived by the end user is explored. One of the main goals is to pinpoint possible trade-off strategies, which might provide an alternative to typical MPEG-DASH behaviour, where video holds the dominant role in bandwidth management. In this scenario, the effects of stalling, delay or latency are not considered, as they have already been extensively studied in the past [3, 4, 5, 6].
This paper establishes a methodology for audiovisual quality evaluation of live music concert streaming based on the subjective evaluation initially presented in [7]. Trade-off strategies for bandwidth allocation under congested network conditions are derived using MPEG-DASH technology, by providing an effective single-valued measure of overall content quality.
results analysis and discussion. Subjective test scores are presented and analysed in detail using both one-way and two-way Analysis of Variance (ANOVA) tests, whereas the performance of the quality estimation models is assessed by their correlation with the obtained subjective QoE. Finally, Section 5 provides the final conclusions, as well as future work considerations.
2 Background & Related Work
With the huge growth over the last years in multimedia traffic over best-effort IP networks, significant research has been undertaken in both subjective and objective assessment of multimedia quality as perceived by the end-user. However, most studies to date have focused on individual modalities, i.e. audio and video separately. This has resulted in relatively mature and well researched subjective approaches and objective metrics. The subjective approaches include those defined in ITU-T Rec. P.910 [8] and ITU-R Rec. BT.500-13 [9] for video quality, those defined in ITU-R Rec. BS.1116-3 [10] and BS.1534-3 [11] for audio quality and regarding both modalities and those defined in ITU-T Rec. P.911 [12] and ITU-T Rec. P.913 [13] for audiovisual quality. The latter is primarily focused on audiovisual device performance in multiple environments, as well as the quality impact of multiple devices. Regarding the objective quality metrics for audio, these include PEAQ (Perceived Evaluation of Audio Quality) [14], POLQA Music (Perceptual Objective Listening Quality Assessment) [15, 16], and ViSQOL Audio (Virtual Speech Quality Objective Listener) [17]. For video, a whole range of quality metrics exist, such as PEVQ (Perceptual Evaluation of Video Quality) [18], VQM (Video Quality Metric) [19], ST-MAD (Spatiotemporal Most-Apparent Distortion model) [20], MOVIE (Motion-based Video Integrity Evaluation) [21], ST-RRED (Spatiotemporal Reduced Reference Entropic Differences) [22], and FLOSIM [23], among others. It is also common to adapt Image Quality Metrics, such as PSNR (Peak Signal-to-Noise Ratio) and MS-SSIM [24] using the average of frame-wise measurements.
A recent survey on HAS QoE estimation models may be found in [25]. Many of these approaches rely only on video quality measures or take into account only video-related impairments. Tran et al. [6] studied a multi-factor model for quality prediction in HAS over mobile networks. The proposed QoE model relied on three different video-related factors, based on the quality switches, interruptions/stalling and initial delay. In [26], the authors proposed a cumulative quality model, based on quality variation histograms computed within a sliding window of video segments. Duanmu et al. [27] proposed an approach based on the Expectation-Confirmation Theory, in which the instantaneous QoE is evaluated by comparing the intrinsic quality of the current segment with that of the previously viewed segments. The intrinsic quality
of a given segment considers both spatial (coming from video quality metrics) and temporal (frame rate) information. More recently, machine learning approaches are also being considered. The authors in [28] used a Long Short-Term Memory (LSTM) network to estimate the overall QoE in the context of adaptive streaming, using input features such as the content-specific characteristics, occurrence and duration of stalling events, and segment quality measure.
Subjective tests have clearly shown that there is a strong inter-relationship between audio and video quality [29], and thus research has progressively focused on developing combined audiovisual models. The authors in [30] focused on the relative importance of the audio and video quality in the audiovisual quality assessment and questioned whether a regression model predicting audiovisual quality can be devised that is generally applicable. They have concluded on the basis of a comprehensive analysis of the available experimental data, covering different application areas ranging from television and UDP-based video streaming to video-teleconference, that audio quality and video quality are equally important in the overall audiovisual quality. Moreover, the application dictates the relative range of the audio and video quality examined and this can result in findings that suggest that one factor has greater influence than the other. This research aims to add to the knowledge base in designing such a joint model for the particular scenario of live music streaming deploying MPEG-DASH.
In [31], a review of audio and video quality metrics is presented, as well as a study of the key issues in developing joint audiovisual quality metrics. In particular, it outlines the common approach to deriving audiovisual quality (AVQ) from the audio quality (AQ) and visual quality (VQ) as follows:
AVQ= a0+ a1AQ+ a2VQ+ a3AQVQ (1) where parameters (a1, a2, a3) denote the different weights of audio and video quality and the multiplication factor (AQVQ), with a0as a residual term. Despite this seemingly simple approach, this is a significant challenge with many influences and contextual factors. For example, in [32], two experiments were carried out in order to develop a basic multimedia (audiovisual) predictive quality metric. The first used two ’head-and-torso / shoulder’ audio-video sequences and the second one has deployed one of the ’head-and-torso / shoulder’ sequences from the first experiment together with a different high-motion sequence as test material. Whilst, the overall result of the studies confirmed that human subjects integrate audio and video quality together using a multiplicative rule, the specific results differed. A regression analysis using the subjective quality test data from each experiment found that:
1. For ’head-and-torso / shoulder’ content, both modalities contribute significantly to the predictive power of the resultant model, although audio quality is weighted slightly higher than video quality;
2. For high-motion content, video quality is weighted significantly higher than audio quality.
Finally, two different parametric audiovisual quality estimation models were designed using the subjective quality test data acquired within this research, one
P.NATS – Parametric non-intrusive assessment of TCP-based multimedia streaming quality, considering adaptive streaming, resulting in a set of recommendations, i.e. ITU-T Rec. P.1203 [33], ITU-T Rec. P.1203.1 [34], ITU-T Rec. P.1203.2 [35] and ITU-T Rec. P.1203.3 [36]. The aim was to develop a collection of objective parametric quality assessment modules that predict the impact of observed IP network impairments on quality experienced by the end-user in multimedia mobile streaming and fixed network applications using progressive download, also including adaptive streaming methods.
In [37], the authors have applied a parametric model based on the approach proposed in the P.NATS for HAS end-user quality estimation. Quality assessment took into account both audio and video bitrate, as well as content length information. Video resolution and stalling events were also input factors. Martinez and Farias proposed in [38] a parametric approach for audiovisual quality estimation, which focuses on RTP-based streaming. In this paper, subjective and objective quality was assessed for different quality levels of audio and video, with constant bitrates. A QoE estimation model was proposed, considering different combinations of audio and video quality metrics.
Considering the previously proposed QoE estimation methods mentioned in this section, it should be noted here that none of them was particularly designed for live music streaming applications.
For subjective quality assessment of HAS and QoE impact factors, comprehen-sive reviews may be found in [39] and [25]. Most of the published HAS-related sub-jective studies follow a strong tendency to focus only on the influence of video im-pairments on the perceived audiovisual quality. Some examples are covered below. In [4], the authors describe a subjective study, which relies on both spatial and temporal quality factors to derive a QoE measure for video HAS. An extensive set of test con-ditions was created considering temporal factors such as the initial delay and stalling (total duration vs. frequency) and spatial quality of the video content (quality level variations). In this particular case, the average quality level, the number of switches and the average magnitude of the switches were taken into account. The predicted Mean Opinion Score (MOS) provided by the developed user experience model shows a high linear correlation with subjective test results (0.91). A study of the correlation between QoE and Quality of Service (QoS) for an HTTP video streaming scenario is presented in [5]. A set of performance metrics were used, considering both buffering related parameters (initial delay, stalling duration and frequency) and video qual-ity switches. Among the drawn conclusions, it is stated that the temporal structure has a prominent impact on the QoE, with the rebuffering frequency being identified as the main factor affecting MOS. The influence of several factors in the QoE of video streaming over HTTP was studied in [40], through crowdsourcing subjective tests. Besides other relevant conclusions, the results clearly identify stalling events
as dominant in the quality perceived by the end-user. Vriendt et. al [41] evaluated the performance of a number of parametric quality prediction models for adaptive video streaming to mobile devices. Subjective tests were carried out using 2 differ-ent clips, from which 90 differdiffer-ent test conditions were obtained, considering video quality switches between 6 different quality levels. The model parameters were de-rived using different characteristics of the test samples: nominal bitrate, quality level, PSNR and SSIM average and standard deviation and chunk MOS (MOS per qual-ity level). The obtained results indicate that chunk MOS approach provides the best correlation with the subjective MOS, followed by the averaged SSIM. The authors in [42] studied the perceptual impact of quality adaptation strategies and content on the perceived quality of video streaming. A wide range of study cases was created by combining different temporal video bitrate dynamics, initial bitrate conditions, chunk sizes and visual content. The reported results indicate a significant preference for gradual quality changes over long chunks (10 seconds). In [43], the Absolute Cat-egory Rating (ACR) methodology was used to evaluate QoE in relation to the scaling dimensions of High Efficiency Video Coding (HEVC/H.265), by varying the frame rate, spatial resolution and codec quantization parameter. Takahashi et al. [44] anal-ysed the impact of the average video bitrate, stalling and the initial loading delay on the cumulative quit rate of users on smartphones with full HD resolution, who were allowed to freely search and change between videos under varying network condi-tions.
The influence of audio presence was investigated by Tavakoli et al. [45], following an evaluation of the video-related impairments previously studied in [42]. This study shows that audio has only a minor impact (a Pearson correlation coefficient of 0.93 between Audio and No audio tests was reported) on overall quality perceived by the end user, assessed according to the methodology defined in ITU-T Rec. P.910 [8]. Moreover, when it comes to quality adaptation strategies, a correlation between MOS obtained for a whole sequence and MOS for processed sequences was always lower when an audio part was involved in the test.
When it comes to optimizing bandwidth utilization, [46] describes the EnvDASH system, an environment-aware adaptive streaming client based on MPEG-DASH that adapts the quality of audiovisual content according to viewing and listening conditions as well as the user’s interest. It deploys a sensed environment, sensing separately the viewing and listening conditions as well as the user’s interest in the content. This is done in order to reduce network traffic generated by the corresponding streaming service or application in situations where the user is not able to fully enjoy high quality video and audio, e.g. while travelling over rough terrain. According to the experiment presented in the paper, a 5.3% bandwidth saving was achieved with the proposed system over all the subjects/users involved in the experiment.
In the available literature, no study exists that explicitly deals with the impact of audio quality, and more specifically the trade-off in relative bandwidth utilization on audiovisual quality experienced by the end user in the context of HAS. Such insights may be very useful for TV broadcasters and video content delivery providers, such as Netflix, YouTube, Amazon, and Hulu, that are interested in optimizing their client-side quality adaptation strategies. Such insights can inform decisions about the range
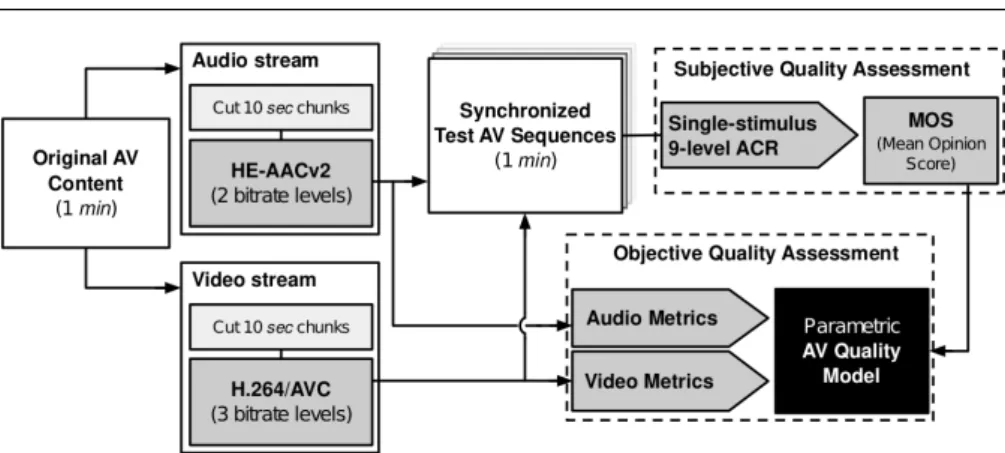
Fig. 1 Flowchart of the proposed methodology.
of both audio and video content quality rendered, so as to provide the end user with the best quality possible considering the mix of corresponding network conditions, user device capabilities, and user preferences. It is worth noting here that with very few exceptions, the quality adaptation strategies up to now have uniquely focused only on adapting the quality of the video content.
Thus, this research deals with the combined effect of varying the quality level of both audio and video content on the audiovisual quality experienced by the end user, in the context of HAS, while considering the particular case of live music concert streaming. To do so, a subjective test has been run according to ITU-T Rec. P.911 [12] simulating a live music concert transmitted over a mobile network with varying congestion levels. In terms of content, recorded live music performances were deployed, as this constitutes a very common use-case scenario. Moreover, this scenario represents a good example of the situation whereby the quality of audio should play a crucial role, i.e. music concert. Insights arising from this study will allow HAS content providers to optimize the use of limited bandwidth in terms of the trade-off between video and audio. Moreover, on the basis of the subjective quality test data presented in this paper, a parametric model was designed to estimate the audiovisual quality experienced by the end user in the context of recorded live music streaming deploying MPEG-DASH. A conceptual diagram of the proposed approach is depicted in Fig. 1.
3 Methods
3.1 Subjective test design
3.1.1 Source videos and impairment design
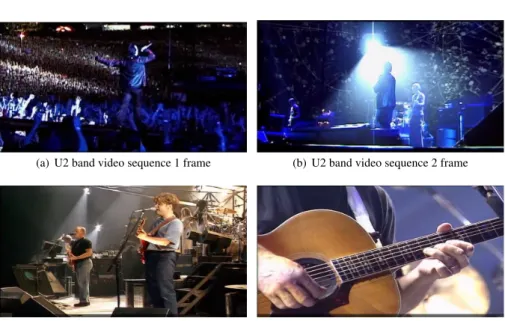
Live music performances from two different bands - U2 and Pink Floyd - were ripped from DVD to provide source content. There is a clear differentiation between the content from both bands. In U2 videos, there is constant movement involving fast camera and light changes. On the other hand, Pink Floyd videos have less on-stage
(a) U2 band video sequence 1 frame (b) U2 band video sequence 2 frame
(c) Pink Floyd band video sequence 1 frame (d) Pink Floyd band video sequence 2 frame
Fig. 2 Representative frame of each sequence used on the subjective tests.
movement and both camera and light changes are, generally, slower. In terms of audio, U2 videos have a lot more interference from the audience.
The source videos were resized to 480p (854x480), which is standard definition deployed in mobile streaming [47]. It is important to note that the initial source content had a spatial resolution of 720x576 and was resized using the FFmpeg software1 to match a 16:9 aspect ratio screen, which is the case of the mobile set used for testing. Video resizing and upscaling would be also automatically done by the mobile set in a real life situation.
The video frame rate was 25 frames per second. Four 1 min long sequences were selected (Fig. 2) and cut into 10 second chunks, according to the results reported in [45], representing a typical DASH chunk size deployed by popular streaming services, e.g. Apple HTTP Streaming 2. FFmpeg software was used to encode demuxed video and audio at different compression rates. Audio chunks were encoded using High Efficiency Advanced Audio Coding v2 (HE-AAC v2) scheme [48], at two different quality levels, i.e. 128 kbps and 24 kbps. 128 kbps is a common bitrate in audio experiments and also extensively used in audiovisual content streaming, which delivers high quality audio. To attempt the introduction of distortions that could affect audio quality, the low end of the HE-AACv2 range of operation was chosen as a low quality level (24 kbps). It should be noted here that stereo audio signals were used in this experiment. Video chunks were encoded with the H.264/AVC video coding standard [49] at three quality levels (H: 512 kbps, M: 256 kbps and L: 128 kbps),
1 https://www.ffmpeg.org/
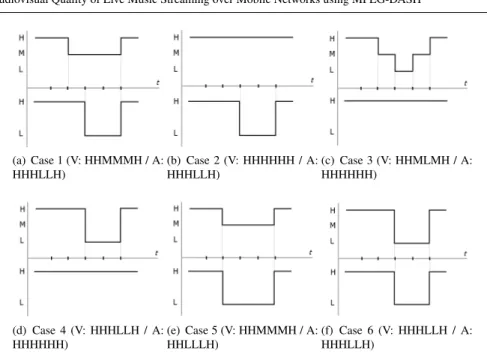
(a) Case 1 (V: HHMMMH / A: HHHLLH) (b) Case 2 (V: HHHHHH / A: HHHLLH) (c) Case 3 (V: HHMLMH / A: HHHHHH) (d) Case 4 (V: HHHLLH / A: HHHHHH) (e) Case 5 (V: HHMMMH / A: HHLLLH) (f) Case 6 (V: HHHLLH / A: HHHLLH)
Fig. 3 Temporal dynamics of impairments test cases. Video profiles (V) are in the upper half (H. 512 kbps, M. 256 kbps, L. 128 kbps) and audio profiles (A) in the lower half (H. 128 kbps, L. 24 kbps)
which are within the range deployed in [41], with a spatial resolution of 854x480. These bitrates represent multiples of the high quality audio bitrate, i.e. 128 kbps, in order to create a balance in terms of the audio and video quality perceived by the end user, allowing us to study a tradeoff between video and audio bitrates in the selected video streaming context. It should be noted that audio and video were synchronous in all experiments, as that issue was not the aim of this study.
Fig. 3 depicts the different impairment cases created through the concatenation of the diverse encoded streams into 1 min long mp4 files (6 x 10 sec). These impairments involve different tradeoffs between audio and video quality levels, simulating diverse network congestion situations. Audio degradation only is simulated in case 2, while video degradation only is represented by cases 3 and 4. Simultaneous degradation of audio and video is simulated in the remaining cases (1, 5 and 6). As evident, cases 1 and 5 are similar to cases 3 and 4, respectively, in terms of bit rate request. Case 6 includes sequences with lowest total bandwidth level.
Most of the previous research in the context of HAS considers larger datasets of streaming sessions or impairments in their design, e.g. [41, 4], which is necessary to draw general conclusions that cover a broad scope of scenarios. In our research, a more specific use-case of HAS, i.e. live music concert streaming to mobile devices, is considered, with a focus on both audio and video quality. Regarding the experiment design, the number of test conditions involved in the test had to be limited in order to avoid participants fatigue in the subjective test (described in the next section), while maintaining reasonable content diversity. Taking into account the extensive studies considering different encoding scenarios and content, we believe that the final range
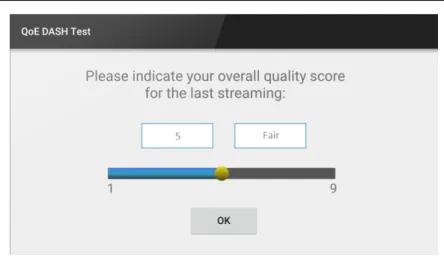
Fig. 4 Rating screen in Android App used for subjective tests
of test conditions lead to representative, plausible and interesting combinations, both in terms of spatial and temporal information.
3.1.2 Test methodology
A single-stimulus study was conducted at the Image and Video Technology Laboratory, Universidade da Beira Interior (UBI) [7]. The study followed the ITU-T standard on subjective audiovisual quality assessment methods for multimedia applications (ITU-T Rec. P.911) [12], which recommends a minimum of 15 participants, in order to obtain statistically reliable data. A total of 32 subjects participated in this study, consisting mostly of students from UBI, from which 21 were male, with ages ranging between 18 and 35 years (mean 24 years), and 11 were female, with ages ranging between 18 and 22 (mean 20 years). Subjects were selected to best represent the target end user group of live music streaming services.
Test sessions, with an average duration of 20 minutes, were carried out in a controlled environment. Subjects were given LG Nexus 5 smartphones (quad-core, 4.95” screen with a resolution of 1920x1080) and stereo headphones (Philips SL3060). The experiment was ran using an Android app designed specifically for this purpose. The app provided full screen visualization of the test sequences, as well as a rating screen (Fig. 4) presented after each visualization, which included a calibrated bar for a nine-level ACR. Like in many real applications, the test content resolution was smaller than the display resolution, and thus an automatic resizing was made to allow a full screen visualization.
Hidden, or non-explicit, references were included in all sessions of the subjective test. The experimental setup did not support the original quality references, due to some hardware limitations associated with the mobile devices deployed in the test, i.e. memory and processing power limitations of the mobile device. Hence, the in-test references consisted in non-distorted sequences, in the sense that both audio and video were kept at the maximum quality levels among the available representations (A: 128 kbps, V: 512 kbps). It should be noted here that both audio and video
avoid the consequent bias in the results. The test design ensured that each impaired sequence was viewed the same number of times, i.e. 16. Each subject thus attended a single session, in which 12 impaired sequences were randomly presented plus the 4 reference sequences. The actual test session was preceded by 2 training sequences, not included in the test set, which reproduced similar impairments for different sequences of the available content, to adapt the subject to the viewing conditions and context of the test.
With the objective of studying the impact of audio and video distortions on global quality perception, subjects were explicitly prompted to score each test sequence according to their perceived global quality, i.e. taking both audio and video quality into consideration. In this study, the resulting subjective quality for each tested sequence is represented by MOS, which is commonly deployed in HAS studies [4, 5, 40, 41, 42, 45]. Analysing the differential MOS (DMOS) might help scatter the content dependency of the results and improve the discrimination power of the test. However, it is worth noting here that it was not possible to use DMOS, commonly used in video quality studies, as it was not feasible to obtain subjective quality scores for the original quality sequences. MOS from the different test sequences was compared individually with the respective references MOS, using one-way ANOVA tests. Moreover, individual modality comparisons (i.e. audio-only or video-only impairment sequences) were also studied with ANOVA, to obtain insights on the actual impact of each modality distortion on the global quality perceived by the end user.
3.2 Objective Quality Assessment
3.2.1 Audio and video quality metrics
Objective quality of the test sequences was measured using a set of 6 video quality metrics and 2 audio quality metrics. The metrics chosen for video quality assessment were PSNR, SSIM [50] and MS-SSIM [24], using the averaged frame-by-frame output [41], ST-MAD [20], ST-RRED [22], and VQM [19]. MOVIE [21] and FLOSIM [23] were also considered, however both metrics ran excessively slow and did not provide reasonable predictions with the used dataset. For audio quality metrics, POLQA Music [15, 16] and ViSQOL Audio [17] were used. At an initial stage, the PEAQ model, standardized as ITU-R Recommendation BS.1387, was also involved. However, PEAQ failed to provide reasonable predictions, perhaps due to a varied delay/clock drift present in the test signals, caused by different encoding rates, or/and simply by the corresponding implementation of HE-AAC v2 codec. It is worth noting here that PEAQ was not designed for these degradations.
All the used metrics are full-reference methods, i.e. they all include the original signal/reference in the quality assessment process. It should be noted that the metric references are different from those included in the subjective test. Due to limitations of the mobile handsets used for the tests, a choice was made on using sequences continuously encoded at high quality as non-explicit test references. However, these would probably contain coding artefacts, even though at an imperceptible level, that would bring a systematic bias into the objective quality assessment. Hence, the resized maximum quality videos (480p) were used as a reference for metric computation. In the case of video measurements, the Y component from the raw uncompressed YUV-format video sources was used, whereas in the case of audio measurements, uncompressed audio (wav format, Stereo, 44100Hz) was used.
3.2.2 Audiovisual quality model
Another objective of this work was to derive a joint audiovisual model which can effectively characterize/estimate the global quality perception of live concert streaming, as obtained from the subjective tests. As mentioned in section II, the model shown in equation (1) is a common approach when deriving audiovisual quality (AVQ) [31]. In this study, a parametric regression was used to fit the normalized MOS data (MOSn), considering both audio (AQ) and video (VQ) objective quality outputs, which were also normalized prior to data fitting. Data range was normalized into [0, 1], using xn= (x − min(x))/(max(x) − min(x)).
MOS predictions (MOSp) were obtained by mapping MOSninto the resulting models. Data fitting was done using the Curve Fitting tool of MATLAB. Moreover, an extension of the mentioned model was also investigated, with the inclusion of quadratic terms of both audio and video quality metrics. These terms increase the degrees of freedom in the audiovisual model, which are expected to improve the fitting to MOSnand finally the model accuracy. Hence, this extended model is defined as follows:
AVQ= a0+ a1AQ+ a2VQ+ a3AQVQ+ a4A2Q+ a5VQ2 (2) with the addition of quadratic terms for audio (A2
Q) and video (VQ2) and respective weight coefficients a4and a5. This model extends the quadratic model where only a3AQVQ was used. Adding third order terms would lead to extra complexity and would also run the risk of over-fitting.
A goodness-of-fit analysis of each joint audiovisual model was carried out. The coefficients of the fitted models were also analysed for a better understanding of the relative influence of separate audio and video quality in each joint metric. Finally, MOSpfor each joint audiovisual metric were computed, to assess which combination of metrics provide the best characterization of the MOS from the subjective tests. The performance of the proposed models is evaluated using a series of statistical evaluation metrics, which include the Pearson Linear Correlation Coefficient (PLCC), the Spearman Rank Order Correlation Coefficient (SROCC), the Root Mean Squared Error (RMSE) and the epsilon-insensitive RMSE (RMSE*), as defined in ITU-T Rec. P.1401 [51], using the subjective evaluation results as baseline.
(a) All videos
(b) U2 band videos
(c) Pink Floyd band videos
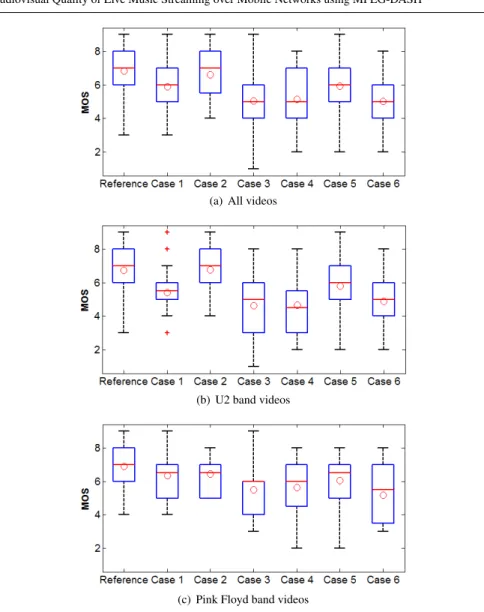
Fig. 5 Overall distribution of the subjective test scores. The boxes include data between the 25thand the 75thpercentiles. Median values and Mean Opinion Scores (MOS) are indicated by the line and the circle inside the boxes, respectively. Outliers are indicated by the crosses.
4 Results and Analysis
4.1 MOS data analysis
Following the ITU-T Recommendation BT.500 [9], subjective test results were screened to discard subjects whose ratings present a strong shift compared to the average behaviour. According to this analysis, no subject should be discarded.
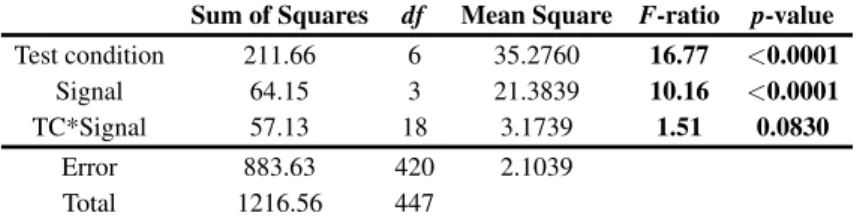
Table 1 Summary of two-way ANOVA test conducted on the MOS values.
Sum of Squares df Mean Square F-ratio p-value Test condition 211.66 6 35.2760 16.77 <0.0001
Signal 64.15 3 21.3839 10.16 <0.0001 TC*Signal 57.13 18 3.1739 1.51 0.0830
Error 883.63 420 2.1039 Total 1216.56 447
Fig. 5 presents box plots of the subjective scores obtained from the experiment, considering all stimuli (Fig. 5(a)) and stimuli separated into U2 (Fig. 5(b)) and Pink Floyd (Fig. 5(c)). MOS of each impairment is indicated by a circle. A two-way ANOVA test was initially conducted over the entire data (Table 1) to analyse the statistical significance of both signal (i.e. audiovisual content) and test conditions (i.e. impairments designed for the test). The ANOVA outcome shows that subjects revealed higher sensitivity to the test conditions (F-ratio = 16.77, p < 0.0001) than to the investigated signals (F-ratio = 10.16, p < 0.0001). The interaction between the involved factors is not statistically significant (F-ratio = 1.51, p = 0.0830).
An initial analysis of the data shown in Fig. 5(a) reveals that case 2 (audio-only impairments) achieved the best MOS after the reference. MOS of case 2 is slightly lower when compared to reference MOS, which shows that listeners were able to detect lower audio quality when no video distortion is present. Nonetheless, this difference is not statistically significant. Moreover, cases 3, 4 and 6, where video quality is dropped to the lower available level for 1-2 10 sec chunks, yield the worst MOS and are quite similar to each other.
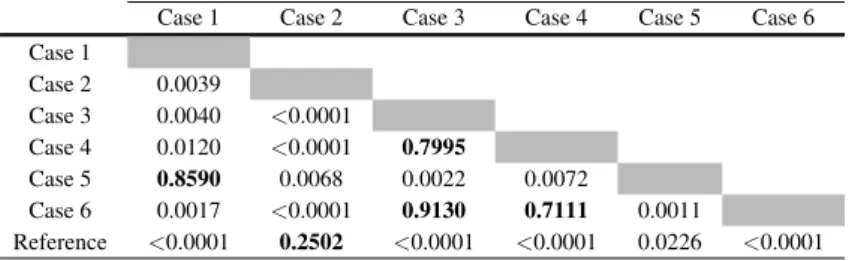
One-way ANOVA tests (CI = 95%) were carried out over this data (Table 2). Normal distribution of the data was confirmed by a Kolmogorov-Smirnov test [52]. Some important conclusions arise from these outcomes. MOS similarity between audio-only impairment scores and the reference scores was previously discussed. The similarity between MOS of cases 1 and 5 (p = 0.8590) further shows that audio distortions do not affect the global quality perception, even when the distortions span a longer period of time. MOS values of cases 3 and 4 are statistically similar to MOS of case 6 (p = 0.9130 and p = 0.7111, respectively). Taking a look at directly comparable cases, in terms of bandwidth requirements, ANOVA shows a statistical difference between MOS of cases 1 and 4 (p = 0.0120) and also between cases 3 and 5 (p = 0.0022), with higher MOS for the cases with video encoded at 256 kbps and audio encoded at 128 kbps. Based on these results, it is possible to conclude that the perceived quality is not significantly affected by lower audio quality, particularly when video distortions are present.
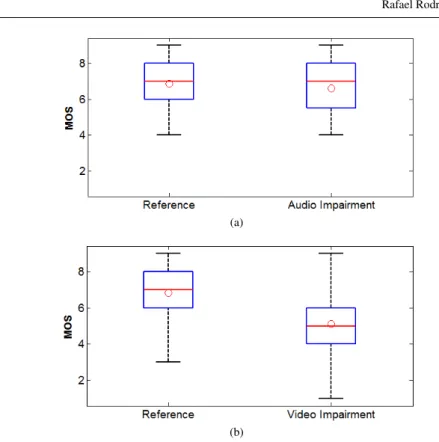
Fig. 6 shows data box plots of the subjective test scores with all stimuli for audio-only impairments (case 2) and video-audio-only impairments (cases 3 and 4), in comparison with the corresponding references. It should be noted that for the statistical analysis, reference data consists of the paired reference scores in each test. For example, if a given subject saw impairment case 2 for U2 video 1 and Pink Floyd video 2, the scores for U2 video 1 and Pink Floyd video 2 references from the same test are considered. It becomes apparent, from the observation of the data box plots in Fig. 6 that video
Case 4 0.0120 <0.0001 0.7995
Case 5 0.8590 0.0068 0.0022 0.0072
Case 6 0.0017 <0.0001 0.9130 0.7111 0.0011
Reference <0.0001 0.2502 <0.0001 <0.0001 0.0226 <0.0001
Table 3 One-way ANOVA p-values for impairment comparison with U2 videos (results above p = 0.05 are highlighted).
Case 1 Case 2 Case 3 Case 4 Case 5 Case 6 Case 1 Case 2 0.0005 Case 3 0.0587 <0.0001 Case 4 0.0673 <0.0001 0.9443 Case 5 0.3101 0.0116 0.0068 0.0079 Case 6 0.1461 <0.0001 0.5421 0.5911 0.0168 Reference 0.0003 0.5916 <0.0001 <0.0001 0.1098 <0.0001
Table 4 One-way ANOVA p-values for impairment comparison with Pink Floyd band videos (results above p = 0.05 are highlighted).
Case 1 Case 2 Case 3 Case 4 Case 5 Case 6
Case 1 Case 2 0.7722 Case 3 0.0237 0.0060 Case 4 0.0718 0.0280 0.7548 Case 5 0.4421 0.2596 0.1336 0.2763 Case 6 0.0037 0.0007 0.4260 0.2980 0.0284 Reference 0.0507 0.2617 <0.0001 0.0004 0.1071 <0.0001
impairments have a greater impact than audio impairments on the quality perceived by the end user.
Statistical analysis of these results was also performed, after confirming the normal distribution of the data using the Kolmogorov-Smirnov test [52]. A one-way ANOVA test (CI = 95%) was ran to evaluate the statistical significance of the differences between the mean values of the impairment scores and the respective references. ANOVA tests yielded a p-value of 0.4431 for audio-only impairments and a p-value of 1.71×10⁻¹⁷for video-only impairments. Therefore, it may be concluded that differences in quality perception in cases with only audio distortion are not statistically significant (p > 0.05), whilst for cases with only video distortion these differences are statistically significant (p < 0.05).
As mentioned in the description of the source content, this experiment included representations of two different contexts. Hence, one-way ANOVA (CI = 95%) was
(a)
(b)
Fig. 6 Comparison of subjective test scores of both audio (a) and video (b) impaired sequences with the subjective test scores of the respective references. The boxes include data between the 25thand the 75th percentiles. Median values and Mean Opinion Scores (MOS) are indicated by the line and the circle inside the boxes, respectively.
also performed differentiating the content of each band, to analyse the possible influence of the type of content (Tables 3 and 4). Statistical similarities found with undifferentiated content were also found for both U2 and Pink Floyd bands video groups. Regarding the U2 band related data, there is statistical similarity between case 5 and the reference (p = 0.1098). A gradual reduction of total bandwidth requirements to 280 kbps (V + A: 256 kbps + 24 kbps) did not cause a significant loss in the quality experienced by the end user. In this profile, the audio quality variation allows the reduction of total bandwidth to a level close to those of cases 3 and 4 (256 kbps), where global quality perception is affected by low video quality. The results obtained from Pink Floyd sequences suggest that audio distortions are less negligible, which may arise from a higher focus on the specific musical content, as a clearer difference may be seen between MOS from case 2 and the reference in Fig 5(c). However, this difference is not statistically significant. Nevertheless, case 5 is also statistically similar to its reference (p = 0.1071), as well as case 1 (p = 0.0507), where an abrupt bandwidth reduction to 280 kbps is simulated. analysing the directly comparable bandwidth cases (1-4 and 3-5), although MOS values for 1 and 5 (video quality
POLQA+ST-MAD 0.2108 -0.1615 0.6359 0.2560 POLQA+ST-RRED 0.2749 -0.2951 0.6074 0.2807 POLQA+VQM 0.3807 -0.2317 0.2155 0.7657 ViSQOL+PSNR -0.0240 0.2867 1.1686 -0.4882 ViSQOL+SSIM 0.2853 -0.1501 0.7625 0.0449 ViSQOL+MS-SSIM -0.0226 0.0484 0.9704 -0.0311 ViSQOL+ST-MAD 0.0492 0.0358 1.0230 -0.2519 ViSQOL+ST-RRED 0.2093 -0.3006 0.7461 0.1986 ViSQOL+VQM -0.0503 0.3482 1.0764 -0.3674
loss compensated with audio at 128 kbps) are still higher than their related cases, a statistical separation of MOS is more apparent for U2 over Pink Floyd content. In fact, a statistical similarity is registered for both of these comparisons in Pink Floyd, with particular relevance for cases 3 and 5. Hence, a possibility of compensating video quality losses with audio seems to be content-dependent to a certain extent.
Some marginal conclusions may be derived from the reported results. Scores of cases 3 and 4 are statistically similar to each other (p = 0.7995). Hence, highly noticeable video distortions cause a great impact on the perceived quality of a given audiovisual stream, with both gradual or abrupt bit rate variations. Furthermore, other marginal conclusions of this study may be drawn. Impairment case 1 of U2 videos, (video bit rate is dropped to 256 kbps), shows statistical similarity with cases 3 (p = 0.0587), 4 (p = 0.0673) and 6 (p = 0.1461), where the video bit rate drops to a 128 kbps. These results show that an identical loss in global quality experienced by the end user may be caused by both smaller or larger variations in video quality, when the visual content involves rapid movement and/or camera changes.
4.2 Audiovisual quality model
The coefficients obtained from the parametric model regression are shown in Tables 5 (model 1) and 6 (proposed model). Regarding the model 1 coefficients, a2(weight of the video quality metric, VQ) assumes a higher absolute value than a1(weight of the audio quality metric, AQ) for the majority of metric combinations. This is well in line with the subjective results discussed above, which suggested that video may be the most determining factor in global perceived quality. In the proposed model, a similar tendency is observable as coefficients a2and a5 (weight of the quadratic term of video quality metric, VQ2) have, in general, a bigger absolute value than both a1 and a4(coefficients of the audio metric and the quadratic term of audio metric, respectively). Furthermore, both models also consider a term AQ.VQ, which refers to
Table 6 Parametric regression coefficients for the proposed model. a aa000 aaa111 aaa222 aaa333 aaa444 aaa555 POLQA+PSNR 0.1333 0.2393 1.0220 0.5615 -0.3640 -0.6692 POLQA+SSIM 0.2025 0.5267 1.0100 0.7539 -0.8564 -0.8009 POLQA+MS-SSIM 0.0066 -0.3312 1.1730 -0.0228 0.3271 -0.1674 POLQA+ST-MAD 0.2047 -1.5570 1.5600 -0.2752 1.4320 -0.3119 POLQA+ST-RRED 0.3426 -0.4586 0.3874 0.2498 0.1319 0.2557 POLQA+VQM 0.2496 -0.1196 0.7198 0.6434 -0.0121 -0.4460 ViSQOL+PSNR -0.2604 0.1738 2.2850 -0.5898 0.2779 -1.0530 ViSQOL+SSIM 0.2705 -0.7050 1.4080 0.4156 0.4629 -0.8561 ViSQOL+MS-SSIM -0.0986 0.3929 1.1540 -0.0325 -0.3575 -0.1734 ViSQOL+ST-MAD -0.0193 0.6640 1.1480 0.0115 -0.8016 -0.2635 ViSQOL+ST-RRED 0.1997 -0.0681 0.6553 0.2180 -0.2603 0.0798 ViSQOL+VQM -0.3555 0.6933 2.2190 -0.6849 -0.0962 -0.9924
Table 7 Goodness-of-fit measures for audiovisual quality models.
Model 1 Proposed Model
R2 Ad jR2 ∑ E2 R2 Ad jR2 ∑ E2 POLQA+PSNR 0.6434 0.5988 0.8328 0.6764 0.6029 0.7557 POLQA+SSIM 0.7581 0.7279 0.5649 0.8417 0.8057 0.3698 POLQA+MS-SSIM 0.8565 0.8385 0.3352 0.8621 0.8307 0.3222 POLQA+ST-MAD 0.6360 0.5905 0.8501 0.7032 0.6357 0.6932 POLQA+ST-RRED 0.8528 0.8344 0.3438 0.8605 0.8288 0.3257 POLQA+VQM 0.6717 0.6307 0.7666 0.6862 0.6148 0.7330 ViSQOL+PSNR 0.6507 0.6070 0.8159 0.7222 0.6591 0.6488 ViSQOL+SSIM 0.7276 0.6936 0.6362 0.7917 0.7444 0.4865 ViSQOL+MS-SSIM 0.8573 0.8395 0.3332 0.8684 0.8385 0.3073 ViSQOL+ST-MAD 0.6428 0.5982 0.8342 0.6874 0.6164 0.7300 ViSQOL+ST-RRED 0.8732 0.8573 0.2962 0.8800 0.8527 0.2802 ViSQOL+VQM 0.6895 0.6507 0.7252 0.7543 0.6984 0.5739
an interaction between both individual quality measures (a3, in the fourth column of Tables 5 and 6). It is interesting to find that this interaction term plays a considerable role in almost every case. Absolute values of a3are not negligible and are bigger than the audio coefficients in most cases. However, it is not possible from this study to clearly understand the relation of this interaction factor with the individual metrics nor the individual audio and video quality outcomes.
In Fig. 7, the surface fitting of MOSn using parametric regressions of model 1 are shown. Table 7 presents goodness-of-fit parameters provided by the curve fitting tool (R2, Adjusted R2 and Sum of Squared Errors). Based on the results in this Table, it is possible to conclude that ViSQOL Audio and ST-RRED provide the best fit for model 1 (R2= 0.8732, SSE = 0.2962). Taking into account only the results involving POLQA Music, MS-SSIM performs better than other tested video metrics (R2= 0.8565, SSE = 0.3352). Globally, the worst results are obtained with ST-MAD,
POLQA+MS-SSIM 0.9255 0.9245 0.1094 0.0831 0.9285 0.9245 0.1073 0.0668 POLQA+ST-MAD 0.7975 0.7718 0.1742 0.1406 0.8386 0.8265 0.1573 0.1153 POLQA+ST-RRED 0.9235 0.9009 0.1108 0.0203 0.9276 0.8922 0.1079 0.0472 POLQA+VQM 0.8196 0.8073 0.1655 0.1477 0.8283 0.7969 0.1618 0.1559 ViSQOL+PSNR 0.8066 0.7937 0.1707 0.1182 0.8498 0.8041 0.1522 0.1329 ViSQOL+SSIM 0.8530 0.8768 0.1507 0.1017 0.8898 0.8960 0.1318 0.0872 ViSQOL+MS-SSIM 0.9259 0.9234 0.1091 0.0678 0.9319 0.9064 0.1048 0.0407 ViSQOL+ST-MAD 0.8018 0.7625 0.1726 0.1272 0.8291 0.7920 0.1615 0.0926 ViSQOL+ST-RRED 0.9344 0.8982 0.1028 0.0563 0.9381 0.9064 0.1000 0.0423 ViSQOL+VQM 0.8304 0.8188 0.1609 0.0967 0.8685 0.8205 0.1432 0.1029
considering both audio metrics (R2= 0.6360, SSE = 0.8501 with POLQA Music and R2= 0.6428, SSE = 0.8342 with ViSQOL Audio).
Table 8 reports the statistical evaluation metrics for MOS predictions (MOSp) using both fitted audiovisual models (PLCC, SROCC, RMSE and RMSE*). Given the small number of samples, the t-student 95% confidence interval was considered when computing RMSE* [51].
All audiovisual metric combinations yield relatively good Pearson coefficients between MOSn and MOSp (PLCC > 0.8), using model 1. The top performing combinations, according to PLCC and RMSE, are ViSQOL Audio with ST-RRED (PLCC = 0.9344, RMSE = 0.1028), ViSQOL Audio with MS-SSIM (PLCC = 0.9259, RMSE = 0.1091) and POLQA Music with MS-SSIM (PLCC = 0.9255, RMSE = 0.1094). These results are coherent with the goodness-of-fit measures discussed previously. Further analysis of the Spearman correlation coefficients, indicates the same top 2 performing metrics. The third best combination is POLQA Music and ST-RRED.
Fig. 8 presents surface fittings of MOSn using parametric regression of the proposed model, i.e. equation (2). The obtained surfaces fit the data in a less rigid manner than the surfaces obtained with equation (1), suggesting a better approximation of MOSn. As shown in Table 7, R2 are higher and SSE values are lower for every fitted curve and SSE, when compared with the analogous values from model 1, suggesting an improvement with the addition of quadratic terms.
Adjusted R2offers a measure of the explanatory power of adding a term to a given model. Comparing the adjusted R2values of both models in Table 7, the inclusion of the quadratic variables effectively increases the fitting of MOSn data for seven of the total metric combinations. However, the adjusted R2 slightly decays for other combinations.
These combinations include the top performing audiovisual metrics in terms of linear correlation. MOSp statistical evaluation metrics for the proposed model are presented in Table 8. Pearson correlation coefficients are higher in every case and RMSE values for MOSpfrom the proposed model are lower, when compared with the
(a) POLQA Music and PSNR (b) POLQA Music and SSIM (c) POLQA Music and MS-SSIM
(d) POLQA Music and ST-MAD
(e) POLQA Music and ST-RRED
(f) POLQA Music and VQM
(g) ViSQOL Audio and PSNR (h) ViSQOL Audio and SSIM (i) ViSQOL Audio and MS-SSIM
(j) ViSQOL Audio and ST-MAD
(k) ViSQOL Audio and ST-RRED
(l) ViSQOL Audio and VQM
Fig. 7 Surface fits for joint audiovisual metrics, obtained with non-linear regression of equation (1).
same measures for model 1. The results indicate an overall better performance of this extended joint model, in terms of MOS prediction. Although the linear correlation is globally improved by the proposed model, the monotonic correlation coefficients show a different tendency, as SROCC decreases for most combinations using POLQA Music for the proposed model. Combinations with ViSQOL Audio show improved monotonic correlation, with the exception of ViSQOL Audio and MS-SSIM, which nonetheless still yielded a Spearman coefficients slightly above 0.9. However, the four
(a) POLQA Music and PSNR (b) POLQA Music and SSIM (c) POLQA Music and MS-SSIM
(d) POLQA Music and ST-MAD
(e) POLQA Music and ST-RRED
(f) POLQA Music and VQM
(g) ViSQOL Audio and PSNR (h) ViSQOL Audio and SSIM (i) ViSQOL Audio and MS-SSIM
(j) ViSQOL Audio and ST-MAD
(k) ViSQOL Audio and ST-RRED
(l) ViSQOL Audio and VQM
Fig. 8 Surface fits for joint audiovisual metrics, obtained with parametric regression of equation (2), including the quadratic terms.
top performing joint metrics, according to SROCC, are the same as those of model 1, with MS-SSIM (SROCC = 0.9245 with POLQA Music and SROCC = 0.9064 with ViSQOL Audio) and ST-RRED (SROCC = 0.9064 with ViSQOL Audio and 0.8922 with POLQA Music). This again suggests that video quality plays a more important role in this context than audio quality, as shown in the subjective test presented in this
Table 9 Results of statistical significance tests for PLCC, RMSE and RMSE*. Note: “1” indicates that this metric combination is statistically equivalent to the top performing metric combination (denoted by shaded cells). “0” indicates a statistical difference.
Model 1 Proposed Model
PLCC RMSE RMSE* PLCC RMSE RMSE*
POLQA+PSNR 0 0 0 0 0 0 POLQA+SSIM 1 1 0 1 1 0 POLQA+MS-SSIM 1 1 0 1 1 0 POLQA+ST-MAD 0 0 0 1 0 0 POLQA+ST-RRED 1 1 1 1 1 1 POLQA+VQM 1 0 0 1 0 0 ViSQOL+PSNR 0 0 0 1 0 0 ViSQOL+SSIM 1 0 0 1 1 0 ViSQOL+MS-SSIM 1 1 0 1 1 1 ViSQOL+ST-MAD 0 0 0 1 0 0 ViSQOL+ST-RRED 1 1 0 1 1 1 ViSQOL+VQM 1 0 0 1 0 0
research. It should also be noted that the best metric according to SROCC (POLQA Music with MS-SSIM) did not decrease its monotonic correlation.
As differences between the reported correlation measures, RMSE and RMSE* values for all the investigated audio and video metric combinations are small, the corresponding statistical significance tests [51] were performed to specify the significance of those differences. This represents the common Video Quality Experts Group and International Telecommunication Union approach when it comes to a quality prediction/estimation models benchmark. It should be noted here that the SROCC has mostly a non-linear relationship, and therefore the statistical significance test for the correlation coefficients cannot be computed in this case. Table 9 shows that, regarding PLCC, most of the metric combinations are statistically equivalent to the best performing metric combination (ViSQOL Audio with ST-RRED in both audiovisual models). As for RMSE, an efficient discrimination between metric combinations is also not possible, even though a smaller number of performances are statistically equivalent to the best joint metric (ViSQOL Audio with ST-RRED in both audiovisual models).
Taking into consideration these statistical significance tests, RMSE* appears to be the most discriminative performance measure in the case of the both models. As described in [51], RMSE* measures differences taking into account MOS uncertainty. In other words, it measures the scattering of MOSp, as it ignores small differences with respect to an epsilon-wide band defined by t × σ , where t refers to the t-student critical value at 95% confidence and σ to the standard deviation of MOS. Interestingly, RMSE* isolates POLQA Music with ST-RRED as the best performing joint metric for model 1 (RMSE* = 0.0203). Regarding the proposed model, ViSQOL Audio with MS-SSIM yields the best result (RMSE* = 0.0407), with two other combinations presenting statistically equivalent results (ST-RRED combined with both POLQA Music and ViSQOL).
that they were not explicitly designed for taking into account temporal variations of the quality. Furthermore, it is worth reiterating here that the main goal of the developed models was to effectively map the predictions provided by both audio and video quality metrics into a global quality level estimation, which was confirmed by the good correlation coefficients obtained with both audiovisual quality estimation models. However, the accuracy of these models may be further increased, considering audiovisual quality prediction models designed to fully take into account temporal quality variations introduced by HAS. The outcome of the ITU-T SG12 P.NATS standardization effort may contribute vastly to this objective, especially when it comes to video quality prediction models.
5 Conclusion
The objectives of this paper were two-fold. First, considering the purpose and design of the MPEG-DASH protocol, a main goal was to generate valuable insights into possible trade-offs in relative bandwidth allocation. Therefore, the joint effect of audio and video quality was subjectively assessed, using varying aggregate bandwidth in a recorded live music streaming scenario to emulate a mobile network. It should be emphasized that the drawn conclusions are limited to this case study. In particular, we studied only live concert streaming in the context of mobile devices and networks. As it is well known, typically, mobile devices are not capable of reproducing high quality audio, despite being commonly used by the general public for audio reproduction. For this reason, audio quality can be reduced without a strong impact on the perceived audiovisual quality. If other systems different from mobile ones are used, these conclusions may not be valid, particularly, if higher bandwidth is available.
Typical MPEG-DASH encoding variations were used in the sequences, which were divided in 10 second chunks. Network congestion was emulated for 1-3 consecutive chunks, reducing the bit rate of video, audio or both media respectively. The scores obtained from the subjective test have allowed us to draw the following important conclusions. The reduction of audio content bit rate for a small number of chunks does not affect significantly the global/audiovisual quality perceived by the end user. On the other hand, video bit rate reduction has a greater impact on global/audiovisual quality perceived by the end user. Hence, it is possible to conclude that reducing audio quality to the lowest tested quality allows avoiding video quality reduction without a significant loss on the audiovisual quality perceived by the end user. That would not be the case if the video quality was by a similar bit rate amount, causing a significant perceived quality loss. As a trade-off example, it is preferable to reduce the bit rate of the audio content from 128 to 24 kbps even for two chunks
than the bit rate of video content from 256 to 128 kbps for just one chunk. Also, the direct comparison of similar aggregate bandwidth cases indicates that reducing audio bit rate to 24 kbps, with simultaneous video bit rate reduction to an intermediate level (256 kbps), yields a better perceived audiovisual quality than the case involving only video bit rate reduction to 128 kbps.
Based on the results provided by a number of audio and video objective quality metrics, the second main goal of the paper was to derive an effective joint model for estimating audiovisual quality perceived by the end user, in the context of live music streaming over mobile network. A parametric model was proposed, which incorporates quadratic terms of the separate audio and video quality metrics, to extend a commonly used model for the joint audiovisual quality [31].
The obtained performance measures suggest that the proposed approach is valid as a joint audiovisual quality estimation model in the context of recorded live music streaming over mobile network. All tested metric combinations achieved Pearson correlation coefficients above 0.8 and the proposed model globally improved the results of the previous approach. Considering all the discussed performance measures, top performing metric combinations include ST-RRED and MS-SSIM, whether with POLQA Music or ViSQOL Audio.
The conclusions arising from the results presented in this paper may be valuable for the development of new bandwidth adaptation strategies for adaptive streaming over HTTP, which in turn is important for the rapidly growing commercial case of network service providers. However, a similar study with other types of content and devices should be considered in future work, in order to fully assess the applicability of these results to a general case. Unfortunately, to the best of our knowledge, there is no such database publicly available.
Based on the reported results, it also seems to be worth investigating the performance of higher order polynomials, when it comes to the proposed audiovisual quality assessment approach. Furthermore, the reported quality evaluation methodologies might be applied as a basis in the context of omnidirectional audio and video, by varying the quality of the different audio signals and also the quality of different tiles of the omnidirectional video considering the focus of the viewer, in order to keep a reasonable bandwidth consumption.
Acknowledgements The authors would like to acknowledge QuiVVer - ”Centro de competˆencia em Qualidade, Validac¸˜ao e Verificac¸˜ao de software” (CENTRO-07-CT62-FEDER-005009) for providing the equipment used in the subjective tests. Furthermore, we acknowledge the E.U. Action COST IC 1003 -Qualinet for enabling the cooperation between the three research institutions involved in this project.
References
1. Sodagar I (2011) The MPEG-DASH Standard for Multimedia Streaming over the Internet. IEEE Multimedia 18(4):62–67
2. Thang TC, Ho QD, Kang JW, Pham AT (2012) Adaptive Streaming of Audiovisual Content using MPEG DASH. IEEE Transactions on Consumer Electronics 58(1):78–85
5. Mok RK, Chan EW, Chang RK (2011) Measuring the Quality of Experience of HTTP Video Streaming. In: 2011 IFIP/IEEE International Symposium on Integrated Network Management, IEEE, pp 485–492
6. Tran HT, Ngoc NP, Pham AT, Thang TC (2016) A Multi-factor QoE Model for Adaptive Streaming over Mobile Networks. In: 2016 IEEE Globecom Workshops, IEEE, pp 1–6
7. Rodrigues R, Pocta P, Melvin H, Pereira M, Pinheiro AM (2016) MPEG DASH – Some QoE-based Insights into the Tradeoff between Audio and Video for Live Music Concert Streaming under Congested Network Conditions. In: 8th International Conference on Quality of Multimedia Experience (QoMEX), IEEE, pp 1–6
8. ITU-T Recommendation P.910 (2008) Subjective Video Quality Assessment Methods for Multimedia Applications. ITU Telecommunication Std Sector 9. ITU-R Recommendation BT.500-13 (2012) Methodology for the Subjective
Assessment of the Quality of Television Pictures. ITU Radiocommunication Std Sector
10. ITU-R Recommendation BS.1116-3 (2015) Methods for the Subjective Assessment of Small Impairments in Audio Systems. ITU Radiocommunication Std Sector
11. ITU-R Recommendation BS.1534-3 (2015) Method for the Subjective Assess-ment of Intermediate Quality Levels of Coding Systems. ITU Radiocommunica-tion Std Sector
12. ITU-T Recommendation P.911 (1998) Subjective Audiovisual Quality Assess-ment Methods for Multimedia Applications. ITU Telecommunication Std Sector 13. ITU-T Recommendation P.913 (2016) Methods for the Subjective Assessment of Video Quality, Audio Quality and Audiovisual Quality of Internet Video and Distribution Quality Television in Any Environment. ITU Telecommunication Std Sector
14. ITU-R Recommendation BS.1387 (2001) Method for Objective Measurements of Perceived Audio Quality. ITU Radiocommunication Std Sector
15. ITU-T Recommendation P.863 (2014) Perceptual Objective Listening Quality Assessment. ITU Telecommunication Std Sector
16. Pocta P, Beerends JG (2015) Subjective and Objective Assessment of Perceived Audio Quality of Current Digital Audio Broadcasting Systems and Web-Casting Applications. IEEE Transactions on Broadcasting 61(3):407–415
17. Hines A, Gillen E, Kelly D, Skoglund J, Kokaram A, Harte N (2015) ViSQOLAudio: An Objective Audio Quality Metric for Low Bitrate Codecs. The Journal of the Acoustical Society of America 137(6):449–455
18. ITU-T Recommendation J.247 (2008) Objective Perceptual Multimedia Video Quality Measurement in the Presence of a Full Reference. ITU
Telecommunica-tion Std Sector
19. Pinson MH, Wolf S (2004) A New Standardized Method for Objectively Measuring Video Quality. IEEE Transactions on Broadcasting 50(3):312–322 20. Vu PV, Vu CT, Chandler DM (2011) A Spatiotemporal
Most-Apparent-Distortion Model for Video Quality Assessment. In: 18th IEEE International Conference on Image Processing (ICIP), IEEE, pp 2505–2508
21. Seshadrinathan K, Bovik AC (2009) Motion-based Perceptual Quality Assess-ment of Video. In: Proceedings of SPIE - Human Vision and Electronic Imaging XIV, International Society for Optics and Photonics, SPIE, vol 7240, pp 283 – 294
22. Soundararajan R, Bovik AC (2013) Video Quality Assessment by Reduced Reference Spatio-Temporal Entropic Differencing. IEEE Transactions on Circuits and Systems for Video Technology 23(4):684–694
23. Manasa K, Channappayya SS (2016) An Optical Flow-based Full Reference Video Quality Assessment Algorithm. IEEE Transactions on Image Processing 25(6):2480–2492
24. Wang Z, Simoncelli EP, Bovik AC (2003) Multiscale Structural Similarity for Image Quality Assessment. In: 37th IEEE Asilomar Conference on Signals, Systems and Computers, IEEE, vol 2, pp 1398–1402
25. Barman N, Martini MG (2019) QoE Modeling for HTTP Adaptive Video Streaming - a Survey and Open Challenges. IEEE Access 7:30831–30859 26. Tran HT, Ngoc NP, Hoßfeld T, Thang TC (2018) A Cumulative Quality Model
for HTTP Adaptive Streaming. In: 10th International Conference on Quality of Multimedia Experience (QoMEX), IEEE, pp 1–6
27. Duanmu Z, Ma K, Wang Z (2018) Quality-of-Experience for Adaptive Streaming Videos: An Expectation Confirmation Theory Motivated Approach. IEEE Transactions on Image Processing 27(12):6135–6146
28. Tran HT, Nguyen DV, Nguyen DD, Ngoc NP, Thang TC (2019) An LSTM-based Approach for Overall Quality Prediction in HTTP Adaptive Streaming. In: IEEE Conference on Computer Communications Workshops (INFOCOM WKSHPS), IEEE, pp 702–707
29. Beerends JG, De Caluwe FE (1999) The Influence of Video Quality on Perceived Audio Quality and Vice Versa. Journal of the Audio Engineering Society 47(5):355–362
30. Pinson M, Ingram W, Webster A (2011) Audiovisual Quality Components. IEEE Signal Processing Magazine 6(28):60–67
31. You J, Reiter U, Hannuksela MM, Gabbouj M, Perkis A (2010) Perceptual-based Quality Assessment for Audiovisual Services: A Survey. Signal Processing: Image Communication 25(7):482–501
32. Hands DS (2004) A Basic Multimedia Quality Model. IEEE Transactions on Multimedia 6(6):806–816
33. ITU-T Recommendation P.1203 (2017) Parametric Bitstream-based Quality Assessment of Progressive Download and Adaptive Audiovisual Streaming Services over Reliable Transport. ITU Telecommunication Std Sector
34. ITU-T Recommendation P.1203.1 (2019) Parametric Bitstream-based Quality Assessment of Progressive Download and Adaptive Audiovisual Streaming
36. ITU-T Recommendation P.1203.3 (2017) Parametric Bitstream-based Quality Assessment of Progressive Download and Adaptive Audiovisual Streaming Ser-vices over Reliable Transport - Quality Integration Module. ITU Telecommuni-cation Std Sector
37. Yamagishi K, Hayashi T (2017) Parametric Quality-Estimation Model for Adaptive-Bitrate-Streaming Services. IEEE Transactions on Multimedia 19(7):1545–1557
38. Martinez HAB, Farias MC (2018) Combining Audio and Video Metrics to Assess Audio-visual Quality. Multimedia Tools and Applications 77(18):23993– 24012
39. Garcia MN, De Simone F, Tavakoli S, Staelens N, Egger S, Brunnstrom K, Raake A (2014) Quality of Experience and HTTP Adaptive Streaming: A Review of Subjective Studies. In: 6th International Workshop on Quality of Multimedia Experience (QoMEX), IEEE, pp 141–146
40. Hoßfeld T, Schatz R, Biersack E, Plissonneau L (2013) Internet Video Delivery in YouTube: From Traffic Measurements to Quality of Experience. In: Data Traffic Monitoring and Analysis, Springer, pp 264–301
41. De Vriendt J, De Vleeschauwer D, Robinson D (2013) Model for Estimating QoE of Video Delivered using HTTP Adaptive Streaming. In: 2013 IFIP/IEEE International Symposium on Integrated Network Management (IM 2013), IEEE, pp 1288–1293
42. Tavakoli S, Brunnstrøm K, Wang K, Andr´en B, Shahid M, Garcia N (2014) Subjective Quality Assessment of an Adaptive Video Streaming Model. In: Proceedings of SPIE - Image Quality and System Performance XI, International Society for Optics and Photonics, SPIE, vol 9016, pp 197 – 208
43. Irondi I, Wang Q, Grecos C, Calero JMA, Casaseca-De-La-Higuera P (2019) Efficient QoE-aware Scheme for Video Quality Switching Operations in Dynamic Adaptive Streaming. ACM Transactions on Multimedia Computing, Communications, and Applications 15(1):1–23
44. Takahashi S, Yamagishi K, Lebreton P, Okamoto J (2019) Impact of Quality Factors on Users’ Viewing Behaviors in Adaptive Bitrate Streaming Services. In: 11th International Conference on Quality of Multimedia Experience (QoMEX), IEEE, pp 1–6
45. Tavakoli S, Brunnstrøm K, Guti´errez J, Garc´ıa N (2015) Quality of Experience of Adaptive Video Streaming: Investigation in Service Parameters and Subjective Quality Assessment Methodology. Signal Processing: Image Communication 39:432–443
46. Wilk S, Sch¨onherr S, Stohr D, Effelsberg W (2015) EnvDASH: An Environment-Aware Dynamic Adaptive Streaming over HTTP System. In: Proceedings of the ACM International Conference on Interactive Experiences for TV and Online
Video, ACM, pp 113–118
47. Bossen F (2013) Common Test Conditions and Software Reference Configu-rations (JCTVC-K1100). In: 11th Meeting: Joint Collaborative Team on Video Coding (JCT-VC) of ITU-T SG16
48. Herre J, Dietz M (2008) MPEG-4 High-efficiency AAC Coding [Standards in a Nutshell]. IEEE Signal Processing Magazine 25(3):137–142
49. Wiegand T, Sullivan GJ, Bj¨ontegaard G, Luthra A (2003) Overview of the H.264/AVC Video Coding Standard. IEEE Transactions on Circuits and Systems for Video Technology 13(7):560–576
50. Wang Z, Bovik AC, Sheikh HR, Simoncelli EP (2004) Image Quality Assessment: from Error Visibility to Structural Similarity. IEEE Transactions on Image Processing 13(4):600–612
51. ITU-R Recommendation P.1401 (2012) Methods, Metrics and Procedures for Statistical Evaluation, Qualification and Comparison of Objective Quality Prediction Models. ITU Telecommunication Std Sector
52. Massey Jr. FJ (1951) The Kolmogorov-Smirnov Test for Goodness of Fit. Journal of the American Statistical Association 46(253):68–78