www.ccarevista.ufc.br ISSN 1806-6690
Use of walking tractor powered rotary tiller in no-tillage system
1Uso de sulcadores rotativos acionados por trator de rabiças em semeadura direta
Fabricio Ardais Medeiros2*, Ângelo Viera dos Reis3, Antonio Lilles Tavares Machado3, Roberto Lilles Tavares
Machado3 e Giusepe Stefanello4
ABSTRACT - Brazilian family farming has at its disposal planters whose furrowing mechanisms, whether disc or shank, require a large vertical force. In smaller planters, this is reflected in low efficiency when opening the furrow or in a high demand for mass (weight). Rotary furrowers require less vertical force for the same operation. This study aimed to evaluate the technical feasibility and performance of rotary furrowers mounted on the powertrain of a walking tractor working under direct seeding, and compare them with shank-type furrowers using bibliographic data. The parameters used in the comparison were the depth and width of the furrow, the area of disturbed soil and the cross-sectional area of the furrow with no soil after the operation. The experiment was carried out on wheat stubble that had lain fallow for six months. Twelve treatments were employed in a factorial design: three models of rotary furrowers, two values for revolutions per unit of linear displacement, and two forward speeds. The variable, cross-sectional area of the furrow with no soil, was statistically affected only by the factor, furrower. However there was significant interaction between the factors, furrower, revolutions per metre and speed, for the variables of depth, furrow width and area of disturbed soil. The values obtained for the variables of width, depth and disturbed area in the cross-section of the furrows, with the three types of rotary furrowers driven by the powertrain of a walking tractor, were similar to those generated by shank-type furrowers.
Key words: Seed furrow. Sowing depth. No-tillage system.
RESUMO -A Agricultura Familiar brasileira tem à sua disposição semeadoras cujos mecanismos sulcadores, tipo haste ou disco, demandam grande esforço vertical. Nas semeadoras de menor porte isso se reflete em baixa eficiência na abertura do sulco de semeadura ou alta exigência de massa (peso). Os sulcadores rotativos exigem menor esforço vertical na mesma operação. Neste estudo objetivou-se avaliar a viabilidade técnica e o desempenho de sulcadores rotativos, montados na cadeia cinemática de um trator de rabiças, trabalhando em semeadura direta e compará-los com sulcadores tipo haste por meio de dados bibliográficos. Os parâmetros empregados na comparação foram profundidade e largura do sulco, área de solo mobilizado e área transversal do sulco sem solo, após a operação. O experimento foi conduzido sobre resteva de trigo em pousio por seis meses. Foram empregados 12 tratamentos, sendo três modelos de sulcadores rotativos, dois valores de revoluções do sulcador por unidade linear de deslocamento e duas velocidades de deslocamento em delineamento fatorial. A variável área transversal do sulco sem solo foi estatisticamente afetada apenas pelo fator sulcador. No entanto, houve interação significativa entre os fatores sulcador, revoluções por metro e velocidade para as variáveis: profundidade, largura do sulco e área de solo mobilizada. Os valores obtidos para as variáveis largura, profundidade e área mobilizada na seção transversal dos sulcos com os três tipos de sulcadores rotativos acionados pela cadeia cinemática do trator de rabiças foram análogos aos gerados com sulcadores tipo haste.
Palavras-chave:Sulco de semeadura. Profundidade de semeadura. Sistema de plantio direto.
*Autor para correspondência
1Recebido para publicação em 17/02/2013; aprovado em 30/10/2014
Parte da Tese de Doutorado do primeiro autor apresentada ao Programa de Pós-Graduação em Sistema de Produção Agrícola Familiar, Universidade Federal de Pelotas
2Núcleo de Inovação em Máquinas e Equipamentos Agrícolas/NIMEq, Faculdade de Agronomia Eliseu Maciel/FAEM, Universidade Federal
de Pelotas, Campus Universitário, Caixa Postal 354, Pelotas-RS, Brasil, [email protected]
Rev. Ciênc. Agron., v. 46, n. 1, p. 54-63, jan-mar, 2015 55
INTRODUCTION
Family farming occupies mainly small land units and makes up the majority of the total number of rural establishments in the country. Its greatest challenge is in adapting and organizing its system of production using technologies which are available in the market. This segment has shown great interest and the ever-increasing adoption of systems of conservation, as is the case with no-tillage (NT) or direct seeding (DSS).
Denardin, Faganello and Santi (2008) historically
conceptualise DSS, since 1980, as being a complex of
technological processes aimed at agricultural exploitation, considering: turning soil only in the row or seed hole, permanent maintenance of the ground cover, and the diversification of species via crop rotation. In DSS more
water is available to plants near the surface and with less
retention energy (DALMAGOet al., 2009).
Family farming can benefit from the advantages of DSS, associating the technique to the use of small machinery. However, the supply of suitable machinery to its needs is poor, particularly in relation to agricultural implements for low-powered tractors. As a result, there are limitations on the adoption and use of DSS by these farmers. There is therefore a need and an opportunity for the improvement of such equipment (RICHTER; CAMPOS; BENASSI, 2002; ROMEIRO FILHO, 2012; TEIXEIRA, 2008).
In seeding machines, the furrowing assembly is one of the most important mechanisms for the success of direct seeding, performing the functions of straw cutting, soil decompaction and furrowing along the seed row
(MACHADOet al., 2005). According to Siqueira (2010),
when operating under DSS, these mechanisms present problems and operational limitations which, due to the types of furrower used (disc, shank or combination), require a large vertical force to operate at appropriate depths. For Mion and Benez (2008), the vertical load influences the working depth of the furrow-opening mechanisms, and consequently the area of turned soil, resulting in insufficient soil depths or high weight demands, and consequently greater power requirements and lifting capacity of the three point coupling system of the tractor.
For Chang (2004), rotary furrowing tools require less vertical force than do shanks, discs or a combination of the two, to operate at suitable depths. Therefore a device with a rotary furrowing tool requires less weight compared to the furrow-opening systems of direct seeding machines currently available. The author reports that over 90% of the total energy used in these models comes from the power take-off, whose energy use efficiency is greater than 90%, as opposed to traction implement systems, where traction force alone operates
with an efficiency of around 50%. Reiset al. (2002) however
found that the use of a planter with rotary furrowers increases slippage of the tractor drive wheels and fuel consumption.
Little information is found in the literature on rotary furrowers, confirming the need for new studies into developing suitable machines for sowing operations with this type of mechanism. In walking tractors the powertrain for the rotary hoes makes it possible, by adjusting and adapting rotary furrowers, to design a tractor-seeding system with rotary furrowing mechanisms.
This work aimed to evaluate the technical feasibility of using for direct seeding three models of rotary furrower driven by walking tractor, comparing performance data with the performance data of shank furrowers found in other studies.
MATERIAL AND METHODS
The experiment was carried out in an area located at 31°48’04” S and 52°30’05” W, at an altitude of 39 m, lying fallow for six months after the wheat harvest, and having been used in the previous five years under a DSS of soybean, oats and wheat. The soil in the area is classified as a typic eutrophic Yellow Argisol (EMPRESA BRASILEIRA DE PESQUISA AGROPECUÁRIA, 1999).
The experimental design was of four blocks of randomised plots with four replications (one in each block and one sample per replication), in a 3 x 2 x 2 factorial scheme. There were twelve treatments consisting of three types of rotary furrower (varying in dimension, geometry and number of blades), two values for revolutions of the
furrower per unit of linear displacement (rev m-1) and
two forward speeds (km h-1), as shown in Table 1. The
sample data was tested for normality by the Lilliefors and Shapiro-Wilk tests, and when these did not present a normal distribution, their square roots were used. When variance analysis showed a significant difference between the treatment averages, the Tukey test at a significance level of 5% was applied for means comparison.
The texture and water content of the soil were
determined using the methods described by Trögeret al.
Table 1 - Treatments with the levels for each factor and respective values for furrower rotation
Treatment Furrower Number of revolutions per unitof linear displacement (rev m-1) Speed (km h-1) Furrower Rotation (rpm)
1 R 5.8 2.77 263
2 R 5.8 3.88 379
3 R 7.9 2.77 360
4 R 7.9 3.88 514
5 S 5.8 2.77 263
6 S 5.8 3.88 379
7 S 7.9 2.77 360
8 S 7.9 3.88 514
9 X 5.8 2.77 263
10 X 5.8 3.88 379
11 X 7.9 2.77 360
12 X 7.9 3.88 514
the five measurements at the range of depths described above, the cone index (CI) was calculated. The CI for each lot being considered as the average of these five values.
To determine the dry mass of vegetation cover,
the method used by Trögeret al. (2012) was employed,
which uses a 0.5 x 0.5 m wooden frame in a total of four samples per treatment. Vegetation, limited to that inside the framework, was completely removed with the aid of grass shears, and wrapped in paper bags for later determination of the dry mass of the collected material.
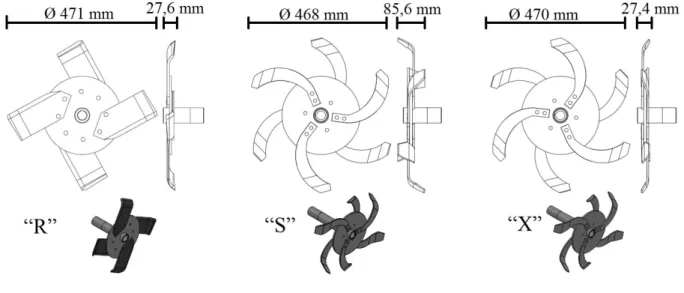
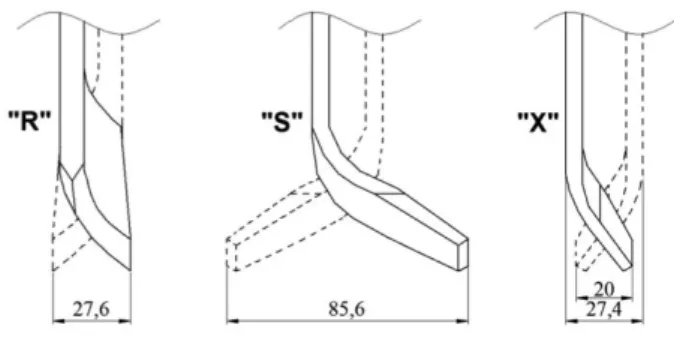
Figure 1 - Diameter and width in mm, view and perspective of the three rotary furrowers being studied: model “R” (left), “S” model (centre) and Model “X” (right)
Rev. Ciênc. Agron., v. 46, n. 1, p. 54-63, jan-mar, 2015 57
The two values used for the number of revolutions per unit of linear displacement were obtained from the drive gear ratios of the rotary hoe (Fast and Slow), which
yielded values of 5.8 and 7.9 rev m-1 respectively. The
forward speeds used were 2.77 and 3.88 km h-1, obtained
respectively by the combination of pulleys at the Normal
setting (reduced) in 2nd gear, and pulleys at the Production
setting (amplified) in 2nd gear.
Because of limitations in the drive ratio combinations of the machine, the rotation of the furrower was not used as a treatment factor, due to its combination not being possible with all levels of the remaining factors in the factorial design. This means that once the level of the factor “number of furrower revolutions per unit of linear displacement” and the level of the factor “forward speed” are established, the value for rotation of the furrower, which is a function of the combination of levels for these factors, cannot be changed.
To put it another way, at a forward speed of 2.77 km h-1
the two possible rotations for the rotary furrower are 263
and 360 rpm, and at a speed of 3.88 km h-1, they are 379
and 514 rpm, preventing a factorial design. As seen above, the drive ratios result in four values for furrower rotation (Table 1), which in this work are secondary variables and not used as factors of variation.
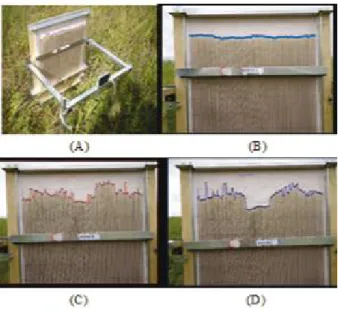
To determine the profile of the soil and furrows, a profilometer was employed, placed on two stakes fixed laterally to the furrows (Figure 2A). The profilometer used was 390 mm wide, equipped with rods spaced 4.0 mm apart and a track (vertical displacement) of 450 mm. Prior to a
Figure 2 - (a) Profilometer used, (b) original soil profile, (c) soil profile after a pass of the furrower (d) soil profile after the removal of the disturbed soil
pass of the machine in each plot, the natural profile of the soil surface was evaluated. After a pass of the furrower, the resulting conformation was evaluated; the profile of the furrow was determined after manual removal of the disturbed soil, for later calculation of the disturbed area, of the area with no soil in the cross section of the furrow (area of the furrow without the presence of soil below the original soil profile), and of the depth and width of the furrow. For each determination a picture was taken using a Sony Cyber-Shot digital camera with a 14.1 Mpixel resolution. For analysis of the profiles of soil and furrows, CAD software was used to measure the areas and linear dimensions based on the digital images (Figure 2).
RESULTS AND DISCUSSION
In relation to texture, the soil was characterised
as sandy loam: sand (63.19 kg kg-1), silt (20.78 kg kg-1)
and clay (16.06 kg kg-1). The predominant ground cover
in the area was composed of 45% Jamaica crabgrass (Digitaria horizontalis), 23.75% Plantain Signal Grass
(Brachiaria plantaginea), 20% Arrowleaf Sida (Sida rhombifolia L.), 3.75%Ipomoea ramosissima and 7.5%
other species, including wheat straw. Soil density in the
surface layer was 1.9 g cm-3 with a gravimetric moisture
content of 0.13 kg kg-1 (for the 0.0 to 120 mm layer).
Data relating to the physical characteristics of the soil, water content and the vegetation cover in the experimental area, with their relative statistical analyses, are shown in Table 2.
During operation of the of the model “R” furrower,
plants, especiallyIpomoearamosíssima, became entwined
around the axis (Figure 3). This can be explained by the angle of attack of the blades, which directs material towards the axis. The problem did not occur with the “S” and “X” models, where the angle is reversed.
In Figure 4 is shown an example (treatment 7, replication 2, furrower “X”, at the higher speed and smaller number of revolutions per metre) of the superimposed shape of lines generated by the ends of the profilometer rods, photographed at different stages before and after a pass of the furrower, and cross-sectional area of the furrows.
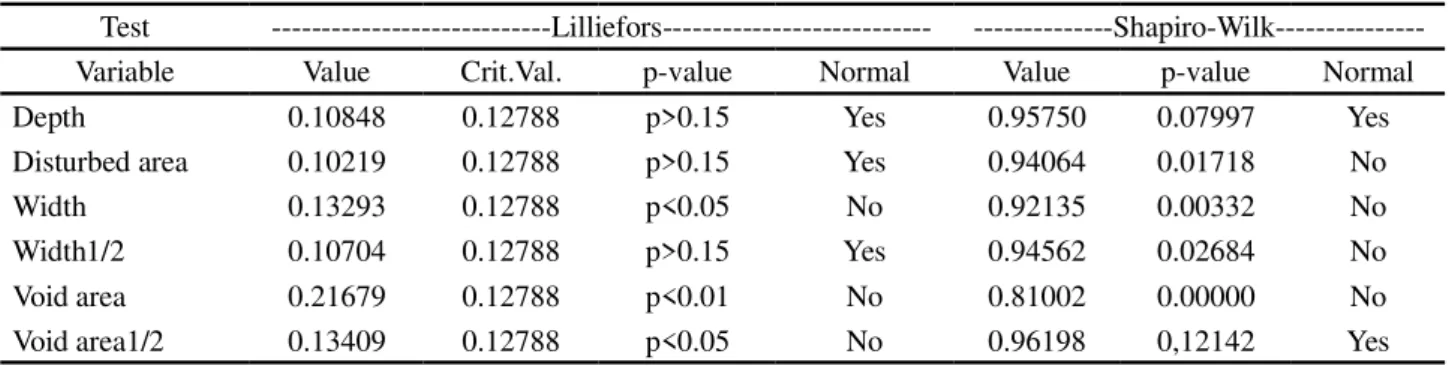
Table 3 shows the normal distribution of the data for depth (Lilliefors and Shapiro-Wilk), and for disturbed area (Lilliefors). Data for the width and void area were transformed by obtaining their square roots due to not presenting a normal distribution. They were then re-evaluated as to distribution, being considered normal by the Lilliefors test (width) and the Shapiro-Wilk test (void area).
Table 2 - Physical properties, water content and dry weight of the vegetation cover in the soil layer of the experimental area
Texture (kg.kg-1) Cone index (kPa) Water content (kg kg-1) Vegetation cover dry
Sand Silt Clay 0-60 mm 60-120 mm 0-120 mm weight (kg ha-1)
Mean 63.19 20.78 16.03 140.04 1058.05 0.13 6725.00
SD 3.54 2.23 4.26 117.55 349.82 0.01 1653.80
CV 5.60 10.74 26.60 83.94 33.06 5.07 24.59
Figure 3 - Plants entwined around the axis of the furrower (left) and blade trajectories of the “R” model with four blades (centre) and of the “S” and “X” models with six blades (right) at 7.9 rev.m-1, and respective angle of attack of the blades
Figure 4 - Lines generated from superimposed profilometer images (A), with a key to the areas and dimensions of the furrow (B)
difference for all variables, and in some cases the interaction between two factors was significant. There was no interaction between the three factors for any of the response variables.
For the variable, furrow depth, there was an interaction both between the factors, type of furrower and number of revolutions per metre, and between the number of revolutions per metre and forward speed. At the larger number of revolutions per metre, the use of the “R” and “S”
model furrowers resulted in the highest average depths, the opposite being seen for the model “X” furrower (Table 5). At the lower number of revolutions per linear metre, use of the “S” model furrower caused a reduction in furrow depth. This result suggests that the greater nominal width of this furrower, and the consequently larger disturbed area, requires a minimum number of revolutions per metre of linear displacement to reach the same depth as narrower furrowers.
The lower number of revolutions per linear metre associated with the lower forward speed caused a reduction in furrow depth (Table 5). This result can be explained by the fact of the association (the result of combinations of gear ratios) providing less rotation to the axis of the furrower, around 263 rpm. For the other combinations, the rotations varied from 360-514 rpm, as seen above (Table 1).
Rev. Ciênc. Agron., v. 46, n. 1, p. 54-63, jan-mar, 2015 59
Test ---Lilliefors---
---Shapiro-Wilk---Variable Value Crit.Val. p-value Normal Value p-value Normal
Depth 0.10848 0.12788 p>0.15 Yes 0.95750 0.07997 Yes
Disturbed area 0.10219 0.12788 p>0.15 Yes 0.94064 0.01718 No
Width 0.13293 0.12788 p<0.05 No 0.92135 0.00332 No
Width1/2 0.10704 0.12788 p>0.15 Yes 0.94562 0.02684 No
Void area 0.21679 0.12788 p<0.01 No 0.81002 0.00000 No
Void area1/2 0.13409 0.12788 p<0.05 No 0.96198 0,12142 Yes
Table 3 - Normality tests of data from the original variables and after square root transformation
Factor of variation Furrow depth (mm)
DF SS MS F p
Type of furrower 2 1,472.04 736.02 5.65 ** 0.0078
Revolutions per metre covered 1 2,596.02 2,596.02 19.93 ** <0.001
Forward speed 1 623.52 623.52 4.79 * <0.001
Furrower x Revolutions/m 2 4,465.29 2,232.65 17.14 ** 0.0359
Furrower x Speed 2 130.04 65.02 0.50ns >0.050
Revolutions/m x Speed 1 1,131.02 1,131.02 8.68 ** 0.0059
Furrower x Revolutions/m x Speed 2 35.79 17.90 0.14ns >0.050
Treatments 11 10,453.73 950.34 7.30 ** <0.001
Blocks 3 484.90 161.63 1.24ns 0.3106
Residual 33 15,236.98 130.25 -
-Factor of variation Disturbed area in the cross section of the furrow (mm2)
DF SS MS F p
Type of furrower 2 84,861,791.29 42,430,895.65 40.08 ** <0.001
Revolutions per metre covered 1 10,152,200.52 10,152,200.52 9.59 ** 0.0040
Forward speed 1 4,582,470.02 4,582,470.02 4.33 * 0.0223
Furrower x Revolutions/m 2 9,054,108.79 4,527,054.40 4.28 * 0.0453
Furrower x Speed 2 3,752,204.54 1,876,102.27 1.77ns 0.1857
Revolutions/m x Speed 1 2,493,864.19 2,493,864.19 2.36ns 0.1342
Furrower x Rev./m x Speed 2 1,152,410.38 576,205.19 0.54ns >0.050
Treatments 11 116,049,049.73 10,549,913.61 9.97 ** <0.001
Blocks 3 1,837,854.40 612,618.13 0.58ns >0.050
Residual 33 34,932,034.85 1,058,546.51 -
-Factor of variation Square root of the width of the furrow (mm)
DF SS MS F p
Type of furrower 2 51.86 25.93 70.03 ** <0.001
Revolutions per metre covered 1 0.00 0.00 0.00ns >0.050
Forward speed 1 0.74 0.74 2.01ns 0.0637
Furrower x Revolutions/m 2 2.21 1.11 3.00ns 0.166
Furrower x Speed 2 1.11 0.55 1.50ns 0.2385
** significant at 1% (p<0.01). * significant at 5% (0.01 p < 0.05). ns not significant (p 0.05)
Revolutions/m x Speed 1 0.00 0.00 0.00 ns >0.050
Furrower x Rev./m x Speed 2 1.27 0.63 1.71 ns 0.1961
Treatments 11 57.20 5.20 14.04** <0.001
Blocks 3 5.46 1.82 4.91 * 0.0062
Residual 33 12.22 0.37 -
-Factor of variation Square root of the void area in the furrow (mm2)
DF SS MS F p
Type of furrower 2 1593.09 796.55 3.39 * 0.0457
Revolutions per metre covered 1 385.79 385.79 1.64ns 0.2087
Forward speed 1 438.99 438.99 1.87ns 0.0759
Furrower x Revolutions/m 2 1310.38 655.19 2.79ns 0.1806
Furrower x Speed 2 1024.05 512.02 2.18ns 0.1290
Revolutions/m x Speed 1 226.29 226.29 0.96ns >0.050
Furrower x Rev./m x Speed 2 460.18 230.09 0.98ns >0.050
Treatments 11 5438.76 494.43 2.11 * 0.0486
Blocks 3 520.02 173.34 0.74ns >0.050
Residual 33 7749.42 234.83 -
-Continued Table 4
Means with the same lowercase letters in a column and uppercase letters on a line do not differ at 5% by Tukey test
Table 5 - Mean furrow depths (mm) for the factors, type of furrower and forward speed, combined with the factor, number of revolutions per metre of linear displacement
Revolutions per metre Type of furrower Speed (kmh
-1)
R S X 2.77 3.88
5.8 80.1 bA 64.5 bB 85.3 aA 68.2 bB 85.1 aA
7.9 103.4 aA 97.4 aA 73.3 bB 92.6 aA 90.1 aA
furrower, where the depth of the groove decreases with the greater number of revolutions per metre.
According to Siqueira (2010), furrowers are designed to operate at shallow depths (less than 150 mm). In the present study, with the rotary furrowers set to work at a depth of 120 mm, the furrows made by the three models varied from 49 to 118 mm in depth. The intended depth
(120 mm) was not reached; similar to work by Cepiket al.
(2010), which evaluated the furrows made by a shank at nominal depths of 60 and 120 mm with a cutting disc, in
soil with water content between 0.14 and 0.17 kg kg-1, and
at an average speed of 4.5 km h-1. At a nominal depth of 120
mm, as the depth reached values between 115 and 113 mm, Tröger (2012), evaluating the furrows made by shanks with six different tips set to work at a depth of 120 mm using a cutting disc, obtained average values ranging from 112
to 125 mm. Silveiraet al. (2011), in a test with a shank-type
furrower set to work at 100 mm, found data for average depth
ranging from 111 mm (3.5 km h-1) to 93 mm (7.0 km h-1). The
Rev. Ciênc. Agron., v. 46, n. 1, p. 54-63, jan-mar, 2015 61
Table 6 - Averages for furrow width and area with no soil in the cross section of the furrow, and respective mean square roots, by type of rotary furrower
Means with the same lowercase letters in a column do not differ at 5% significance by Tukey* or Scott-Knott** test
Furrower Furrow width (mm) Furrow width1/2 Area of no soil (mm2) Area of no soil1/2 Nominal width of furrower (mm)
R 61.63 7.82 b* 530.06 (18.02 b**) 27.60
S 91.94 9.55 a* 1,393.06 (31.06 a**) 85.60
X 50.25 7.07 c* 977.63 (29.23 a**) 27.40
For the square root of the variable, furrow width, there was no interaction between factors. Only the factor, type of furrower, showed a significant effect, which can be explained by the difference between the nominal widths for each furrower (Figure 5 and Table 6). According to Silva (2009) and Siqueira (2010), the most appropriate furrowers would be the models “R” and “X”, of reduced thickness and therefore, considering the width only, more suited to direct seeding.
There was also a difference between blocks for average furrow width, with the lowest average widths occurring in blocks 1 (59.0 mm) and 2 (68.8 mm), and the highest average values in blocks 2 (68.8 mm), 3 (71.8 mm) and 4 (72.2 mm). The greatest value for furrow width was found in the block with the highest cone index. The furrow width was greater in blocks where the mass of vegetation cover was greater.
According to Cepik et al. (2010), with furrowing
shanks a larger amount of residue resulted in a greater amount of disturbed soil, which indirectly means a greater furrow width. The mass of vegetation cover in the plots showed a similar effect on furrow width as obtained when using rotary furrowers.
For the square root of the variable, area of no soil in the cross section of the furrow, there was no interaction between any of the variation factors. Of the factors under evaluation, only the type of furrower caused statistically significant changes in this variable, which had an average
value of 967 mm2. However, the Tukey test showed no
significant difference for the three types of rotary furrower. This is due to an inconsistency in the joint application of the F and Tukey tests, which rarely occurs. When the value for F is very close to significance, but does not quite reach it, the Tukey test may demonstrate a significant difference between the highest and lowest average, with the opposite possibly occurring. In this case, F was significant for a difference of only one-tenth, and the largest and smallest averages did not differ by approximately two tenths. To get round this problem, the Scott-Knott test was used, which is more sensitive to differences between means. The result of this comparison is presented in Table 6, where the difference is shown for only one of the more narrow furrowers
Figure 5 - Profile and nominal width in mm of the model “R” (left), model “S” (centre) and model “X” (right) rotary furrowers
(R) with the lowest average area of no soil (square root) and the other averages being statistically equal.
The average values for disturbed area in this study
varied from 2,694.5 to 6,945.1 mm2 (Table 7), being lower
than the average values of 7,000 and 12,000 mm2 found
by Trögeret al. (2012) at depths of between 112 and 125
mm, using shank-type furrowers with a soil water content
of 0.13 kg.kg-1. These values are also lower than those
of Levienet al. (2011) who found a value of 8.568 mm2
(95.2 m3 ha-1, with rows spaced 900 mm apart) using a
furrowing shank set for a depth of 100 mm and a water
content of 0.31 Kg Kg-1. Whereas in comparison with the
results of Mion et al. (2009), the area disturbed by the
rotary furrowers was greater, seeing that those authors
found a mean value of 1,671 mm2, despite the furrowing
shank operating at a depth of 41.5 mm in soil with a water
content of 0.26 kg kg-1. The data found in the present work
are similar to those of Cepiket al. (2010), who when assessing
a furrowing shank in soil with a water content of 0.10 and
0.14 kg kg-1, using working depths of between 60 and 120
mm, and speeds of 4.5 and 6.5 km h-1, found mean values
that varied from 2,768 to 6,116 mm2, close to those found
Type of furrower Revolutions per meter
5.8 7.9
R 3,782.5 bB 5,141.0 bA
S 5,251.0 aB 6,945.1 aA
X 2,987.8 bA 2,694.5 cA
For the variable, area of disturbed soil in the cross section of the furrows, there was interaction only between the factors, type of furrower and number of revolutions per linear metre, as shown above in Table 4. In the present study there was no difference in disturbed area between blocks, therefore soil disturbance was not influenced by the type of cover present on the soil surface, nor by its mass, agreeing with the results of Herzog, Levien, and Trein (2004). As can be seen in Table 7, using the lower value for revolutions per linear metre, there was less soil disturbance with furrower models “R” and “S”. With the higher value for revolutions per metre, the lowest average for area of disturbed soil was obtained with the model “X” followed by models “R” and “S”.
The lower forward speed gave the lowest value for area of disturbed soil in the cross section of the furrow
(4,158 mm2), and the higher forward speed gave the
highest value (4.776 mm2). This behaviour was also seen
in a study by Silveiraet al. (2011), who found average data
for the area of disturbed soil of 6,900 mm2 at the slowest
speed (3.5 km h-1) and 9,700 mm2 at the highest speed
(7.0 km h-1); there being an increase of 41% in the area of
disturbed soil between the lowest and the highest speeds. According to Mion and Benez (2008), greater furrow depths mean a greater disturbed area. As expected, in this study the area of disturbed soil in the cross section of the furrow varied according to the depth and width of the furrow, increasing proportionally with the increase in these dimensions. Similar behaviour was found by Herzog, Levien, and Trein (2004) for shank-type furrowers with cutting discs in native grassland, on an Argisol with an average soil water content of
0.18 kg kg-1, at 5.2 km h-1, in the 0 to 120 mm layer
at two depths (60 and 120 mm). The cross-sectional area of soil disturbed by the furrower was greater at a
depth of 120 mm than at 60 mm. Silveiraet al. (2011),
in a test with a rod-type furrower set to operate at 100 mm, found average data for the area of disturbed soil
of 6,900 and 9,700 mm2.
Table 7 - Averages for area of disturbed soil (mm2) for the interaction between the factors, number of revolutions per metre of
linear displacement and type of furrower
Means with the same lowercase letters in a column and uppercase letters on a line do not differ at 5% significance by Tukey test
CONCLUSIONS
1. Under the conditions of direct seeding, using a rotary furrower driven by the powertrain of a walking tractor, the characteristics of width, depth and disturbed area in the cross section of the furrows are similar to those generated with shank-type furrowers;
2. The type of furrower, the number of revolutions per metre, the forward speed, or a combination of two of these factors, affect the characteristics of the generated furrow;
3. It is possible to use rotary furrowers in a direct-seeding system.
ACKNOWLEDGEMENTS
The authors wish to thank the Coordination for the Improvement of Personnel in Higher Education (CAPES) for granting study scholarships to the first and last authors. Thanks are also due to the National Council for Scientific and Technological Development (CNPq), Order MCT/CNPq/MDA/SAF/DATER NBR 033/2009, for financing part of the project.
REFERENCES
CEPIK, C. T. C.et al. Força de tração e mobilização do solo por hastes sulcadoras de semadoras-adubadoras. Revista Brasileira de Engenharia Agrícola e Ambiental, v. 14 n. 5, p. 561-66, 2010.
CHANG, C. S. Estudo de enxada rotativa vertical para cultivo conservacionista. In: CONGRESSO BRASILEIRO DE ENGENHARIA AGRÍCOLA, 33., 2004, São Pedro.
Anais... São Pedro: Sociedade Brasileira de Engenharia Agrícola, 2004. p. 550-554.
Rev. Ciênc. Agron., v. 46, n. 1, p. 54-63, jan-mar, 2015 63 DENARDIN, J. E.; FAGANELLO, A.; SANTI, A. Falhas na
implementação do Sistema Plantio Direto levam à degradação do solo.Boletim Informativo Federação Brasileira de Plantio Direto, n. 108, 2008. p. 5.
EMPRESA BRASILEIRA DE PESQUISA AGROPECUÁRIA. Sistema Brasileiro de Classificação de Solos. 2. ed. Rio de Janeiro: CNPS, 1999. 412 p.
HERZOG, R. L. da s.; LEVIEN, R.; TREIN, C. R. Produtividade de soja em semeadura direta influenciada por profundidade do sulcador de adubo e doses de resíduo em sistema irrigado e não irrigado.Engenharia Agrícola, v. 24 n. 3, p. 771- 800, 2004.
LEVIEN, R.et al. Semeadura direta de milho com dois tipos de sulcadores de adubo, em nível e no sentido do declive do terreno.
Ciência Rural, v. 41 n. 6, p. 1003-10, 2011.
MACHADO, A. L. T.et al.Máquinas para preparo do solo,
semeadura, adubação e tratamentos culturais. 2. ed. rev. e ampl. Pelotas: Ed. Universitária UFPEL, 2005. 235 p.
MION, R. L.; BENEZ, S. H. Esforços em ferramentas rompedoras de solo de semeadoras de plantio direto.Ciência e Agrotecnologia, v. 32 n. 5, p. 1594-600, 2008.
MION, R. L. et al. Análise tridimensional de esforços em elementos rompedores de semeadoras de plantio direto.Ciência Rural, v. 39 n. 5, p. 1414-19, 2009.
REIS, E. F. et al. Avaliação do desempenho de suas semeadoras-adubadoras de plantio direto em diferentes teores
de água em um solo argiloso.Engenharia na Agricultura, v. 10, n. 1/4, p. 61-68, 2002.
RICHTER, A. S.; CAMPOS, A. C.; BENASSI, D. A.Referências em plantio direto para agricultura familiar do centro-sul do Paraná. Londrina: IAPAR. 2002. 64 p.
ROMEIRO FILHO, E. Uma abordagem centrada no usuário para o projeto de máquinas agrícolas de tração animal.Gestão & Produção, v. 19 n. 1, p. 93-102, 2012.
SILVA, J. G. Agência de Informação Embrapa. Feijão – Plantio Direto. (2005 a 2007). Brasília, DF. 2009. Parque Estação Biológica. Disponível em: <http://www.agencia.cnptia. embrapa. br/Agencia4/AG01/arvore/AG01_102_1311200215105.html> Acesso em: 12 set. 2012.
SILVEIRA, J. C. M.et al.. Furrow depth, soil disturbance area and draft force of a seeder-fertilizer at different seeding speeds.
Revista Ceres, v. 58 n. 3, p. 293-298, 2011.
SIQUEIRA, R. Milho: Semeadoras-Adubadoras para sistema plantio direto com qualidade. 2010. Disponível em: <http:// www.leb.esalq.usp.br>. Acesso em: 12 set. 2012.
TEIXEIRA, S. S. Projeto conceitual de uma semeadora de milho e feijão voltada para a agricultura familiar e agroecológica. 2008. 109 f. Dissertação (Mestrado em Ciências) - Universidade Federal de Pelotas, Pelotas, 2008.
TRÖGER, H. C. H.et al. Análise dos esforços em sulcadores empregados em semeadoras-adubadoras de baixa potência.